Home > Comparison > Technology > APH vs MVIS
The strategic rivalry between Amphenol Corporation and MicroVision, Inc. shapes the hardware and equipment sector’s future. Amphenol, a capital-intensive industrial leader, designs and manufactures connectors and sensor systems globally. In contrast, MicroVision is a nimble innovator focused on lidar and scanning technologies for automotive and augmented reality applications. This analysis pits robust industrial scale against cutting-edge growth potential to identify which trajectory delivers superior risk-adjusted returns for a diversified portfolio.
Table of contents
Companies Overview
Amphenol and MicroVision stand as key players in the hardware and equipment sector with vastly different scales and specialties.
Amphenol Corporation: Connector and Interconnect Powerhouse
Amphenol dominates the electrical and fiber optic connectors market, generating revenue through diverse segments like harsh environments and communications solutions. Its strategic focus in 2026 centers on expanding value-added products such as backplane interconnects and sensor systems. Serving automotive, aerospace, and mobile networks, it leverages a broad global footprint and a robust distribution network.
MicroVision, Inc.: Innovative Lidar and Display Technology Pioneer
MicroVision specializes in lidar sensors and scanning technology for autonomous driving and augmented reality. Its revenue stems from proprietary micro-electrical mechanical systems and laser beam scanning modules sold mainly to OEMs. In 2026, the company prioritizes advancing long-range lidar and enhancing AR display modules, positioning itself at the cutting edge of sensor innovation with a compact workforce.
Strategic Collision: Similarities & Divergences
Both firms operate in hardware components but diverge sharply in business models—Amphenol pursues scale and product breadth while MicroVision focuses on niche innovation. Their competition unfolds primarily in supplying advanced sensor and interconnect technologies to OEMs. Amphenol offers a stable, diversified profile; MicroVision presents a high-risk, high-reward growth story driven by emerging autonomous and AR markets.
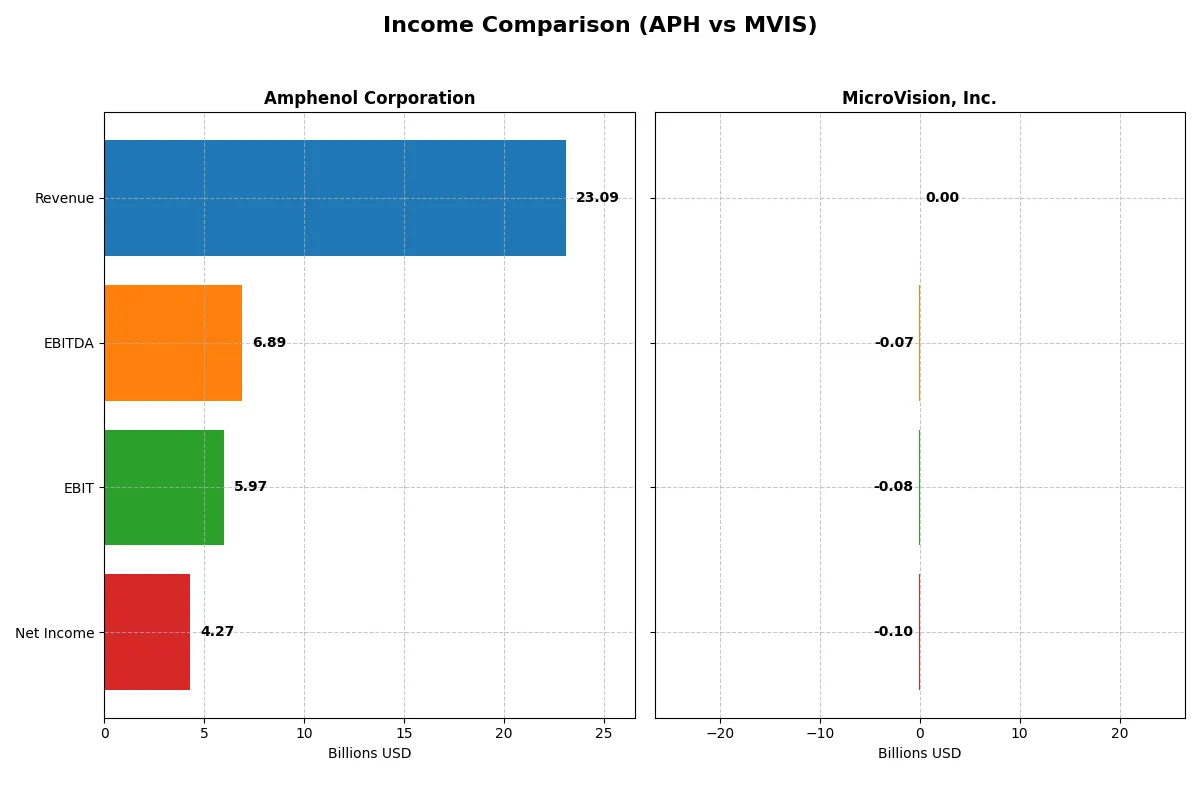
Income Statement Comparison
This data dissects the core profitability and scalability of both corporate engines to reveal who dominates the bottom line:
| Metric | Amphenol Corporation (APH) | MicroVision, Inc. (MVIS) |
|---|---|---|
| Revenue | 23B | 4.7M |
| Cost of Revenue | 14.6B | 7.5M |
| Operating Expenses | 2.5B | 83M |
| Gross Profit | 8.5B | -2.8M |
| EBITDA | 6.9B | -71M |
| EBIT | 6.0B | -75M |
| Interest Expense | 368M | 4.5M |
| Net Income | 4.3B | -97M |
| EPS | 3.51 | -0.46 |
| Fiscal Year | 2025 | 2024 |
Income Statement Analysis: The Bottom-Line Duel
This income statement comparison uncovers the true efficiency and profitability of two distinct corporate engines in their latest fiscal years.
Amphenol Corporation Analysis
Amphenol’s revenue surged from $15.2B in 2024 to $23.1B in 2025, reflecting strong top-line momentum. Net income rose sharply to $4.27B, pushing net margin to a healthy 18.5%. Gross margin expanded to 36.9%, supported by disciplined cost control, while operating expenses grew proportionally, demonstrating scalable efficiency.
MicroVision, Inc. Analysis
MicroVision’s revenue declined 35% to $4.7M in 2024, with a gross loss of $2.8M highlighting deep operational challenges. Net loss widened to $97M, translating to a negative net margin exceeding -2000%. Despite a modest EBIT improvement, persistent high R&D and operating costs undermine profitability and cash flow sustainability.
Margin Power vs. Revenue Scale
Amphenol dominates with robust revenue growth and expanding margins, delivering consistent bottom-line improvement. MicroVision struggles with shrinking sales and escalating losses, signaling structural inefficiencies. Investors seeking stable earnings and operational leverage find Amphenol’s profile far more compelling in this income statement duel.
Financial Ratios Comparison
These vital ratios act as a diagnostic tool to expose the underlying fiscal health, valuation premiums, and capital efficiency of the companies compared below:
| Ratios | Amphenol Corporation (APH) | MicroVision, Inc. (MVIS) |
|---|---|---|
| ROE | 24.8% | -198.7% |
| ROIC | 14.9% | -83.7% |
| P/E | 34.5 | -2.83 |
| P/B | 8.54 | 5.63 |
| Current Ratio | 2.37 | 1.79 |
| Quick Ratio | 1.75 | 1.74 |
| D/E | 0.74 | 1.06 |
| Debt-to-Assets | 34.0% | 42.6% |
| Interest Coverage | 15.1 | -19.2 |
| Asset Turnover | 0.71 | 0.04 |
| Fixed Asset Turnover | 7.26 | 0.20 |
| Payout Ratio | 24.6% | 0% |
| Dividend Yield | 0.71% | 0% |
| Fiscal Year | 2024 | 2024 |
Efficiency & Valuation Duel: The Vital Signs
Financial ratios serve as a company’s DNA, exposing hidden risks and revealing operational strengths critical for investment decisions.
Amphenol Corporation
Amphenol delivers strong profitability with a 24.75% ROE and a favorable 15.92% net margin, signaling efficient operations. However, its valuation appears stretched, with a high P/E of 34.49 and P/B of 8.54. Shareholders receive modest dividends at 0.71%, while the company reinvests in R&D to sustain growth.
MicroVision, Inc.
MicroVision suffers from severe losses, reflected in negative ROE (-198.72%) and net margin (-2063.78%), showing operational inefficiency. Its P/E ratio is negative, indicating a lack of earnings, while P/B at 5.63 remains high relative to fundamentals. The firm pays no dividends, heavily investing in R&D to drive future prospects.
Premium Valuation vs. Operational Safety
Amphenol balances robust profitability with a premium valuation, offering operational safety and modest shareholder returns. MicroVision’s unfavorable ratios highlight high risk and uncertainty despite aggressive R&D. Conservative investors may favor Amphenol’s stability, while risk-tolerant profiles might consider MicroVision’s growth potential.
Which one offers the Superior Shareholder Reward?
I see Amphenol Corporation (APH) delivers steady dividends with a 0.85% yield and a sustainable payout ratio near 25%. It backs this with a robust free cash flow of 1.8/share and consistent buybacks, amplifying shareholder returns. MicroVision (MVIS) pays no dividends and burns cash, reflecting a high-risk growth stance. Its losses and negative margins undermine near-term returns despite R&D investments. I judge APH’s balanced dividend-plus-buyback approach offers the superior total return profile in 2026, combining income and capital appreciation with lower risk.
Comparative Score Analysis: The Strategic Profile
The radar chart reveals the fundamental DNA and trade-offs of Amphenol Corporation and MicroVision, Inc.:
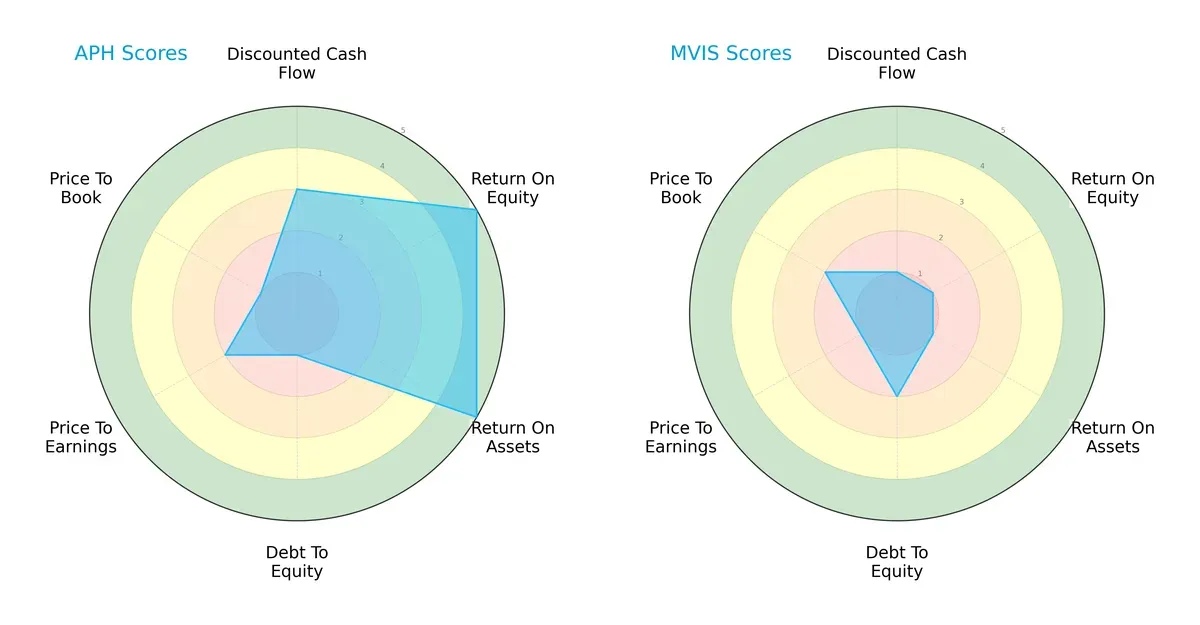
Amphenol displays a more balanced profile with strong ROE and ROA scores (5 each), indicating superior profitability and asset utilization. However, its debt-to-equity and price-to-book scores are weak (1 each), signaling potential leverage risk and possible overvaluation concerns. MicroVision relies on a weaker edge, showing uniformly low scores in profitability and valuation metrics, with only a moderate debt-to-equity score (2) indicating better balance sheet conservatism but overall financial fragility.
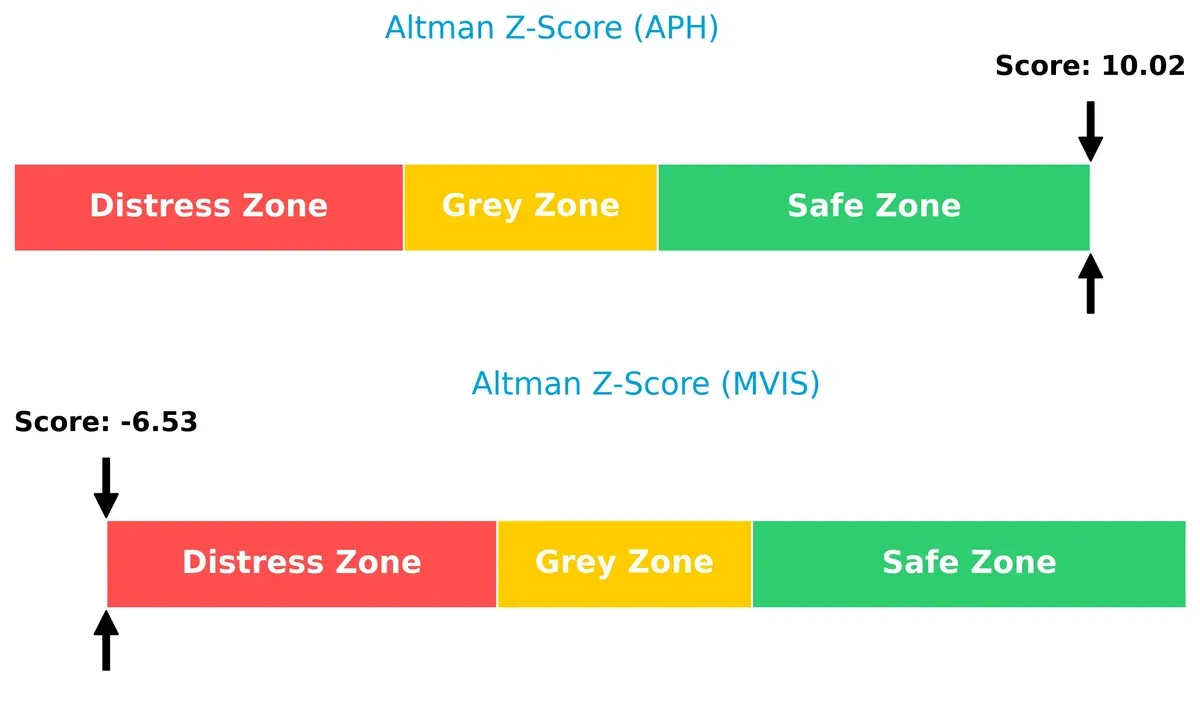
Bankruptcy Risk: Solvency Showdown
Amphenol’s Altman Z-Score of 10.0 places it securely in the safe zone, contrasting sharply with MicroVision’s distress zone score of -6.5. This stark delta highlights Amphenol’s strong solvency and survival prospects in this economic cycle versus MicroVision’s elevated bankruptcy risk:
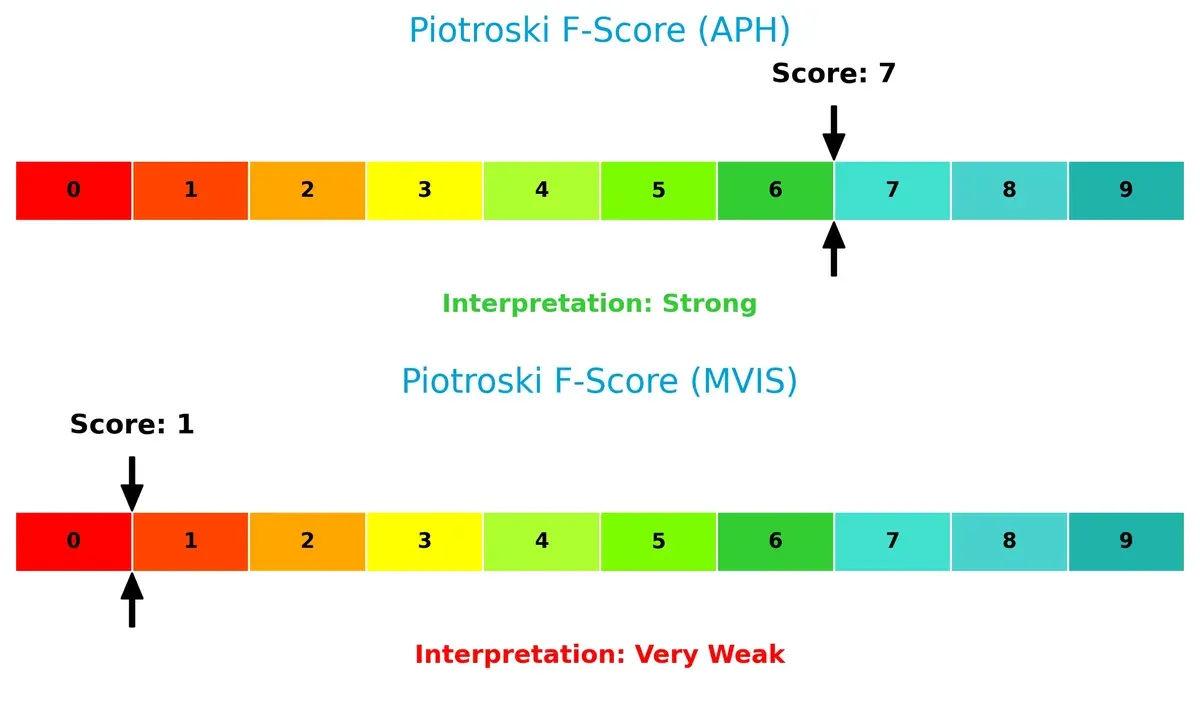
Financial Health: Quality of Operations
Amphenol’s Piotroski F-Score of 7 signals robust financial health with strong operational quality. MicroVision’s score of 1 raises red flags, indicating weak internal metrics and operational distress relative to its peer:
How are the two companies positioned?
This section dissects the operational DNA of Amphenol Corporation and MicroVision by comparing their revenue distribution and internal dynamics. The goal is to confront their economic moats to identify which model offers the most resilient and sustainable advantage today.
Revenue Segmentation: The Strategic Mix
This visual comparison dissects how Amphenol Corporation and MicroVision, Inc. diversify their income streams and where their primary sector bets lie:
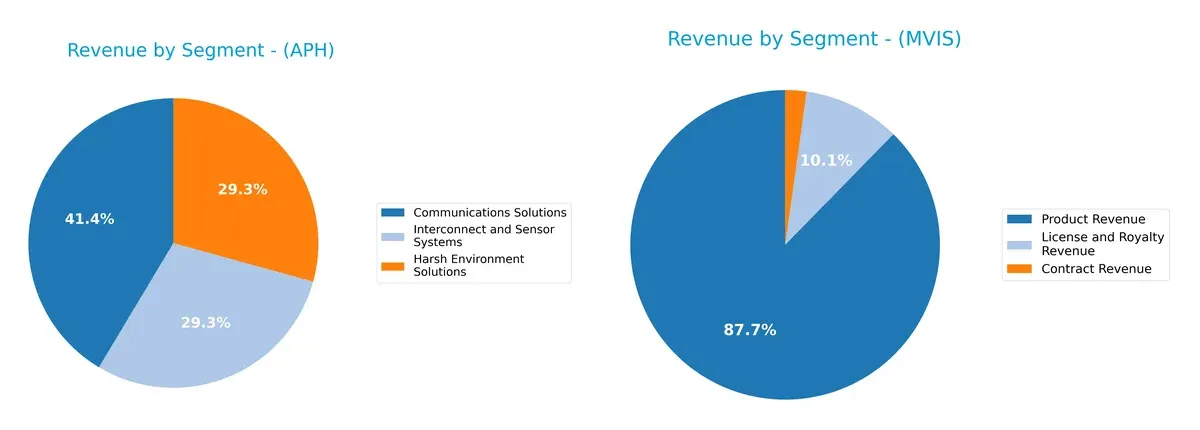
Amphenol dominates with a balanced revenue mix across Communications Solutions ($6.4B), Harsh Environment Solutions ($4.5B), and Interconnect and Sensor Systems ($4.5B). This diversification mitigates concentration risk and anchors its infrastructure dominance. MicroVision relies heavily on Product Revenue ($4.1M) and License and Royalty Revenue ($475K), revealing a less diversified portfolio with higher dependency on technology licensing, which increases exposure to market volatility and licensing cycle risks.
Strengths and Weaknesses Comparison
This table compares the strengths and weaknesses of Amphenol Corporation and MicroVision, Inc.:
Amphenol Corporation Strengths
- Diverse revenue streams across communications, harsh environments, and sensor systems
- Favorable profitability with 15.92% net margin and 24.75% ROE
- Strong liquidity ratios: current ratio 2.37 and quick ratio 1.75
- High fixed asset turnover at 7.26 indicating efficient asset use
- Global presence with significant revenues from U.S., China, and other foreign markets
MicroVision, Inc. Strengths
- Favorable PE ratio suggesting undervaluation
- Positive current and quick ratios around 1.74–1.79 supporting liquidity
- Neutral debt to assets ratio at 42.62%
Amphenol Corporation Weaknesses
- High valuation metrics: PE 34.49 and PB 8.54 may pressure future returns
- Moderate debt levels with D/E at 0.74 and 33.96% debt to assets
- Low dividend yield at 0.71%
MicroVision, Inc. Weaknesses
- Severe unprofitability with negative net margin (-2063.78%) and ROE (-198.72%)
- Poor capital efficiency: asset turnover 0.04 and fixed asset turnover 0.2
- High leverage with D/E at 1.06 and negative interest coverage (-16.87)
- Zero dividend yield and unfavorable PB ratio at 5.63
Amphenol’s strengths lie in diversified revenue sources, strong profitability, and global footprint, offset by stretched valuation multiples. MicroVision faces significant profitability and efficiency challenges despite reasonable liquidity. These contrasts highlight Amphenol’s operational scale versus MicroVision’s financial distress.
The Moat Duel: Analyzing Competitive Defensibility
A structural moat shields long-term profits from relentless competitive erosion. Let’s dissect how these two firms defend their market positions:
Amphenol Corporation: Diverse Industrial Integration
Amphenol’s moat stems from broad switching costs and product complexity. Its 25.8% EBIT margin and 5.9% ROIC spread over WACC confirm durable value creation. Innovations in harsh environment connectors may widen this moat in 2026.
MicroVision, Inc.: Emerging Tech Innovation
MicroVision relies on intangible assets and early-stage tech in lidar and AR. Despite growing ROIC, its negative margins and value destruction highlight fragility compared to Amphenol. New product launches could disrupt markets but risk capital inefficiency.
Industrial Breadth vs. Tech Pioneer Fragility
Amphenol commands a wider, more durable moat through operational scale and margin stability. MicroVision’s moat is narrower and riskier despite innovation potential. Amphenol is better positioned to defend and expand its market share in 2026.
Which stock offers better returns?
The past year witnessed starkly contrasting price trends between Amphenol Corporation and MicroVision, Inc., marked by strong gains and sharp declines respectively.
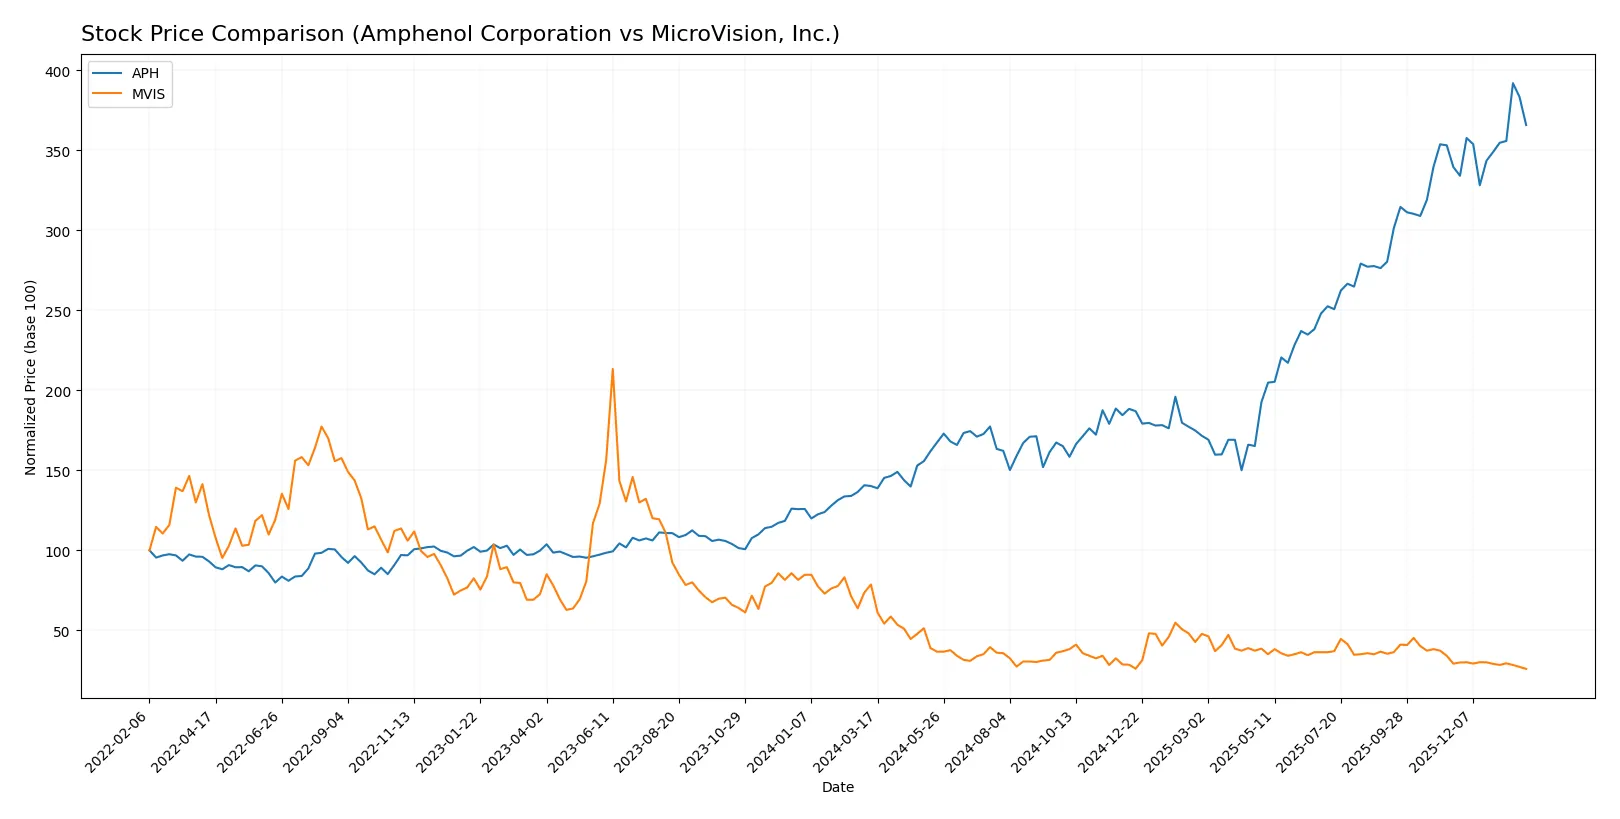
Trend Comparison
Amphenol’s stock surged 160.97% over the last 12 months, showing a bullish trend with accelerating momentum and a high volatility level of 28.51%. It peaked at 154.39 and bottomed at 54.65.
MicroVision’s stock fell 67.1% in the same period, exhibiting a bearish trend with deceleration and minimal volatility of 0.26%. Its highest price was 2.47, lowest 0.81.
Amphenol outperformed MicroVision decisively, delivering the highest market returns with sustained upward acceleration versus MicroVision’s prolonged decline.
Target Prices
Analysts set a mixed outlook with varied upside potential for Amphenol Corporation and MicroVision, Inc.
| Company | Target Low | Target High | Consensus |
|---|---|---|---|
| Amphenol Corporation | 139 | 210 | 174.13 |
| MicroVision, Inc. | 5 | 5 | 5 |
Amphenol’s target consensus at 174.13 suggests about 21% upside from the current 144.08 price. MicroVision’s single target at 5 implies significant appreciation from 0.81, reflecting high growth expectations but elevated risk.

Don’t Let Luck Decide Your Entry Point
Optimize your entry points with our advanced ProRealTime indicators. You’ll get efficient buy signals with precise price targets for maximum performance. Start outperforming now!
How do institutions grade them?
The institutional grades for Amphenol Corporation and MicroVision, Inc. are summarized below:
Amphenol Corporation Grades
The latest reliable grades from major institutions for Amphenol Corporation are:
| Grading Company | Action | New Grade | Date |
|---|---|---|---|
| Citigroup | Maintain | Buy | 2026-01-29 |
| Barclays | Maintain | Overweight | 2026-01-29 |
| JP Morgan | Maintain | Overweight | 2026-01-27 |
| UBS | Maintain | Buy | 2026-01-14 |
| Citigroup | Maintain | Buy | 2026-01-12 |
| Barclays | Upgrade | Overweight | 2026-01-12 |
| Truist Securities | Maintain | Buy | 2025-12-19 |
| Barclays | Maintain | Equal Weight | 2025-11-13 |
| Citigroup | Maintain | Buy | 2025-10-23 |
| Truist Securities | Maintain | Buy | 2025-10-23 |
MicroVision, Inc. Grades
The latest reliable grades from recognized institutions for MicroVision, Inc. are:
| Grading Company | Action | New Grade | Date |
|---|---|---|---|
| D. Boral Capital | Maintain | Buy | 2026-01-27 |
| D. Boral Capital | Maintain | Buy | 2025-12-16 |
| D. Boral Capital | Maintain | Buy | 2025-11-12 |
| WestPark Capital | Maintain | Buy | 2025-10-21 |
| WestPark Capital | Maintain | Buy | 2025-09-05 |
| D. Boral Capital | Maintain | Buy | 2025-09-02 |
| WestPark Capital | Maintain | Buy | 2025-08-27 |
| D. Boral Capital | Maintain | Buy | 2025-08-11 |
| D. Boral Capital | Maintain | Buy | 2025-05-21 |
| D. Boral Capital | Maintain | Buy | 2025-05-13 |
Which company has the best grades?
Amphenol Corporation consistently receives strong Buy and Overweight ratings from top-tier banks, signaling robust institutional confidence. MicroVision, Inc. holds steady Buy ratings but from less globally recognized firms, suggesting more modest institutional support. This disparity may influence investor perception of risk and growth potential.
Risks specific to each company
The following categories identify critical pressure points and systemic threats facing Amphenol Corporation and MicroVision, Inc. in the 2026 market environment:
1. Market & Competition
Amphenol Corporation
- Established global presence with diversified segments; faces intense competition in hardware connectors.
MicroVision, Inc.
- Niche lidar and AR tech market; highly competitive with rapid innovation and emerging rivals.
2. Capital Structure & Debt
Amphenol Corporation
- Moderate debt-to-equity ratio (0.74), manageable leverage with strong interest coverage (16.23).
MicroVision, Inc.
- High debt-to-equity (1.06) and negative interest coverage (-16.87) signal financial stress and refinancing risk.
3. Stock Volatility
Amphenol Corporation
- Beta 1.214 indicates moderate market sensitivity, reflecting steadier stock performance.
MicroVision, Inc.
- Higher beta 1.274 suggests elevated volatility and investor risk exposure.
4. Regulatory & Legal
Amphenol Corporation
- Broad international footprint exposes it to multiple regulatory frameworks, increasing compliance complexity.
MicroVision, Inc.
- Emerging tech focus raises regulatory scrutiny risks, especially in automotive safety and autonomous driving sectors.
5. Supply Chain & Operations
Amphenol Corporation
- Large-scale operations with diversified suppliers mitigate supply chain disruptions risk.
MicroVision, Inc.
- Smaller scale and specialized components increase vulnerability to supply chain bottlenecks.
6. ESG & Climate Transition
Amphenol Corporation
- Larger firm likely faces stricter ESG reporting and pressure to reduce carbon footprint.
MicroVision, Inc.
- Innovation-driven, with potential ESG advantages but limited disclosure and track record.
7. Geopolitical Exposure
Amphenol Corporation
- Significant global sales, including China, exposes it to geopolitical tensions and tariffs.
MicroVision, Inc.
- Primarily US-based, reducing direct geopolitical risks but dependent on global supply chains.
Which company shows a better risk-adjusted profile?
Amphenol’s most impactful risk is geopolitical exposure given its global operations. MicroVision’s critical risk is its precarious capital structure and negative profitability. Amphenol demonstrates a far stronger risk-adjusted profile, supported by high Altman Z-score (10.02) and solid Piotroski score (7), while MicroVision languishes in distress with negative financial metrics and weak scores.
Final Verdict: Which stock to choose?
Amphenol Corporation’s superpower lies in its durable competitive advantage and proven ability to generate strong returns on invested capital well above its cost of capital. This efficiency fuels consistent growth and robust cash flow. A point of vigilance is its relatively high valuation multiples, which could pressure returns if growth slows. It suits portfolios targeting steady, long-term growth with moderate risk tolerance.
MicroVision, Inc. offers a strategic moat centered on pioneering technology and potential future market disruption. However, it currently struggles with value destruction and negative profitability, reflecting high operational risks. Compared to Amphenol, it presents a less stable profile but could appeal to investors willing to gamble on a turnaround. It fits speculative or high-risk growth portfolios focused on innovation plays.
If you prioritize durable value creation and stable cash generation, Amphenol outshines as the compelling choice due to its proven moat and growing profitability. However, if you seek speculative upside and are comfortable with elevated risk, MicroVision might offer superior growth potential despite its current financial headwinds. Both scenarios demand careful risk management aligned with your investment horizon.
Disclaimer: Investment carries a risk of loss of initial capital. The past performance is not a reliable indicator of future results. Be sure to understand risks before making an investment decision.
Go Further
I encourage you to read the complete analyses of Amphenol Corporation and MicroVision, Inc. to enhance your investment decisions: