Home > Comparison > Technology > APH vs MLAB
The competitive dynamic between Amphenol Corporation and Mesa Laboratories, Inc. shapes critical innovation in the Technology sector. Amphenol, a capital-intensive hardware and equipment powerhouse, contrasts with Mesa, a specialized life sciences tools provider focused on quality control and calibration. This head-to-head reflects a broader debate between scale-driven manufacturing and niche scientific instrumentation. This analysis aims to identify which model delivers superior risk-adjusted returns for a diversified portfolio in today’s evolving market landscape.
Table of contents
Companies Overview
Amphenol Corporation and Mesa Laboratories, Inc. stand as key players in the hardware and equipment sector, each commanding unique niches.
Amphenol Corporation: Global Connector Powerhouse
Amphenol Corporation dominates as a leading designer and manufacturer of electrical and fiber optic connectors. It generates revenue through diverse segments: harsh environment solutions, communications, and sensor systems. In 2026, Amphenol strategically prioritizes innovation in high-speed and fiber optic interconnect products to sustain its competitive edge across multiple global industries.
Mesa Laboratories, Inc.: Precision Life Sciences Instruments
Mesa Laboratories focuses on life sciences tools and quality control products serving hospitals, dental, and pharmaceutical sectors. Its revenue stems from sterilization indicators, biopharmaceutical development, calibration solutions, and clinical genomics technology. The 2026 strategy emphasizes expanding automated protein analysis and genomic testing systems to capture growth in healthcare diagnostics.
Strategic Collision: Similarities & Divergences
Both companies excel in high-precision hardware for specialized industries, but Amphenol pursues broad industrial applications while Mesa targets niche life sciences markets. Their primary battleground lies in delivering reliable, technologically advanced instruments. Amphenol’s scale and diversified product base contrast with Mesa’s focused innovation, shaping distinct risk and growth profiles for investors.
Income Statement Comparison
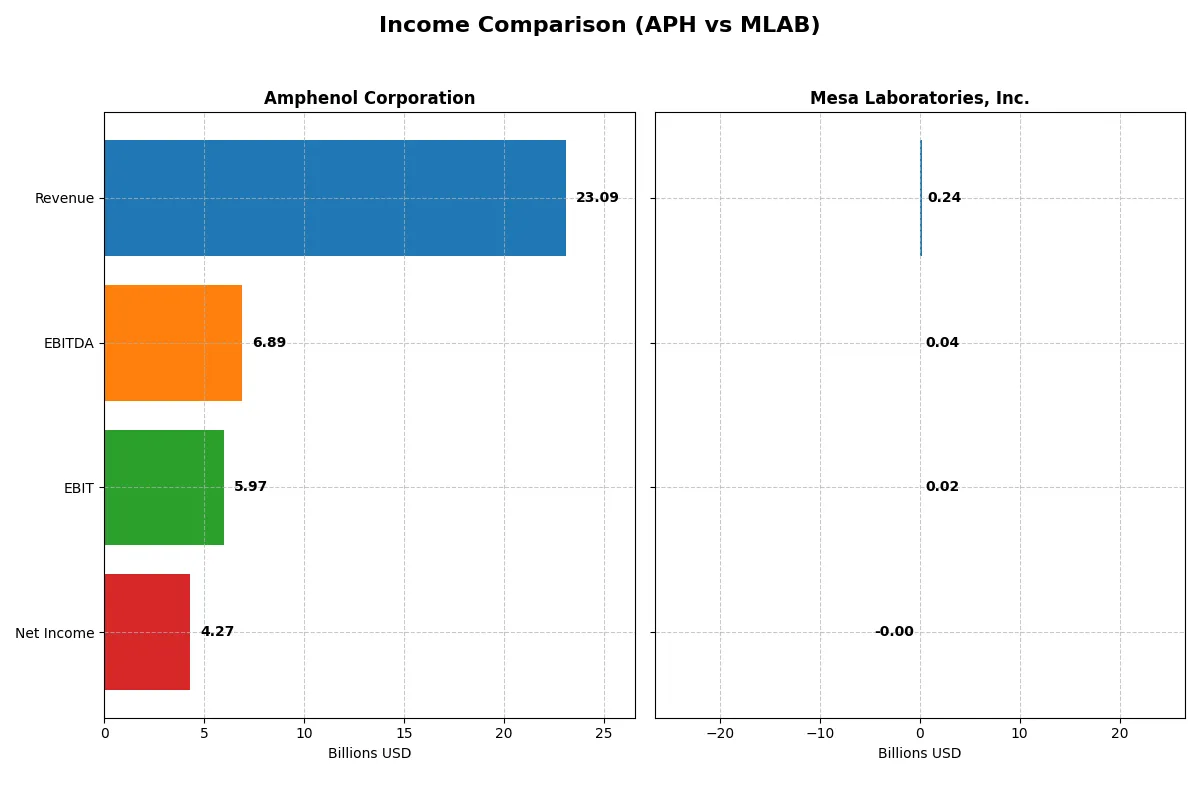
This data dissects the core profitability and scalability of both corporate engines to reveal who dominates the bottom line:
| Metric | Amphenol Corporation (APH) | Mesa Laboratories, Inc. (MLAB) |
|---|---|---|
| Revenue | 23B | 241M |
| Cost of Revenue | 14.6B | 90M |
| Operating Expenses | 2.55B | 135M |
| Gross Profit | 8.5B | 151M |
| EBITDA | 6.89B | 42M |
| EBIT | 5.97B | 18M |
| Interest Expense | 368M | 12M |
| Net Income | 4.27B | -2M |
| EPS | 3.51 | -0.36 |
| Fiscal Year | 2025 | 2025 |
Income Statement Analysis: The Bottom-Line Duel
This income statement comparison reveals how efficiently each company converts sales into profits, showcasing their operational strength and financial momentum.
Amphenol Corporation Analysis
Amphenol’s revenue surged from $10.9B in 2021 to $23.1B in 2025, with net income climbing from $1.59B to $4.27B. Its gross margin remains healthy at 36.9%, and net margin stands strong at 18.5%. In 2025, Amphenol accelerated earnings growth, nearly doubling EBIT and net income, signaling robust operational efficiency and scaling power.
Mesa Laboratories, Inc. Analysis
Mesa’s revenue grew steadily from $134M in 2021 to $241M in 2025. However, net income swung from a $3.3M profit in 2021 to a slight $2M loss in 2025. Gross margin holds at a solid 62.6%, but net margin slipped negative at -0.8%. Despite recent improvements in EBIT and revenue growth, profitability struggles highlight ongoing cost and expense challenges.
Margin Strength vs. Profit Scale
Amphenol dominates with rapid revenue and profit expansion alongside strong margins, showcasing superior capital allocation and scale. Mesa improves revenue and gross profit but fails to convert growth into net earnings. For investors, Amphenol’s profile offers a clearer path to sustainable earnings and shareholder value creation.
Financial Ratios Comparison
These vital ratios act as a diagnostic tool to expose the underlying fiscal health, valuation premiums, and capital efficiency of the companies compared below:
| Ratios | Amphenol Corporation (APH) | Mesa Laboratories, Inc. (MLAB) |
|---|---|---|
| ROE | 24.8% | -1.2% |
| ROIC | 14.9% | -1.4% |
| P/E | 34.5 | -326.3 |
| P/B | 8.54 | 4.03 |
| Current Ratio | 2.37 | 0.63 |
| Quick Ratio | 1.75 | 0.47 |
| D/E | 0.74 | 1.14 |
| Debt-to-Assets | 34.0% | 41.9% |
| Interest Coverage | 15.1 | 1.38 |
| Asset Turnover | 0.71 | 0.56 |
| Fixed Asset Turnover | 7.26 | 7.45 |
| Payout ratio | 24.6% | -176% |
| Dividend yield | 0.71% | 0.54% |
| Fiscal Year | 2024 | 2025 |
Efficiency & Valuation Duel: The Vital Signs
Financial ratios act as a company’s DNA, exposing hidden risks and operational strengths essential for investment insights.
Amphenol Corporation
Amphenol delivers strong profitability with a 24.75% ROE and a 15.92% net margin, signaling efficient operations. However, its P/E of 34.49 suggests the stock trades at a premium. The firm returns value through a modest 0.71% dividend yield, balancing shareholder payouts with continued investment in R&D and growth.
Mesa Laboratories, Inc.
Mesa Laboratories shows weak profitability with negative ROE (-1.24%) and net margin (-0.82%), indicating operational struggles. Despite a favorable P/E due to negative earnings, its high debt-to-equity ratio of 1.14 and low liquidity ratios flag financial risk. Shareholder returns remain minimal, focusing on reinvestment to stabilize and grow.
Premium Valuation vs. Operational Safety
Amphenol offers a better balance of profitability and operational efficiency despite its stretched valuation. Mesa exhibits higher financial risk and unfavorable profitability metrics. Investors prioritizing stability and returns may lean toward Amphenol, while those seeking turnaround potential face greater risk with Mesa.
Which one offers the Superior Shareholder Reward?
I observe Amphenol Corporation (APH) balances moderate dividends with steady buybacks, yielding 0.71% and a payout ratio near 25%. Mesa Laboratories (MLAB) offers a smaller dividend yield around 0.54% but shows aggressive buybacks supported by strong free cash flow of 7.8/share. APH’s model is more sustainable given its consistent FCF coverage and dividend payout stability, while MLAB’s low current ratio and negative net margins raise risk. I conclude APH offers a superior total return profile in 2026 due to its disciplined capital allocation and sustainable shareholder rewards.
Comparative Score Analysis: The Strategic Profile
The radar chart reveals the fundamental DNA and trade-offs of Amphenol Corporation and Mesa Laboratories, Inc., highlighting their core financial strengths and vulnerabilities:
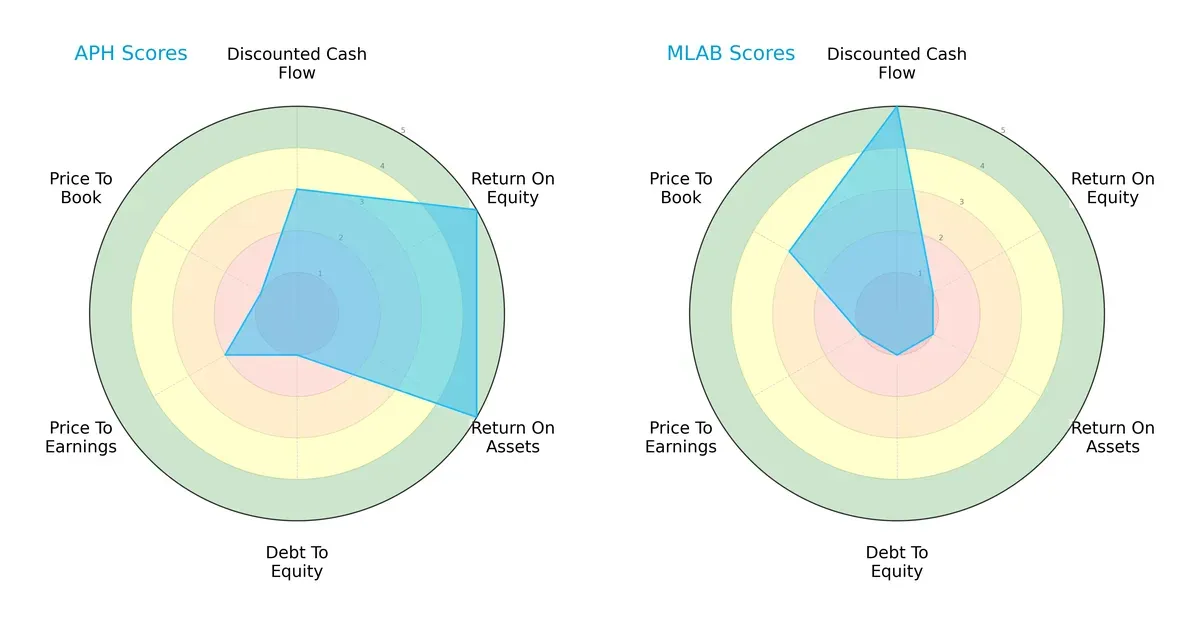
Amphenol shows a balanced profile with strong ROE and ROA scores (5 each), indicating efficient profit and asset use. However, it struggles with debt-to-equity and valuation metrics, scoring very unfavorably there. Mesa Laboratories relies heavily on its discounted cash flow strength (score 5) but suffers from weak profitability and valuation scores. Amphenol offers consistency; Mesa bets on future cash flows.
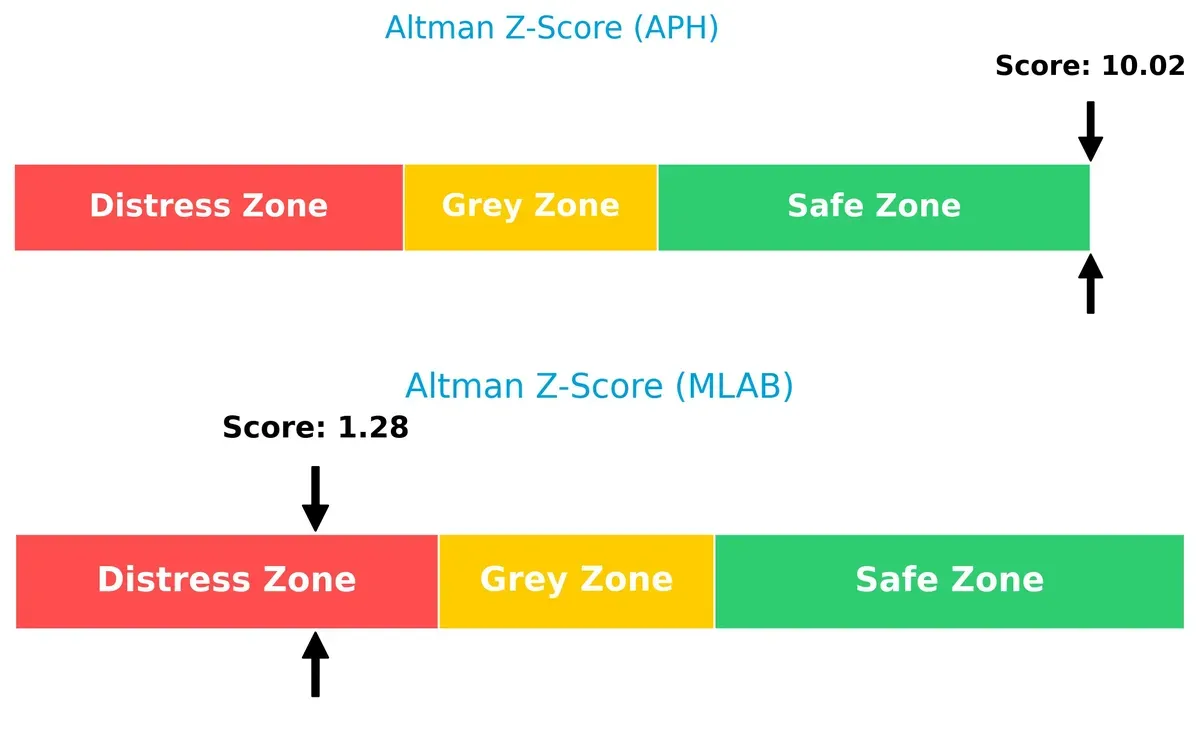
Bankruptcy Risk: Solvency Showdown
Amphenol’s Altman Z-Score of 10.0 places it firmly in the safe zone, signaling robust long-term survival potential. Mesa’s 1.28 score warns of financial distress and bankruptcy risk in this cycle:
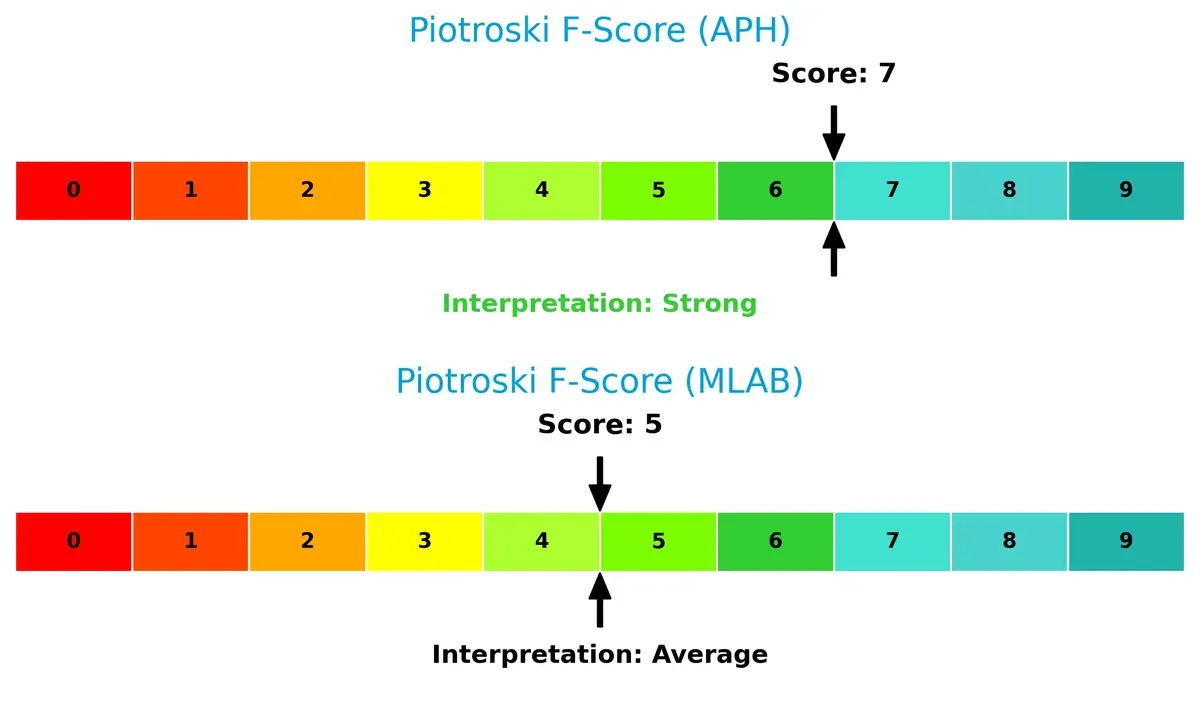
Financial Health: Quality of Operations
Amphenol’s Piotroski F-Score of 7 signals strong financial health and operational quality. Mesa’s 5 indicates average health, suggesting some internal metric red flags compared to Amphenol’s solid footing:
How are the two companies positioned?
This section dissects the operational DNA of Amphenol and Mesa Laboratories by comparing their revenue distribution and internal strengths and weaknesses. The goal is to confront their economic moats and identify which model offers the most resilient, sustainable competitive advantage today.
Revenue Segmentation: The Strategic Mix
This visual comparison dissects how Amphenol Corporation and Mesa Laboratories diversify their income streams and highlights their primary sector bets:
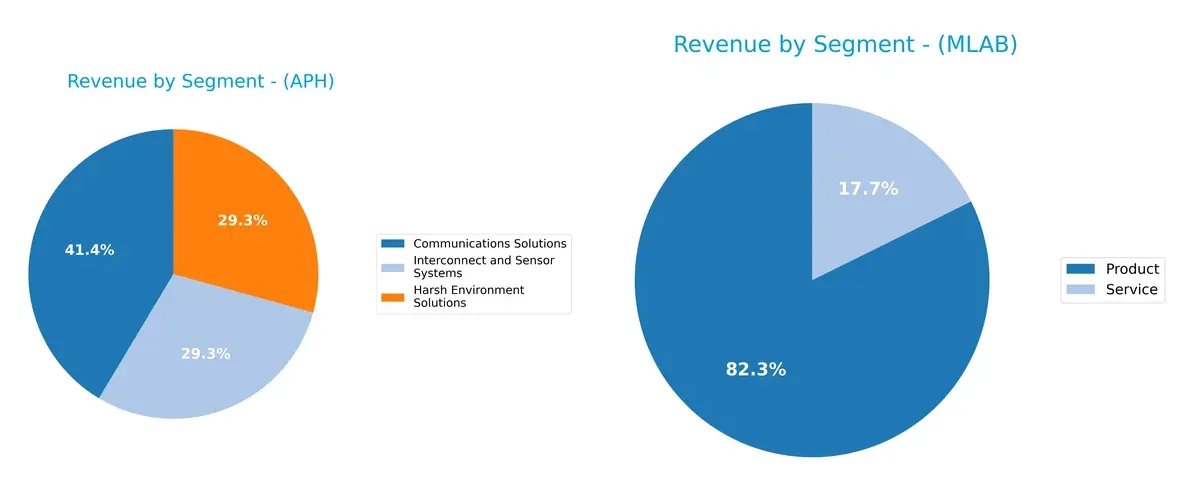
Amphenol commands a broad base with Communications Solutions at $6.38B, closely rivaled by Harsh Environment and Interconnect segments near $4.5B each. Mesa Laboratories leans on a less diversified model, with its Product segment anchoring $198M in 2025 and smaller Service streams. Amphenol’s spread mitigates concentration risk and signals ecosystem lock-in, while Mesa’s reliance on a core product line may expose it to sector-specific vulnerabilities.
Strengths and Weaknesses Comparison
This table compares the strengths and weaknesses of Amphenol Corporation and Mesa Laboratories, Inc.:
Amphenol Corporation Strengths
- Diverse product segments with strong Communications and Harsh Environment Solutions
- Favorable net margin (15.92%) and ROE (24.75%)
- Solid liquidity ratios (current ratio 2.37, quick ratio 1.75)
- High fixed asset turnover (7.26) indicating efficient asset use
- Significant global presence with balanced US, China, and other foreign revenues
Mesa Laboratories Strengths
- Favorable WACC (6.56%) implying low capital costs
- Positive fixed asset turnover (7.45) shows efficient asset utilization
- Product and service revenue diversification, including biopharmaceutical and calibration solutions
- Presence in US, China, and other markets with consistent revenue streams
Amphenol Corporation Weaknesses
- Unfavorable high valuation multiples (PE 34.49, PB 8.54) may pressure returns
- Dividend yield low at 0.71%
- Debt/equity moderate (0.74) but could limit flexibility
- Asset turnover moderate (0.71) despite high fixed asset turnover
Mesa Laboratories Weaknesses
- Negative profitability metrics (net margin -0.82%, ROE -1.24%, ROIC -1.45%)
- Weak liquidity (current ratio 0.63, quick ratio 0.47) signals potential short-term stress
- High debt/equity (1.14) and low interest coverage (1.5) increase financial risk
- Unfavorable PB (4.03) and dividend yield (0.54%) reflect valuation and return concerns
Both companies show strengths in asset efficiency and global reach, but Amphenol’s profitability and liquidity outpace Mesa’s. Mesa faces significant profitability and liquidity challenges that could impact strategic options.
The Moat Duel: Analyzing Competitive Defensibility
A structural moat is the only reliable shield protecting long-term profits from relentless competitive erosion:
Amphenol Corporation (APH): Durable Engineering & Scale Advantage
I identify Amphenol’s moat in its cost advantage and broad product integration. High ROIC above WACC confirms efficient capital use and margin stability. Expansion into harsh environment connectors deepens its moat in 2026.
Mesa Laboratories, Inc. (MLAB): Specialized Life Sciences Niche
Mesa’s moat relies on intangible assets and technical expertise, contrasting Amphenol’s scale. However, its declining ROIC signals weakening profitability. Opportunities in biopharma automation offer growth but challenge sustaining its moat.
Scale & Efficiency vs. Niche Expertise: The Moat Battle
Amphenol’s wider moat rests on superior cost structure and growing ROIC. Mesa’s niche focus lacks durability amid declining returns. Amphenol is better equipped to defend market share and generate lasting value.
Which stock offers better returns?
The past year shows starkly different price trajectories for Amphenol Corporation and Mesa Laboratories, with Amphenol demonstrating strong gains amid rising trading volumes.
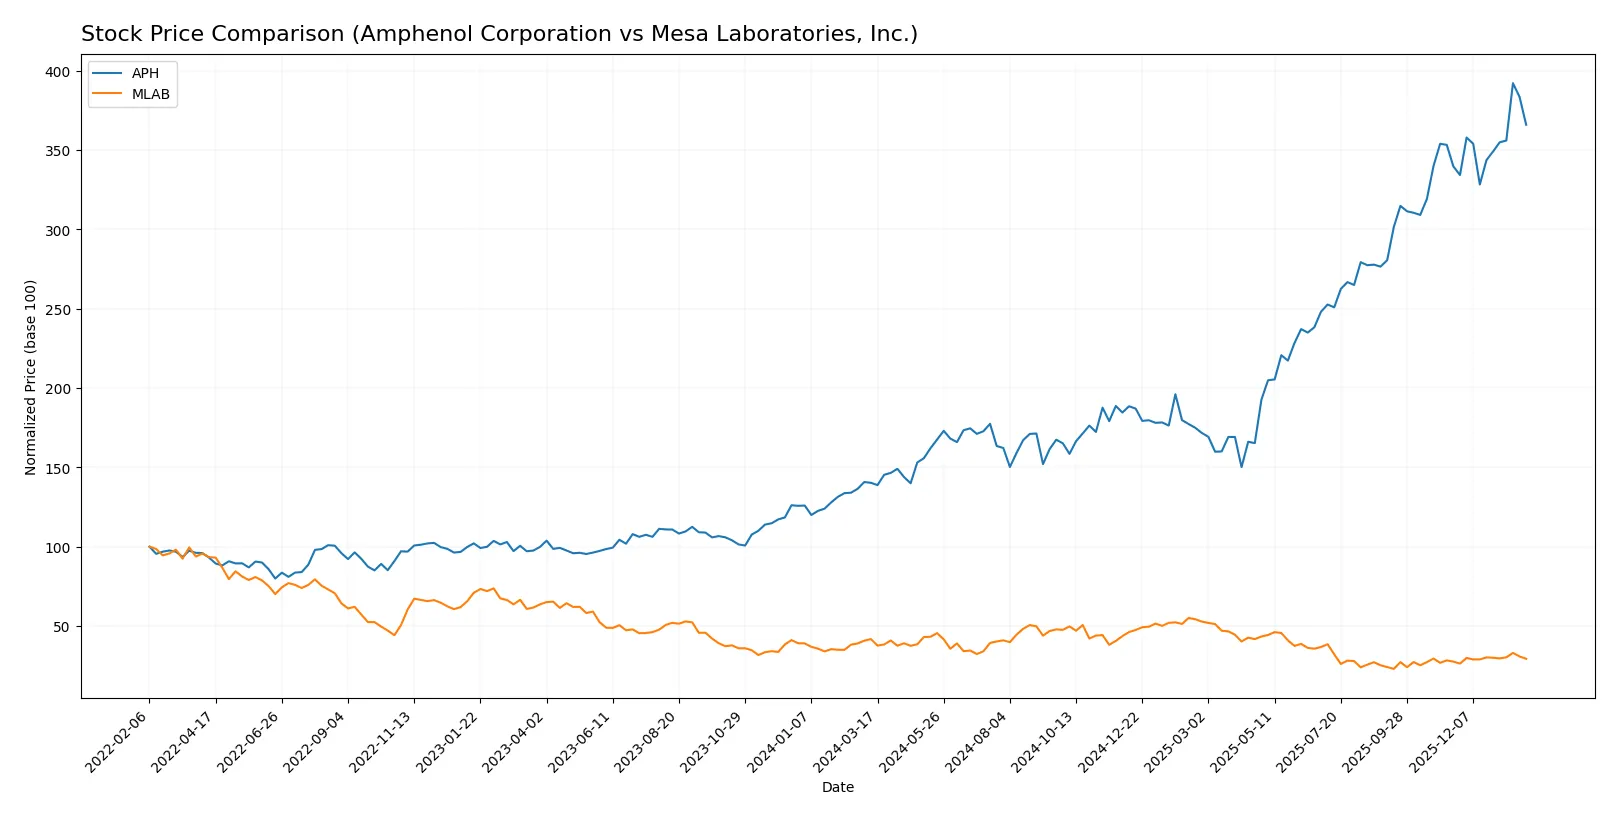
Trend Comparison
Amphenol’s stock price surged 161% over 12 months, indicating a clear bullish trend with accelerating momentum and a high volatility level of 28.51. The highest price reached 154.39, well above the 54.65 low.
Mesa Laboratories’ share price declined nearly 30% over the same period, marking a bearish trend despite acceleration. Its volatility stands at 23.47, with prices ranging between 61.66 and 147.79.
Comparing both, Amphenol outperformed Mesa Laboratories significantly, delivering the highest market returns with sustained upward acceleration and stronger price appreciation.
Target Prices
Analysts show a moderately bullish consensus for Amphenol Corporation and a firm target for Mesa Laboratories.
| Company | Target Low | Target High | Consensus |
|---|---|---|---|
| Amphenol Corporation | 139 | 210 | 174.13 |
| Mesa Laboratories, Inc. | 83 | 83 | 83 |
Amphenol’s consensus target of 174.13 exceeds its current price of 144.08, signaling upside potential. Mesa Laboratories trades near its target at 78.76 versus a consensus of 83, suggesting modest appreciation.

Don’t Let Luck Decide Your Entry Point
Optimize your entry points with our advanced ProRealTime indicators. You’ll get efficient buy signals with precise price targets for maximum performance. Start outperforming now!
How do institutions grade them?
Amphenol Corporation Grades
The following table summarizes recent institutional grades for Amphenol Corporation:
| Grading Company | Action | New Grade | Date |
|---|---|---|---|
| Citigroup | Maintain | Buy | 2026-01-29 |
| Barclays | Maintain | Overweight | 2026-01-29 |
| JP Morgan | Maintain | Overweight | 2026-01-27 |
| UBS | Maintain | Buy | 2026-01-14 |
| Citigroup | Maintain | Buy | 2026-01-12 |
| Barclays | Upgrade | Overweight | 2026-01-12 |
| Truist Securities | Maintain | Buy | 2025-12-19 |
| Barclays | Maintain | Equal Weight | 2025-11-13 |
| Citigroup | Maintain | Buy | 2025-10-23 |
| Truist Securities | Maintain | Buy | 2025-10-23 |
Mesa Laboratories, Inc. Grades
Below is a summary of institutional grades for Mesa Laboratories, Inc.:
| Grading Company | Action | New Grade | Date |
|---|---|---|---|
| Wells Fargo | Maintain | Equal Weight | 2025-12-15 |
| Wells Fargo | Upgrade | Equal Weight | 2025-08-08 |
| Wells Fargo | Maintain | Underweight | 2025-05-30 |
| Evercore ISI Group | Maintain | Outperform | 2024-10-01 |
| Evercore ISI Group | Maintain | Outperform | 2024-08-06 |
| Evercore ISI Group | Maintain | Outperform | 2024-07-02 |
| Evercore ISI Group | Maintain | Outperform | 2024-04-04 |
| Evercore ISI Group | Upgrade | Outperform | 2024-01-04 |
| Evercore ISI Group | Downgrade | In Line | 2021-01-04 |
| Evercore ISI Group | Downgrade | In Line | 2021-01-03 |
Which company has the best grades?
Amphenol Corporation consistently receives high grades, mostly Buy and Overweight, from multiple top-tier firms. Mesa Laboratories shows mixed ratings, with upgrades to Equal Weight and Outperform but also periods of Underweight and In Line. Amphenol’s stronger consensus grades suggest potentially higher institutional confidence, which may influence investor sentiment more positively.
Risks specific to each company
The following categories identify the critical pressure points and systemic threats facing both firms in the 2026 market environment:
1. Market & Competition
Amphenol Corporation
- Operates globally in diverse tech segments with strong market position.
Mesa Laboratories, Inc.
- Serves niche life sciences and calibration markets with limited scale.
2. Capital Structure & Debt
Amphenol Corporation
- Moderate leverage (D/E 0.74), strong interest coverage (16.23x).
Mesa Laboratories, Inc.
- High leverage (D/E 1.14), weak interest coverage (1.5x) signals financial risk.
3. Stock Volatility
Amphenol Corporation
- Beta 1.21 shows above-market volatility, typical for tech hardware firms.
Mesa Laboratories, Inc.
- Beta 0.89 indicates below-market volatility, reflecting smaller scale and niche focus.
4. Regulatory & Legal
Amphenol Corporation
- Exposure to compliance across multiple sectors and geographies.
Mesa Laboratories, Inc.
- Faces stringent regulations in healthcare and biotech industries.
5. Supply Chain & Operations
Amphenol Corporation
- Complex global supply chain with broad product mix; potential disruptions impactful.
Mesa Laboratories, Inc.
- More specialized supply chain; operational risks tied to biotech manufacturing precision.
6. ESG & Climate Transition
Amphenol Corporation
- Larger footprint demands robust ESG initiatives; risk from evolving standards.
Mesa Laboratories, Inc.
- Smaller scale but biotech focus necessitates compliance with environmental health standards.
7. Geopolitical Exposure
Amphenol Corporation
- Global operations expose it to trade tensions, especially US-China relations.
Mesa Laboratories, Inc.
- Limited international footprint reduces geopolitical risk but limits growth opportunities.
Which company shows a better risk-adjusted profile?
Amphenol’s biggest risk stems from market volatility and geopolitical tensions due to its global scale. Mesa Laboratories faces critical financial distress risks given its high leverage and weak profitability metrics. Amphenol’s robust interest coverage and Altman Z-score place it firmly in the safe zone, unlike Mesa Labs, which lingers in financial distress territory. This contrast highlights Amphenol’s superior risk-adjusted profile, justified by its strong operational cash flow and conservative liquidity ratios.
Final Verdict: Which stock to choose?
Amphenol Corporation (APH) shines with its robust capital efficiency and durable competitive advantage. Its ability to consistently generate returns well above its cost of capital underpins a strong economic moat. However, its high valuation multiples and modest dividend yield require cautious monitoring. APH suits investors aiming for long-term aggressive growth with quality.
Mesa Laboratories, Inc. (MLAB) leverages a niche market with a specialized product lineup, offering a strategic moat in its segment. It maintains a safer valuation compared to APH’s premium, though its financial health and profitability metrics raise red flags. MLAB fits portfolios focused on growth at a reasonable price but tolerates higher risk.
If you prioritize resilient capital allocation and proven profitability, Amphenol outshines Mesa with superior stability and growth momentum. However, if you seek a more speculative play with potential undervaluation, Mesa offers a chance for turnaround investors willing to endure short-term volatility. Both present contrasting profiles aligned with distinct investor appetites.
Disclaimer: Investment carries a risk of loss of initial capital. The past performance is not a reliable indicator of future results. Be sure to understand risks before making an investment decision.
Go Further
I encourage you to read the complete analyses of Amphenol Corporation and Mesa Laboratories, Inc. to enhance your investment decisions: