Home > Comparison > Technology > APH vs KEYS
The strategic rivalry between Amphenol Corporation and Keysight Technologies defines the current trajectory of the Technology sector’s hardware industry. Amphenol operates as a capital-intensive manufacturer of electrical connectors with a broad industrial footprint. Keysight offers high-margin electronic design and test solutions, emphasizing innovation in communications and semiconductor markets. This analysis explores which company’s operational model delivers superior risk-adjusted returns for a diversified portfolio seeking exposure to advanced hardware and equipment.
Table of contents
Companies Overview
Amphenol and Keysight Technologies represent two pivotal players in the hardware and equipment sector, shaping multiple high-tech industries globally.
Amphenol Corporation: Connector and Sensor Powerhouse
Amphenol dominates the electrical and electronic connector market with a diverse portfolio spanning harsh environment solutions and communications. Its revenue primarily stems from selling connectors, cable assemblies, and sensors to automotive, aerospace, and IT sectors. In 2026, Amphenol focuses on expanding its value-add product lines and strengthening its presence in fiber optic and harsh environment connectors.
Keysight Technologies, Inc.: Electronic Design and Test Innovator
Keysight leads in electronic design automation and test solutions, serving communications, aerospace, semiconductor, and automotive industries. It generates revenue through advanced test equipment, software platforms, and design tools. The company’s 2026 strategy prioritizes enhancing its virtual network test platforms and expanding software capabilities to meet evolving digital infrastructure demands.
Strategic Collision: Similarities & Divergences
Both companies excel in the hardware sector but diverge in business models: Amphenol targets physical interconnect and sensor systems, while Keysight focuses on software-driven test and measurement solutions. Their competition plays out across communications and aerospace markets, where integration of hardware and software is critical. Investors will find Amphenol offers a broad industrial footprint, whereas Keysight presents a niche, tech-driven growth profile.
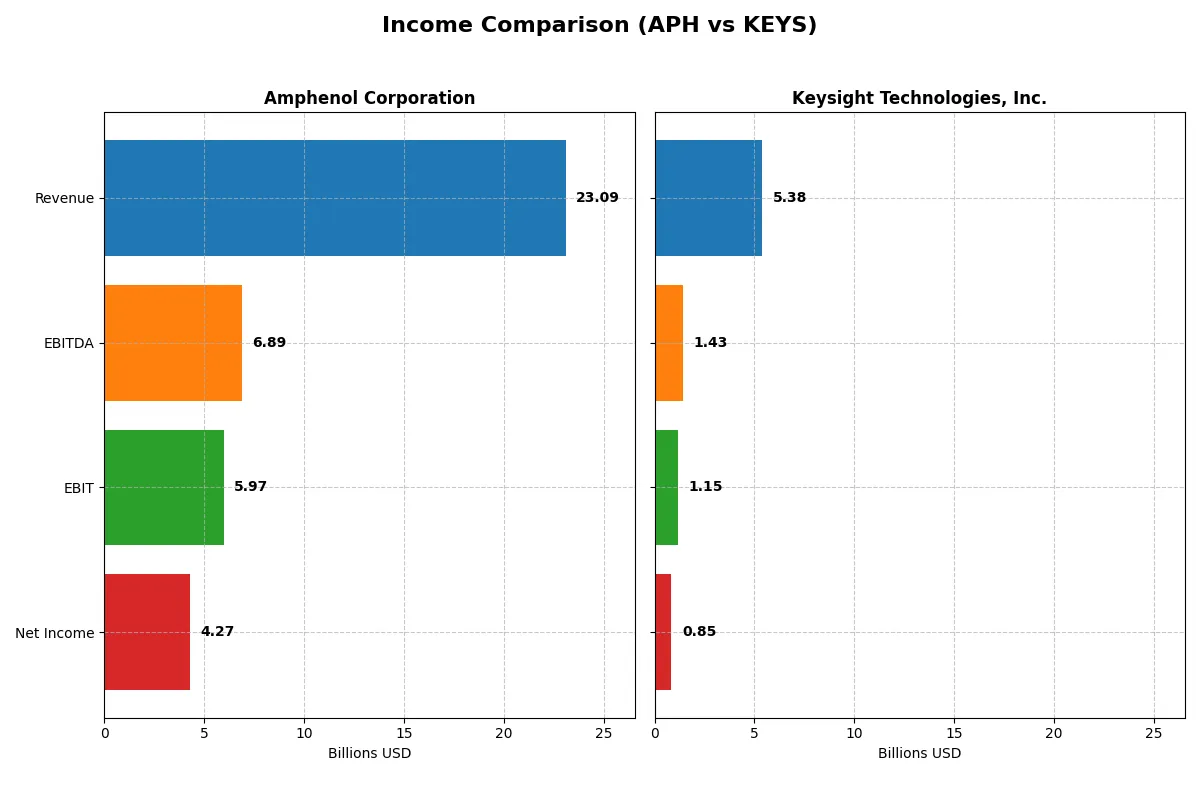
Income Statement Comparison
This data dissects the core profitability and scalability of both corporate engines to reveal who dominates the bottom line:
| Metric | Amphenol Corporation (APH) | Keysight Technologies, Inc. (KEYS) |
|---|---|---|
| Revenue | 23B | 5.4B |
| Cost of Revenue | 14.6B | 2.0B |
| Operating Expenses | 2.5B | 2.4B |
| Gross Profit | 8.5B | 3.3B |
| EBITDA | 6.9B | 1.4B |
| EBIT | 6.0B | 1.2B |
| Interest Expense | 368M | 96M |
| Net Income | 4.3B | 846M |
| EPS | 3.51 | 4.9 |
| Fiscal Year | 2025 | 2025 |
Income Statement Analysis: The Bottom-Line Duel
The following income statement comparison reveals which company operates with superior efficiency and delivers stronger bottom-line results.
Amphenol Corporation Analysis
Amphenol’s revenue surged from $10.9B in 2021 to $23.1B in 2025, doubling over five years. Net income followed suit, climbing from $1.59B to $4.27B. Its gross margin stands at a healthy 36.9%, with a net margin of 18.5%, indicating solid cost control and profitability. In 2025, Amphenol accelerated earnings growth, reflecting operational momentum and efficient capital allocation.
Keysight Technologies, Inc. Analysis
Keysight’s revenue grew modestly from $4.94B in 2021 to $5.38B in 2025, an 8.8% increase over five years. Net income declined slightly over the period, falling to $846M in 2025 from $894M in 2021. However, its gross margin remains robust at 62.1%, with a net margin of 15.7%. Recent years show improving net margin and EPS growth, signaling better profitability despite slower top-line expansion.
Margin Expansion vs. Top-Line Scale
Amphenol dominates with rapid revenue and net income growth, coupled with improving margins, showcasing superior scale and operational leverage. Keysight impresses with a strong gross margin and recent earnings efficiency but lags in revenue growth and absolute profit expansion. For investors prioritizing growth and scale, Amphenol’s profile currently appears more compelling.
Financial Ratios Comparison
These vital ratios act as a diagnostic tool to expose underlying fiscal health, valuation premiums, and capital efficiency for the companies compared below:
| Ratios | Amphenol Corporation (APH) | Keysight Technologies, Inc. (KEYS) |
|---|---|---|
| ROE | 24.8% | 14.4% |
| ROIC | 14.9% | 8.0% |
| P/E | 34.5 | 37.4 |
| P/B | 8.54 | 5.39 |
| Current Ratio | 2.37 | 2.35 |
| Quick Ratio | 1.75 | 1.78 |
| D/E | 0.74 | 0.51 |
| Debt-to-Assets | 33.96% | 26.31% |
| Interest Coverage | 15.1 | 9.88 |
| Asset Turnover | 0.71 | 0.48 |
| Fixed Asset Turnover | 7.26 | 5.21 |
| Payout Ratio | 24.6% | 0% |
| Dividend Yield | 0.71% | 0% |
| Fiscal Year | 2024 | 2025 |
Efficiency & Valuation Duel: The Vital Signs
Ratios act as a company’s DNA, unveiling hidden risks and operational strengths critical for investment decisions.
Amphenol Corporation
Amphenol demonstrates robust profitability with a 24.75% ROE and a solid 15.92% net margin, signaling efficient operations. However, its valuation appears stretched, with a high P/E of 34.49 and P/B of 8.54. The company returns moderate dividends, reflecting a cautious payout amid ongoing reinvestment in growth and R&D.
Keysight Technologies, Inc.
Keysight shows moderate profitability, with a 14.4% ROE and a comparable 15.74% net margin. Its valuation is more demanding, marked by a P/E of 37.41 and P/B of 5.39, indicating an expensive stock. The firm foregoes dividends, prioritizing heavy R&D investment to fuel future growth, consistent with a growth-oriented capital allocation.
Valuation Stretch vs. Operational Efficiency
Amphenol offers stronger profitability and more balanced risk, despite a stretched valuation. Keysight trades at a premium with lower returns but invests aggressively in innovation. Investors seeking operational resilience may prefer Amphenol, while growth-focused profiles may lean toward Keysight’s reinvestment strategy.
Which one offers the Superior Shareholder Reward?
Amphenol (APH) pays a modest 0.71% dividend yield with a 24.5% payout ratio, sustainably covered by free cash flow at 76%. It supplements returns with moderate buybacks. Keysight (KEYS) pays no dividend but reinvests aggressively in growth, supported by a high 90%+ free cash flow conversion. KEYS also executes more substantial share buybacks. I see KEYS’ reinvestment and buyback strategy as more sustainable for long-term value creation. In 2026, KEYS offers a superior total return profile compared to APH’s conservative income and buyback mix.
Comparative Score Analysis: The Strategic Profile
The radar chart reveals the fundamental DNA and trade-offs of Amphenol Corporation and Keysight Technologies, highlighting their financial strengths and risks:
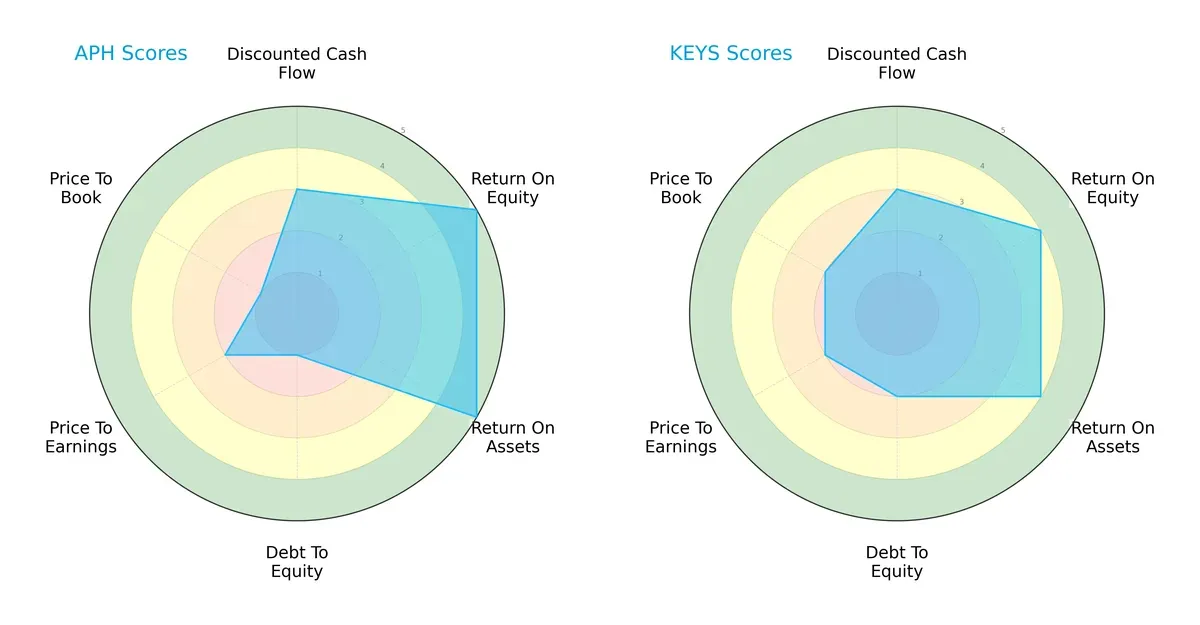
Amphenol leads in profitability metrics, scoring 5 in ROE and ROA, reflecting superior asset efficiency and shareholder returns. However, its debt-to-equity and price-to-book scores (both 1) signal elevated leverage and potential overvaluation risks. Keysight shows a more balanced profile, with moderate scores across all categories, including a stronger debt-to-equity score of 2, indicating better financial stability but slightly lower profitability.
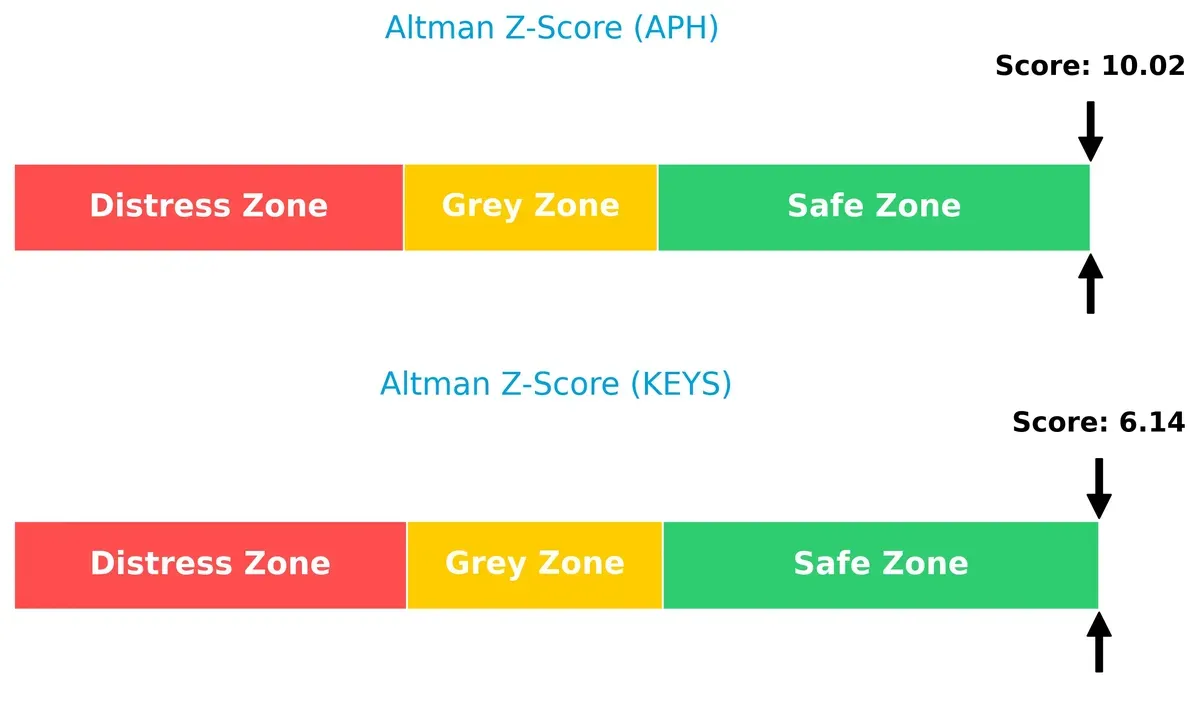
Bankruptcy Risk: Solvency Showdown
Amphenol’s Altman Z-Score of 10.02 far exceeds Keysight’s 6.14, both well within the safe zone, signaling robust solvency and low bankruptcy risk in the current economic cycle:
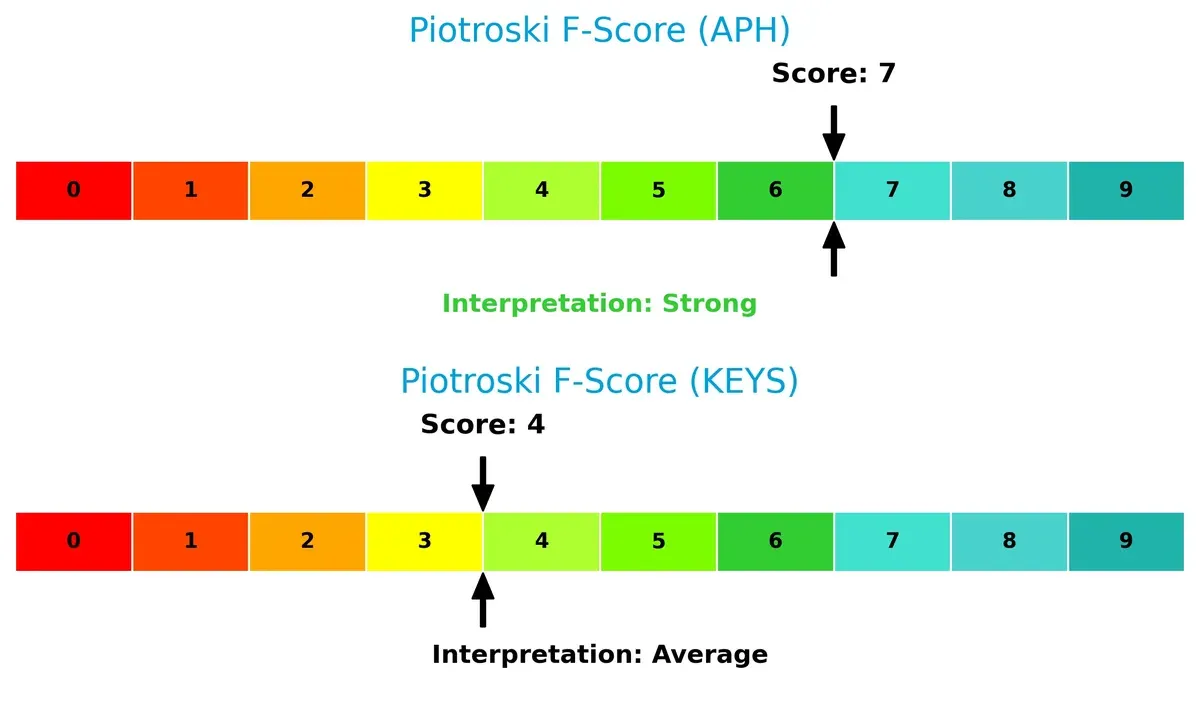
Financial Health: Quality of Operations
Amphenol’s Piotroski F-Score of 7 indicates strong financial health, outperforming Keysight’s average score of 4. This suggests Amphenol is operationally more sound, while Keysight may face some internal efficiency or profitability red flags:
How are the two companies positioned?
This section dissects the operational DNA of Amphenol and Keysight by comparing their revenue distribution and internal strengths and weaknesses. The goal is to confront their economic moats and identify which model offers the most resilient competitive advantage today.
Revenue Segmentation: The Strategic Mix
This visual comparison dissects how Amphenol Corporation and Keysight Technologies diversify their income streams and reveals where each firm’s primary sector bets lie:
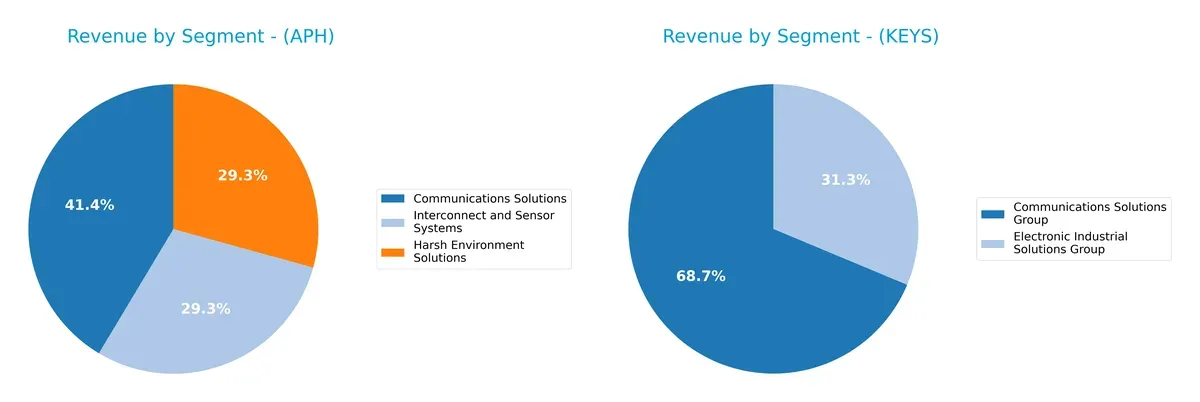
Amphenol’s 2024 revenue splits roughly evenly across Communications Solutions ($6.4B), Harsh Environment ($4.5B), and Interconnect Systems ($4.5B), showcasing a balanced portfolio. In contrast, Keysight leans heavily on Communications Solutions Group ($3.42B) with a smaller Electronic Industrial segment ($1.56B). Amphenol’s diversified mix mitigates concentration risk. Keysight’s reliance anchors it to communications tech cycles but benefits from focused innovation within that ecosystem.
Strengths and Weaknesses Comparison
This table compares the Strengths and Weaknesses of Amphenol Corporation and Keysight Technologies, Inc.:
Amphenol Corporation Strengths
- Diverse product segments with Communications, Harsh Environment, and Interconnect Solutions
- Strong profitability with 15.92% net margin and 24.75% ROE
- Favorable liquidity ratios: current ratio 2.37 and quick ratio 1.75
- High fixed asset turnover at 7.26 indicates efficient use of assets
- Global revenue well spread across China, US, and other foreign locations
Keysight Technologies Strengths
- Solid net margin at 15.74% with favorable current and quick ratios around 2.35 and 1.78
- Favorable debt-to-assets ratio of 26.31% indicates conservative leverage
- Positive interest coverage at 11.98 supports debt servicing capacity
- Geographic diversification across Americas, Asia Pacific, and Europe
- Innovation focus in Communications and Electronic Industrial Solutions segments
Amphenol Corporation Weaknesses
- Elevated valuation multiples with P/E at 34.49 and P/B at 8.54
- Dividend yield low at 0.71%, potentially less attractive for income investors
- Neutral debt-to-equity and asset turnover ratios suggest room for improvement
Keysight Technologies Weaknesses
- Higher P/E at 37.41 and P/B at 5.39 signal expensive valuation
- Lower ROE at 14.4% and ROIC at 8.02% compared to peers
- Asset turnover weak at 0.48, indicating less efficient asset use
- Zero dividend yield reduces appeal for income-focused investors
Both companies demonstrate solid profitability and liquidity with slightly favorable overall financial ratios. Amphenol excels in asset efficiency and product diversification, while Keysight shows strength in leverage management and geographic reach. However, valuation premiums and dividend policies pose considerations for capital allocation strategies.
The Moat Duel: Analyzing Competitive Defensibility
A structural moat is the only true shield protecting long-term profits from relentless competitive erosion. Let’s dissect the moats of two industry leaders:
Amphenol Corporation: Diversified Industrial Network Effects
Amphenol’s moat stems from extensive network effects across harsh environment and communications connectors. This drives stable 26% EBIT margins and 17% ROIC growth. Expansion into fiber optics deepens its competitive edge in 2026.
Keysight Technologies, Inc.: Innovation-Driven Intangible Assets
Keysight’s moat relies on proprietary test and measurement technologies, contrasting Amphenol’s scale. However, declining ROIC and shrinking margins signal weakening defensibility. Emerging markets offer growth but risk disruption persists.
Scale & Innovation: Network Effects vs. Intangible Assets
Amphenol’s wider moat benefits from diversified global scale and rising ROIC, while Keysight suffers from value erosion. Amphenol is better positioned to defend and grow its market share under competitive pressure in 2026.
Which stock offers better returns?
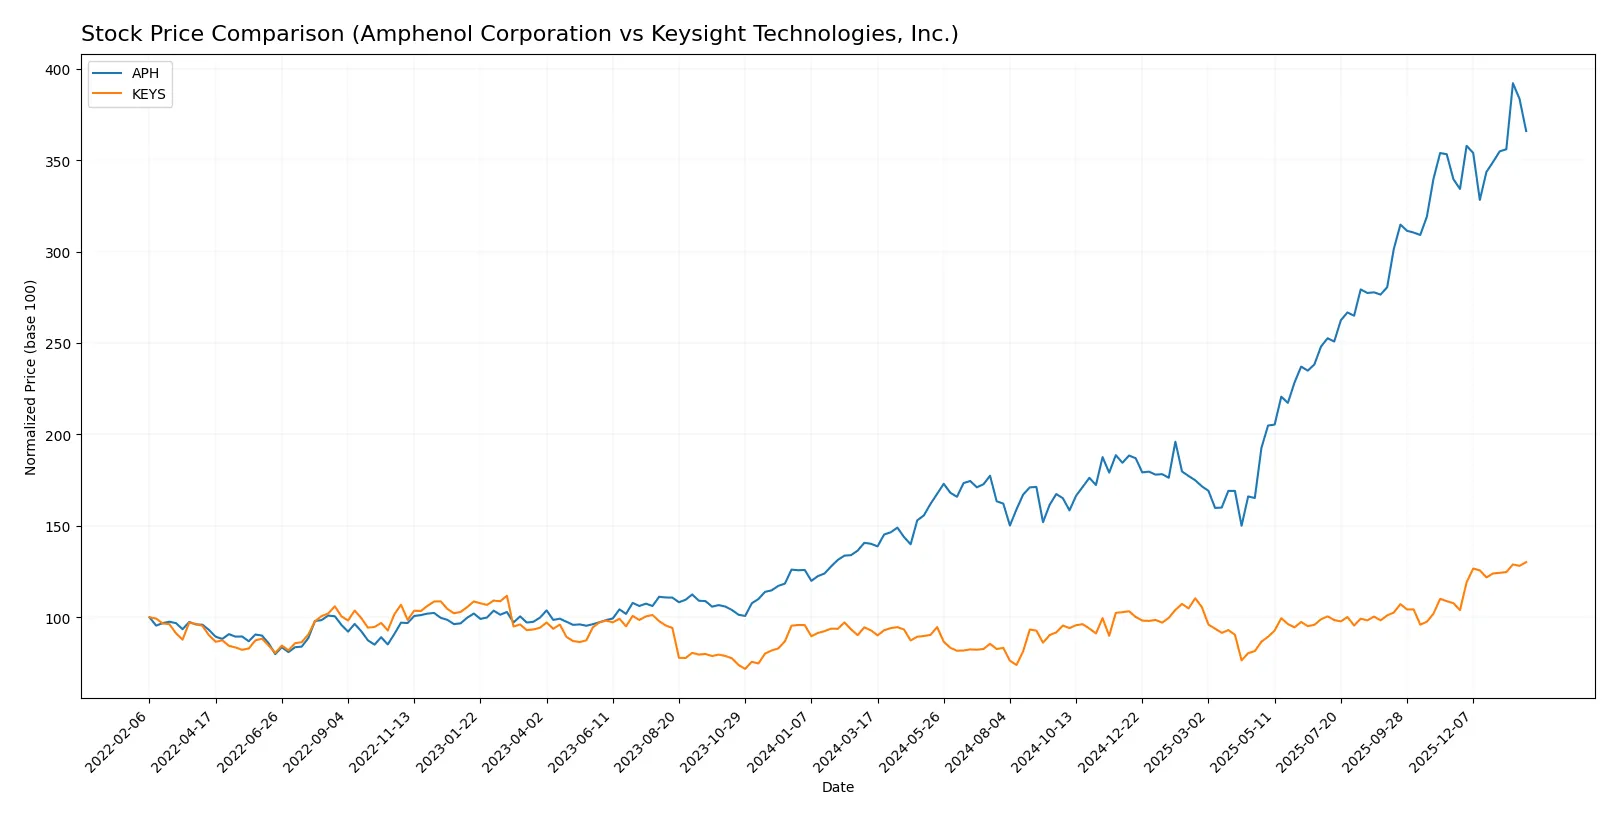
Over the past 12 months, both Amphenol Corporation and Keysight Technologies, Inc. showed strong price appreciations, with Amphenol exhibiting a more pronounced upward trajectory and recent deceleration in buyer dominance.
Trend Comparison
Amphenol’s stock gained 161% over the last year, marking a bullish trend with accelerating momentum and notable volatility, ranging from $54.65 to $154.39.
Keysight’s stock rose 40.2% over the same period, also bullish with acceleration, but lower volatility and a price range between $122.87 and $216.33.
Amphenol outperformed Keysight significantly, delivering the highest market return and stronger acceleration despite recent shifts in buyer-seller volume dynamics.
Target Prices
Analysts present a confident target consensus for both Amphenol Corporation and Keysight Technologies, indicating solid upside potential.
| Company | Target Low | Target High | Consensus |
|---|---|---|---|
| Amphenol Corporation | 139 | 210 | 174.13 |
| Keysight Technologies, Inc. | 210 | 243 | 226.5 |
The consensus target for Amphenol stands about 21% above its current price of 144.08, signaling bullish expectations. Keysight’s target consensus exceeds its current 216.33 price by roughly 5%, reflecting moderate optimism among analysts.

Don’t Let Luck Decide Your Entry Point
Optimize your entry points with our advanced ProRealTime indicators. You’ll get efficient buy signals with precise price targets for maximum performance. Start outperforming now!
How do institutions grade them?
Amphenol Corporation Grades
The table below lists recent grades from reputable financial institutions for Amphenol Corporation.
| Grading Company | Action | New Grade | Date |
|---|---|---|---|
| Citigroup | Maintain | Buy | 2026-01-29 |
| Barclays | Maintain | Overweight | 2026-01-29 |
| JP Morgan | Maintain | Overweight | 2026-01-27 |
| UBS | Maintain | Buy | 2026-01-14 |
| Citigroup | Maintain | Buy | 2026-01-12 |
| Barclays | Upgrade | Overweight | 2026-01-12 |
| Truist Securities | Maintain | Buy | 2025-12-19 |
| Barclays | Maintain | Equal Weight | 2025-11-13 |
| Citigroup | Maintain | Buy | 2025-10-23 |
| Truist Securities | Maintain | Buy | 2025-10-23 |
Keysight Technologies, Inc. Grades
Below are recent institutional grades for Keysight Technologies, Inc. from verified sources.
| Grading Company | Action | New Grade | Date |
|---|---|---|---|
| Morgan Stanley | Maintain | Equal Weight | 2025-12-17 |
| Jefferies | Maintain | Hold | 2025-12-10 |
| Baird | Maintain | Outperform | 2025-11-26 |
| Barclays | Maintain | Overweight | 2025-11-25 |
| Morgan Stanley | Maintain | Equal Weight | 2025-11-25 |
| Wells Fargo | Maintain | Overweight | 2025-11-25 |
| JP Morgan | Maintain | Overweight | 2025-11-25 |
| Susquehanna | Maintain | Positive | 2025-11-25 |
| Citigroup | Maintain | Buy | 2025-11-25 |
| UBS | Maintain | Buy | 2025-11-25 |
Which company has the best grades?
Amphenol Corporation consistently receives “Buy” and “Overweight” ratings from major banks, indicating stronger institutional confidence. Keysight shows a wider range, including “Hold” and “Equal Weight,” reflecting more cautious sentiment. This could influence investors seeking more assured institutional backing.
Risks specific to each company
The following categories identify critical pressure points and systemic threats facing both firms in the 2026 market environment:
1. Market & Competition
Amphenol Corporation
- Operates in broad connector markets with strong diversification but faces pricing pressures from global competitors.
Keysight Technologies, Inc.
- Focuses on electronic design and test solutions in niche segments, exposed to rapid tech shifts and intense innovation races.
2. Capital Structure & Debt
Amphenol Corporation
- Debt-to-equity ratio of 0.74 signals moderate leverage; interest coverage of 16.23x is strong but debt risk remains.
Keysight Technologies, Inc.
- Lower leverage at 0.51 debt-to-equity and 11.98x interest coverage indicate a more conservative capital structure.
3. Stock Volatility
Amphenol Corporation
- Beta of 1.214 shows above-market volatility, partly due to cyclical industry exposure.
Keysight Technologies, Inc.
- Slightly lower beta of 1.179 suggests marginally less volatility but still sensitive to tech sector swings.
4. Regulatory & Legal
Amphenol Corporation
- Global operations expose it to varying trade policies and compliance risks, especially in China and aerospace sectors.
Keysight Technologies, Inc.
- Faces regulatory scrutiny in defense and government contracts, plus export controls impacting international sales.
5. Supply Chain & Operations
Amphenol Corporation
- Complex global supply chains in harsh environment connectors risk disruption amid geopolitical tensions.
Keysight Technologies, Inc.
- Relies on specialized components and manufacturing for test equipment, vulnerable to semiconductor shortages.
6. ESG & Climate Transition
Amphenol Corporation
- Moderate ESG focus with ongoing adaptations in materials and production; climate risks in manufacturing footprint.
Keysight Technologies, Inc.
- Increasing pressure to improve sustainability in energy-intensive testing products and digital solutions.
7. Geopolitical Exposure
Amphenol Corporation
- Significant exposure to U.S.-China trade tensions affecting supply and sales in key markets.
Keysight Technologies, Inc.
- Geopolitical risks linked to defense contracts and global tech supply disruptions.
Which company shows a better risk-adjusted profile?
Amphenol’s biggest risk is its moderate-to-high leverage amid competitive pricing pressures. Keysight faces innovation and geopolitical risks but maintains a stronger balance sheet. Both operate in volatile tech markets, but Keysight’s lower debt and focused niche reduce financial risk. Amphenol’s Altman Z-score of 10.0 vs. Keysight’s 6.1 affirms stronger solvency. However, Keysight’s Piotroski score of 4 vs. Amphenol’s 7 highlights weaker operational efficiency. Overall, Keysight shows a marginally better risk-adjusted profile due to its more conservative capital structure and niche market focus, despite some operational vulnerabilities.
Final Verdict: Which stock to choose?
Amphenol Corporation’s superpower lies in its durable competitive advantage, demonstrated by a steadily growing return on invested capital well above its cost of capital. This signals strong value creation and operational excellence. A point of vigilance remains its elevated valuation multiples, which could pressure future returns. It suits aggressive growth portfolios willing to pay a premium for consistent profitability and expansion.
Keysight Technologies, Inc. boasts a strategic moat rooted in its high-margin, research-intensive business with a robust recurring revenue base. Compared to Amphenol, Keysight offers a safer balance sheet profile with lower leverage. However, its declining ROIC trend signals caution. It fits well in growth-at-a-reasonable-price (GARP) portfolios seeking a blend of innovation and capital discipline.
If you prioritize sustained value creation and high operational efficiency, Amphenol outshines with its proven ability to generate excess returns despite higher valuation risk. However, if you seek a more conservative growth play with a defensive balance sheet and recurring revenue, Keysight offers better stability, though with concerns over its eroding profitability. Each scenario reflects differing risk tolerances and investment horizons.
Disclaimer: Investment carries a risk of loss of initial capital. The past performance is not a reliable indicator of future results. Be sure to understand risks before making an investment decision.
Go Further
I encourage you to read the complete analyses of Amphenol Corporation and Keysight Technologies, Inc. to enhance your investment decisions: