Home > Comparison > Technology > APH vs JBL
The strategic rivalry between Amphenol Corporation and Jabil Inc. shapes the dynamics within the Technology sector’s Hardware, Equipment & Parts industry. Amphenol operates as a capital-intensive manufacturer of connectors and sensor systems, while Jabil focuses on diversified electronics manufacturing services. This analysis pits Amphenol’s product-centric model against Jabil’s integrated service approach to identify which offers superior risk-adjusted returns for a diversified portfolio in 2026.
Table of contents
Companies Overview
Amphenol Corporation and Jabil Inc. stand as pivotal players in the hardware and equipment manufacturing sector.
Amphenol Corporation: Connector and Sensor Powerhouse
Amphenol dominates as a global leader in electrical and electronic connectors, generating revenue through harsh environment, communication, and sensor solutions. Its 2026 strategy emphasizes expanding high-performance connector systems and value-added products like cable assemblies, tapping diverse markets from automotive to aerospace.
Jabil Inc.: Electronics Manufacturing Services Specialist
Jabil serves as a top-tier provider of electronics manufacturing and design services, driving income via electronics design, production, and testing solutions. In 2026, Jabil focuses on enhancing its integrated manufacturing services, targeting cutting-edge sectors such as 5G, automotive, and healthcare with scalable, customized solutions.
Strategic Collision: Similarities & Divergences
Both firms thrive in the hardware and equipment space, yet Amphenol pursues a product-centric model while Jabil adopts a service-oriented manufacturing approach. Their key battleground lies in complex, high-growth technology markets like automotive and telecommunications. This creates distinct investment profiles: Amphenol offers durable product moats, whereas Jabil presents operational agility and diversified client exposure.
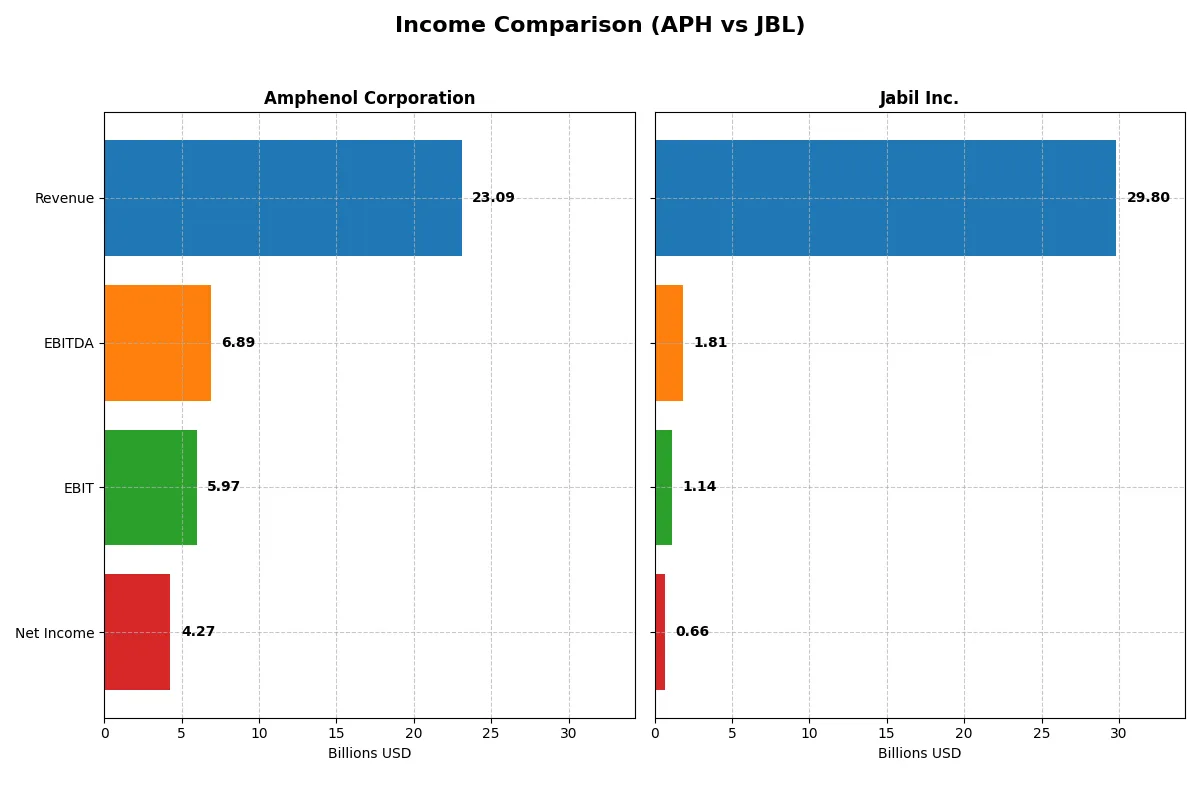
Income Statement Comparison
This data dissects the core profitability and scalability of both corporate engines to reveal who dominates the bottom line:
| Metric | Amphenol Corporation (APH) | Jabil Inc. (JBL) |
|---|---|---|
| Revenue | 23B | 29.8B |
| Cost of Revenue | 14.6B | 27.2B |
| Operating Expenses | 2.55B | 1.46B |
| Gross Profit | 8.5B | 2.65B |
| EBITDA | 6.89B | 1.81B |
| EBIT | 5.97B | 1.14B |
| Interest Expense | 368M | 244M |
| Net Income | 4.27B | 657M |
| EPS | 3.51 | 6 |
| Fiscal Year | 2025 | 2025 |
Income Statement Analysis: The Bottom-Line Duel
This income statement comparison exposes the true operational efficiency and profitability of each company’s business engine through their recent financial performance.
Amphenol Corporation Analysis
Amphenol’s revenue soared from 10.9B in 2021 to 23.1B in 2025, while net income more than doubled to 4.27B. Gross and net margins remain robust at 36.9% and 18.5%, respectively, reflecting strong cost control. The 2025 surge in EBIT by 85% signals accelerating operational efficiency and powerful earnings momentum.
Jabil Inc. Analysis
Jabil’s revenue edged up modestly from 29.3B in 2021 to 29.8B in 2025, but net income declined to 657M, down from 696M. Gross margin is weak at 8.9%, and net margin barely exceeds 2.2%, indicating margin compression. The 2025 plunge in EBIT by 41% reveals deteriorating profitability and operational challenges.
Margin Strength vs. Revenue Scale
Amphenol’s strong margin expansion and rapid net income growth decisively outperform Jabil’s stagnant revenue and shrinking profits. Amphenol demonstrates superior capital efficiency and earnings quality, making it the clearer fundamental winner. Investors seeking consistent profitability should favor Amphenol’s high-margin, growth-oriented profile over Jabil’s low-margin, pressured results.
Financial Ratios Comparison
These vital ratios act as a diagnostic tool to expose the underlying fiscal health, valuation premiums, and capital efficiency of the companies compared below:
| Ratios | Amphenol Corporation (APH) | Jabil Inc. (JBL) |
|---|---|---|
| ROE | 24.8% | 43.4% |
| ROIC | 14.9% | 16.1% |
| P/E | 34.5 | 34.1 |
| P/B | 8.54 | 14.82 |
| Current Ratio | 2.37 | 1.00 |
| Quick Ratio | 1.75 | 0.66 |
| D/E (Debt-to-Equity) | 0.74 | 2.22 |
| Debt-to-Assets | 34.0% | 18.2% |
| Interest Coverage | 15.1 | 4.84 |
| Asset Turnover | 0.71 | 1.61 |
| Fixed Asset Turnover | 7.26 | 9.01 |
| Payout ratio | 24.6% | 5.5% |
| Dividend yield | 0.71% | 0.16% |
| Fiscal Year | 2024 | 2025 |
Efficiency & Valuation Duel: The Vital Signs
Financial ratios act as a company’s DNA, revealing hidden risks and operational excellence critical for investment decisions.
Amphenol Corporation
Amphenol posts a strong ROE of 24.75% and net margin at 15.92%, signaling solid profitability. The stock trades at a stretched P/E of 34.49 and a high P/B of 8.54, indicating premium valuation. Dividend yield is modest at 0.71%, suggesting shareholder returns tilt toward steady income over aggressive buybacks.
Jabil Inc.
Jabil shows an exceptional ROE of 43.42% but suffers from a low net margin of 2.2%, highlighting thin profitability. Its valuation is also stretched with a P/E near 34.14 and a high P/B of 14.82. The dividend yield is minimal at 0.16%, indicating reinvestment likely favors growth or debt management amid weaker liquidity ratios.
Premium Valuation vs. Operational Safety
Amphenol balances favorable profitability and valuation with strong liquidity and moderate leverage, offering a safer risk profile. Jabil, despite its high ROE, carries higher financial risk from low margins and debt levels. Amphenol suits investors seeking stability; Jabil fits those chasing growth with tolerance for volatility.
Which one offers the Superior Shareholder Reward?
I observe Amphenol Corporation (APH) and Jabil Inc. (JBL) pursuing contrasting shareholder reward models. APH offers a steady dividend yield near 0.7–1.05% with a prudent payout ratio around 25%, supported by strong free cash flow coverage above 0.75. APH sustains buybacks, enhancing returns from capital discipline. JBL yields much less, roughly 0.16–0.31%, with a minimal payout ratio below 7%, favoring reinvestment in growth and acquisitions. JBL’s buyback intensity varies but generally adds modest shareholder returns. APH’s dividend plus consistent buybacks offer more sustainable, balanced rewards. JBL’s reinvestment strategy risks earnings volatility amid high leverage (D/E >2). For 2026, I favor APH for superior total return via disciplined distributions and sustainable capital allocation.
Comparative Score Analysis: The Strategic Profile
The radar chart reveals the fundamental DNA and trade-offs of Amphenol Corporation and Jabil Inc., highlighting their financial strengths and vulnerabilities:
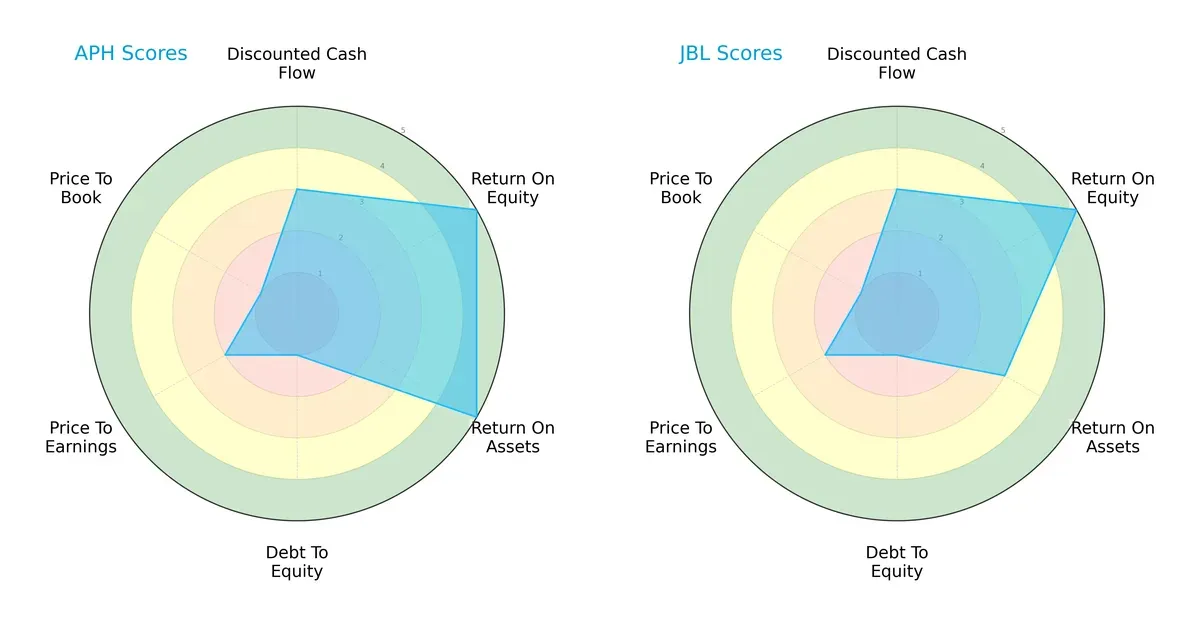
Amphenol scores higher on asset efficiency (ROA 5) and equity returns (ROE 5), showing operational excellence. Jabil matches ROE but lags on ROA (3), indicating less asset productivity. Both have weak debt-to-equity scores (1), signaling high leverage risk. Valuation metrics (P/E and P/B) are moderate to unfavorable for both. Amphenol presents a more balanced profile with superior asset use; Jabil relies on equity returns more than asset efficiency.
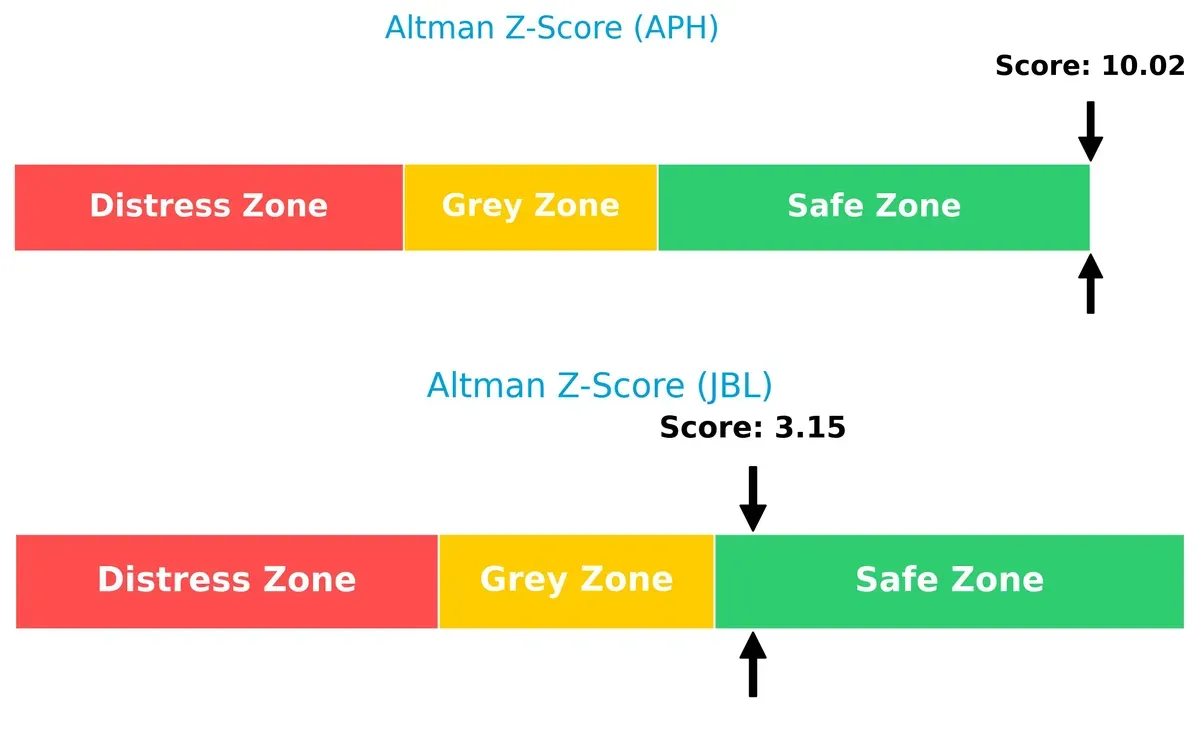
Bankruptcy Risk: Solvency Showdown
Amphenol’s Altman Z-Score (10.0) far exceeds Jabil’s (3.15), placing both safely above distress thresholds but highlighting Amphenol’s stronger financial resilience in this cycle:
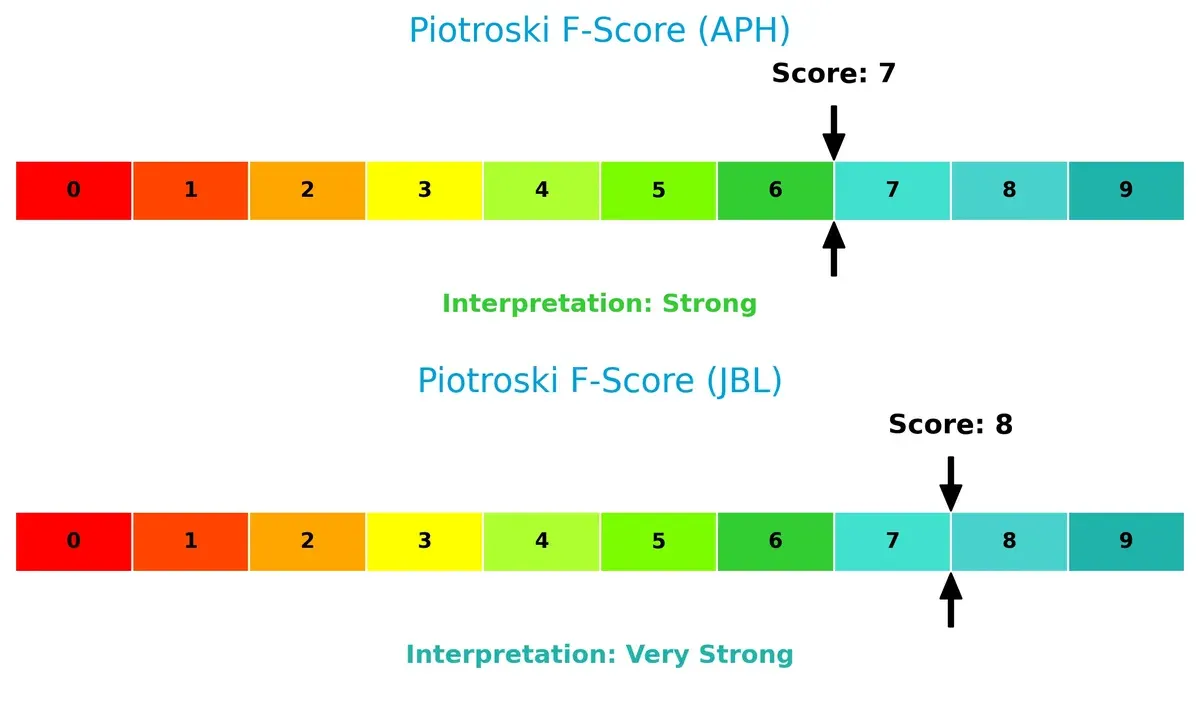
Financial Health: Quality of Operations
Jabil’s Piotroski F-Score (8) slightly outperforms Amphenol’s (7), suggesting superior recent operational improvements and fewer financial red flags in Jabil’s internal metrics:
How are the two companies positioned?
This section dissects Amphenol and Jabil’s operational DNA by comparing revenue distribution and internal strengths and weaknesses. The goal is to confront their economic moats and identify which business model offers the most resilient competitive advantage today.
Revenue Segmentation: The Strategic Mix
This visual comparison dissects how Amphenol Corporation and Jabil Inc. diversify their income streams and where their primary sector bets lie:
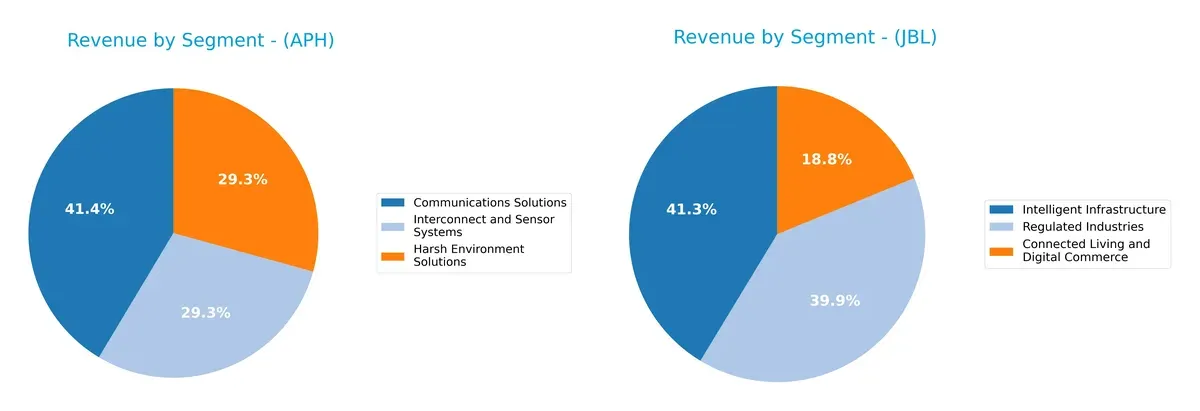
Amphenol pivots on Communications Solutions at $6.38B, Harsh Environment and Interconnect Systems each near $4.5B, showing balanced diversification. Jabil’s latest data reveals a dominant Intelligent Infrastructure segment at $12.3B, alongside Regulated Industries at $11.9B, and Connected Living at $5.6B. Jabil’s reliance on infrastructure signals scale-driven dominance, while Amphenol’s spread reduces concentration risk and fosters ecosystem lock-in.
Strengths and Weaknesses Comparison
This table compares the Strengths and Weaknesses of Amphenol Corporation and Jabil Inc.:
Amphenol Corporation Strengths
- Diverse product segments with strong Communications and Sensor Systems
- Favorable net margin at 15.92% and ROIC at 14.9%
- Solid liquidity with current ratio of 2.37 and quick ratio of 1.75
- Global revenue well spread across U.S., China, and other foreign locations
- Strong asset efficiency with fixed asset turnover at 7.26
Jabil Inc. Strengths
- High ROE at 43.42% and favorable ROIC at 16.06%
- Strong asset turnover at 1.61 and fixed asset turnover at 9.01
- Geographic diversification including U.S., Mexico, China, Singapore, and Malaysia
- Large revenue base in Intelligent Infrastructure and Regulated Industries
- Moderate leverage with favorable debt-to-assets ratio at 18.15%
Amphenol Corporation Weaknesses
- Elevated valuation multiples: PE at 34.49 and PB at 8.54
- Dividend yield low at 0.71%
- Neutral debt levels with D/E at 0.74 and debt-to-assets at 33.96%
- Asset turnover moderate at 0.71
- Slightly unfavorable P/E and P/B ratios may signal overvaluation
Jabil Inc. Weaknesses
- Very low net margin at 2.2% despite high ROE
- High leverage with D/E at 2.22 and unfavorable quick ratio at 0.66
- Low current ratio of 1.0 limits short-term flexibility
- Dividend yield minimal at 0.16%
- Valuation multiples elevated with PE at 34.14 and PB at 14.82
Both companies show geographic and product diversification supporting revenue stability. Amphenol excels in profitability and liquidity, while Jabil leverages high ROE and asset efficiency but faces margin compression and leverage risks. These contrasts shape each company’s strategic priorities around growth, capital structure, and operational efficiency.
The Moat Duel: Analyzing Competitive Defensibility
A structural moat is the only reliable shield protecting long-term profits from relentless competitive pressures. Here’s the moat battle between two industry players:
Amphenol Corporation: Intangible Assets Fueling Margin Stability
Amphenol’s moat stems from specialized connectors and sensor technology with strong intangible assets. This drives a high ROIC above WACC and stable 25.8% EBIT margins. Expansion into harsh environment and communications markets in 2026 should deepen its advantage.
Jabil Inc.: Operational Efficiency Anchored in Scale
Jabil’s moat relies on cost advantage through global manufacturing scale. Compared to Amphenol, it trades higher ROIC growth but suffers from thin 3.8% EBIT margins. Its diverse electronics manufacturing services offer market disruption potential but face margin pressure risks.
Margin Resilience vs. Scale Efficiency: Who Holds the Deeper Moat?
Both companies show durable moats with ROIC exceeding WACC and positive trends. Amphenol’s wider moat manifests in superior margin stability and value-added products. I see Amphenol better equipped to defend market share amid rising competition in 2026.
Which stock offers better returns?
The past year shows stark contrasts in price action and trading volumes for Amphenol Corporation and Jabil Inc., highlighting divergent momentum and market engagement patterns.
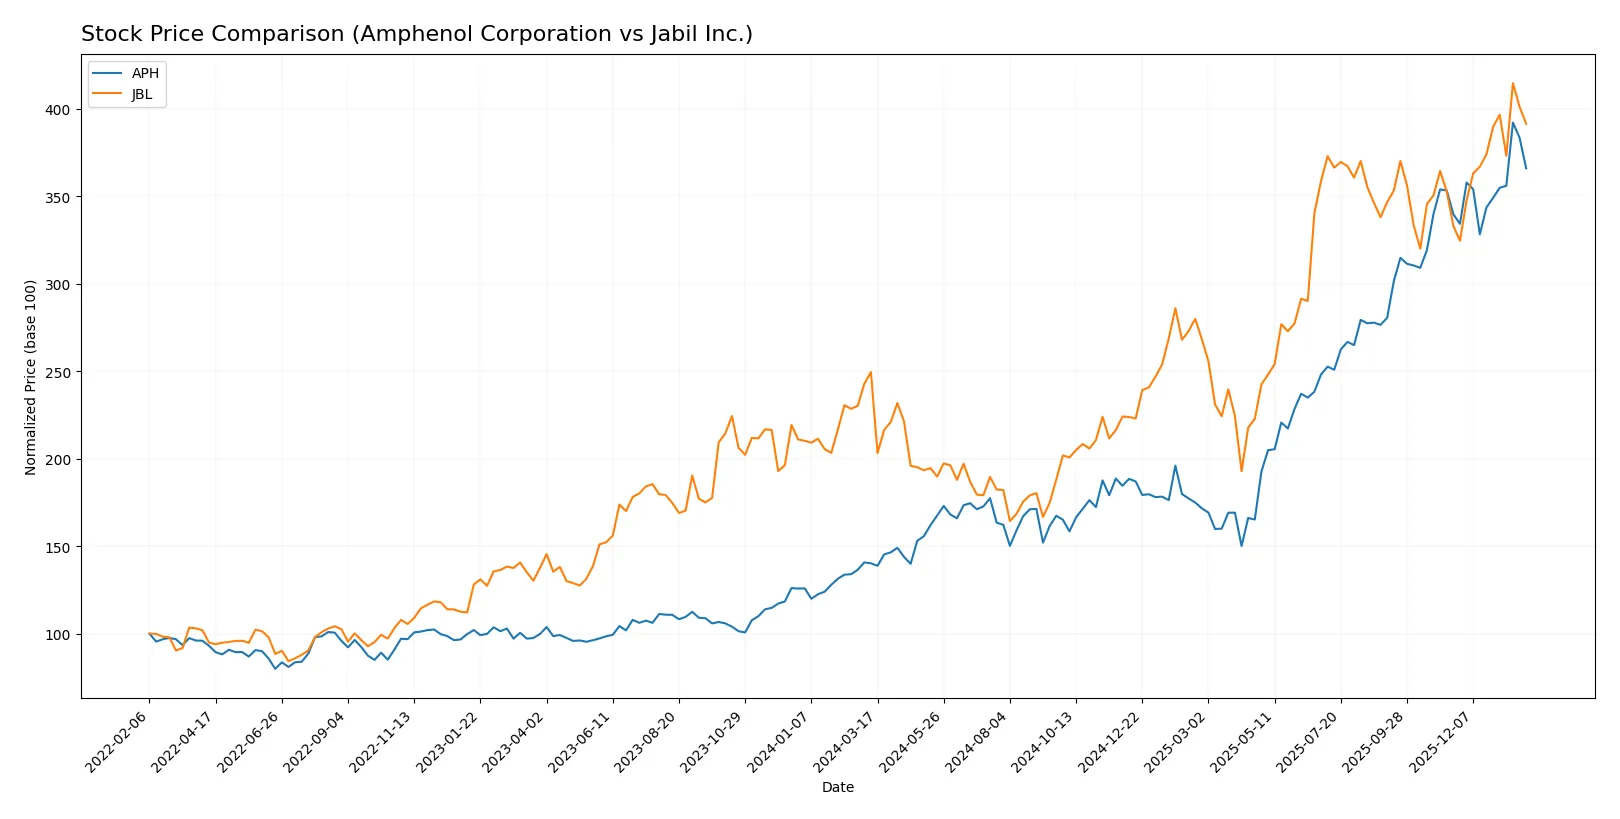
Trend Comparison
Amphenol’s stock gained 161% over the past year, signaling a strong bullish trend with accelerating momentum. The price ranged from 54.65 to 154.39, showing high volatility (28.51 std deviation).
Jabil’s stock rose 57% in the same period, also bullish with acceleration. It experienced wider volatility (44.31 std deviation), hitting a low of 99.62 and a high of 251.29.
Amphenol outperformed Jabil by a wide margin, delivering nearly three times the relative price gain over the year, despite lower volatility and higher trading volumes.
Target Prices
Analysts show clear confidence in both Amphenol Corporation and Jabil Inc., with targets well above current prices.
| Company | Target Low | Target High | Consensus |
|---|---|---|---|
| Amphenol Corporation | 139 | 210 | 174.13 |
| Jabil Inc. | 244 | 283 | 267.25 |
The target consensus for Amphenol is about 21% above its current price of 144.08, signaling moderate upside. Jabil’s consensus sits roughly 13% above its 237.19 share price, indicating solid growth expectations.

Don’t Let Luck Decide Your Entry Point
Optimize your entry points with our advanced ProRealTime indicators. You’ll get efficient buy signals with precise price targets for maximum performance. Start outperforming now!
How do institutions grade them?
Institutional grades for Amphenol Corporation and Jabil Inc. reveal their recent analyst assessments:
Amphenol Corporation Grades
The table below shows recent grades from major financial institutions for Amphenol Corporation.
| Grading Company | Action | New Grade | Date |
|---|---|---|---|
| Citigroup | Maintain | Buy | 2026-01-29 |
| Barclays | Maintain | Overweight | 2026-01-29 |
| JP Morgan | Maintain | Overweight | 2026-01-27 |
| UBS | Maintain | Buy | 2026-01-14 |
| Citigroup | Maintain | Buy | 2026-01-12 |
| Barclays | Upgrade | Overweight | 2026-01-12 |
| Truist Securities | Maintain | Buy | 2025-12-19 |
| Barclays | Maintain | Equal Weight | 2025-11-13 |
| Citigroup | Maintain | Buy | 2025-10-23 |
| Truist Securities | Maintain | Buy | 2025-10-23 |
Jabil Inc. Grades
The table below displays recent grades from recognized financial institutions for Jabil Inc.
| Grading Company | Action | New Grade | Date |
|---|---|---|---|
| UBS | Maintain | Neutral | 2025-12-18 |
| Barclays | Maintain | Overweight | 2025-12-18 |
| JP Morgan | Maintain | Overweight | 2025-12-18 |
| B of A Securities | Maintain | Buy | 2025-12-10 |
| B of A Securities | Maintain | Buy | 2025-09-26 |
| Barclays | Maintain | Overweight | 2025-09-26 |
| JP Morgan | Maintain | Overweight | 2025-07-17 |
| B of A Securities | Maintain | Buy | 2025-06-20 |
| UBS | Maintain | Neutral | 2025-06-18 |
| B of A Securities | Maintain | Buy | 2025-06-18 |
Which company has the best grades?
Amphenol Corporation consistently receives Buy and Overweight ratings from top firms, indicating stronger confidence. Jabil Inc. shows a mix of Buy, Overweight, and Neutral grades, reflecting a more cautious outlook. Investors may view Amphenol’s higher grades as a sign of greater institutional endorsement.
Risks specific to each company
The following categories identify critical pressure points and systemic threats facing Amphenol Corporation and Jabil Inc. in the 2026 market environment:
1. Market & Competition
Amphenol Corporation
- Dominates with strong product diversification in connectors and sensors amid stiff sector rivalry.
Jabil Inc.
- Faces intense competition in electronics manufacturing services with pressure on margins and innovation pace.
2. Capital Structure & Debt
Amphenol Corporation
- Maintains moderate debt levels (D/E 0.74), strong interest coverage (16.23x), signaling solid financial stability.
Jabil Inc.
- Exhibits high leverage (D/E 2.22) with weaker interest coverage (4.66x), increasing financial risk under market stress.
3. Stock Volatility
Amphenol Corporation
- Beta at 1.214 indicates moderate market sensitivity, consistent with steady industry peers.
Jabil Inc.
- Slightly higher beta of 1.246 reflects elevated volatility, increasing risk in turbulent markets.
4. Regulatory & Legal
Amphenol Corporation
- Exposure to international trade regulations and compliance in multiple jurisdictions.
Jabil Inc.
- Faces complex regulatory scrutiny due to global manufacturing footprint and product compliance demands.
5. Supply Chain & Operations
Amphenol Corporation
- Benefits from vertical integration and diversified supplier base, reducing operational disruption risk.
Jabil Inc.
- Vulnerable to supply chain bottlenecks and raw material cost fluctuations impacting manufacturing delivery.
6. ESG & Climate Transition
Amphenol Corporation
- Increasing ESG initiatives but must accelerate climate risk adaptation in manufacturing processes.
Jabil Inc.
- Stronger ESG momentum required to meet evolving standards and stakeholder expectations in sustainability.
7. Geopolitical Exposure
Amphenol Corporation
- Significant exposure to US-China trade tensions impacting key markets and supply chains.
Jabil Inc.
- Global manufacturing operations face risks from geopolitical instability and tariff uncertainties.
Which company shows a better risk-adjusted profile?
Amphenol’s most impactful risk lies in geopolitical exposure, notably US-China trade tensions that could disrupt sales and supply. Jabil’s greatest risk is its high financial leverage, which weakens resilience against market shocks. I see Amphenol showing a better risk-adjusted profile due to its stronger balance sheet and liquidity. The recent debt-to-equity contrast (0.74 vs. 2.22) underscores Jabil’s elevated financial vulnerability despite its operational strengths.
Final Verdict: Which stock to choose?
Amphenol Corporation’s superpower lies in its robust and growing economic moat, marked by consistent value creation through efficient capital deployment. Its strong cash flow generation and operational efficiency stand out. The main point of vigilance is its stretched valuation multiples. This stock suits an aggressive growth portfolio seeking durable profitability.
Jabil Inc. offers a strategic moat through its operational agility and asset turnover, supported by a solid return on equity. It carries more financial leverage and a tighter liquidity profile than Amphenol, reflecting a higher risk tolerance. Jabil fits well in a GARP portfolio targeting growth with a balance of reasonable valuation.
If you prioritize durable competitive advantage and stable profitability, Amphenol outshines due to its proven capital efficiency and growth trajectory. However, if you seek higher operational leverage with potential for sharper price appreciation, Jabil offers better growth momentum albeit with elevated risk. Each presents a distinct analytical scenario aligned to specific investor risk and return preferences.
Disclaimer: Investment carries a risk of loss of initial capital. The past performance is not a reliable indicator of future results. Be sure to understand risks before making an investment decision.
Go Further
I encourage you to read the complete analyses of Amphenol Corporation and Jabil Inc. to enhance your investment decisions: