Home > Comparison > Technology > APH vs GRMN
The strategic rivalry between Amphenol Corporation and Garmin Ltd. shapes the Technology sector’s competitive landscape. Amphenol, a capital-intensive manufacturer of electrical connectors, contrasts with Garmin’s diversified portfolio of wireless and GPS devices. This analysis pits Amphenol’s industrial scale against Garmin’s innovation-driven consumer focus. I will determine which company presents a superior risk-adjusted opportunity for portfolio allocation amid evolving industry dynamics.
Table of contents
Companies Overview
Amphenol Corporation and Garmin Ltd. both command significant influence in the hardware and equipment sector, shaping diverse technology landscapes globally.
Amphenol Corporation: Global Connector Specialist
Amphenol dominates as a designer and manufacturer of electronic connectors and interconnect systems worldwide. Its revenue stems from multiple segments including harsh environment solutions and communications. In 2026, Amphenol prioritizes innovation in high-speed fiber optic and sensor technologies to sustain its edge in automotive, aerospace, and data communications markets.
Garmin Ltd.: Wireless Device Innovator
Garmin leads in wireless device development spanning fitness, outdoor, aviation, marine, and automotive segments. Its core income derives from smart wearables, avionics, and navigation systems. The company’s 2026 strategy emphasizes expanding integrated platforms like Garmin Connect and Connect IQ, strengthening ecosystem engagement across global consumer and industrial markets.
Strategic Collision: Similarities & Divergences
Both firms leverage advanced hardware but pursue distinct philosophies: Amphenol focuses on broad industrial interconnectivity while Garmin invests in closed ecosystems of smart devices and software platforms. Their primary battleground lies in embedded technology for transportation and communication sectors. Amphenol appeals to industrial scale with diversified B2B clients; Garmin targets consumer-driven growth with high-margin wearables and avionics.
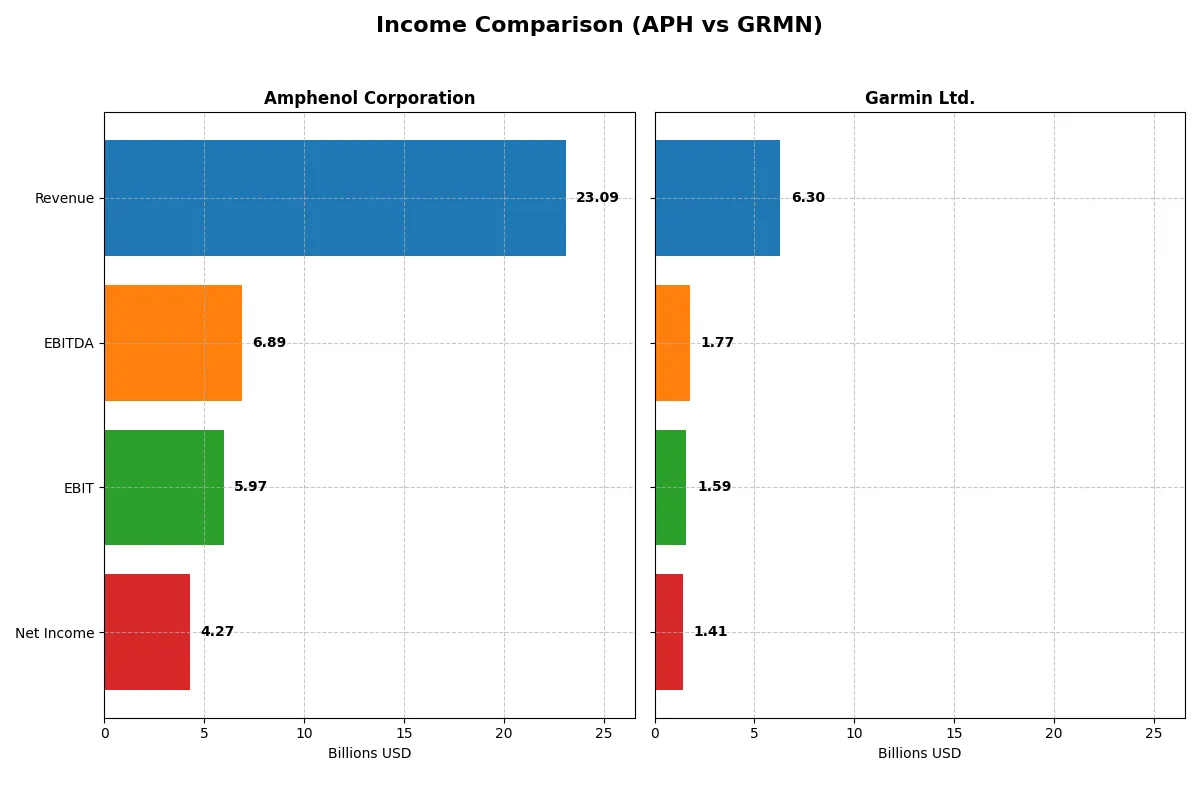
Income Statement Comparison
The following data dissects the core profitability and scalability of both corporate engines to reveal who dominates the bottom line:
| Metric | Amphenol Corporation (APH) | Garmin Ltd. (GRMN) |
|---|---|---|
| Revenue | 23B | 6.3B |
| Cost of Revenue | 14.6B | 2.6B |
| Operating Expenses | 2.5B | 2.1B |
| Gross Profit | 8.5B | 3.7B |
| EBITDA | 6.9B | 1.8B |
| EBIT | 6.0B | 1.6B |
| Interest Expense | 368M | 0 |
| Net Income | 4.3B | 1.4B |
| EPS | 3.51 | 7.35 |
| Fiscal Year | 2025 | 2024 |
Income Statement Analysis: The Bottom-Line Duel
This income statement comparison reveals which company drives superior revenue growth and profitability efficiency over recent years.
Amphenol Corporation Analysis
Amphenol’s revenue soared from $10.9B in 2021 to $23.1B in 2025, doubling its top line. Net income surged 168% to $4.3B, reflecting strong operational leverage. Gross margin held firm near 37%, while net margin expanded to 18.5%. The 2025 results display robust momentum and disciplined cost control, fueling impressive EPS growth of 74% in one year.
Garmin Ltd. Analysis
Garmin’s revenue climbed steadily from $4.2B in 2020 to $6.3B in 2024, a solid 50% increase. Net income rose 42% to $1.4B, though net margin contracted slightly to 22.4%. Gross margin remains a strong 58.7%, signaling efficient production. Despite favorable EBIT growth, recent net margin decline signals pressure on bottom-line efficiency.
Verdict: Revenue Surge vs. Margin Strength
Amphenol dominates with explosive revenue and net income growth, coupled with expanding margins. Garmin shows steadier growth and higher gross margins but faces margin compression risks. Investors seeking rapid scale and margin expansion may prefer Amphenol’s profile, while Garmin appeals to those valuing stable profitability with strong cost management.
Financial Ratios Comparison
These vital ratios act as a diagnostic tool to expose the underlying fiscal health, valuation premiums, and capital efficiency of the companies compared below:
| Ratios | Amphenol Corporation (APH) | Garmin Ltd. (GRMN) |
|---|---|---|
| ROE | 24.8% | 18.0% |
| ROIC | 14.9% | 16.3% |
| P/E | 34.5 | 28.5 |
| P/B | 8.54 | 5.13 |
| Current Ratio | 2.37 | 3.54 |
| Quick Ratio | 1.75 | 2.56 |
| D/E | 0.74 | 0.02 |
| Debt-to-Assets | 34.0% | 1.7% |
| Interest Coverage | 15.1 | 0 |
| Asset Turnover | 0.71 | 0.65 |
| Fixed Asset Turnover | 7.26 | 4.49 |
| Payout Ratio | 24.6% | 40.6% |
| Dividend Yield | 0.71% | 1.42% |
| Fiscal Year | 2024 | 2024 |
Efficiency & Valuation Duel: The Vital Signs
Financial ratios serve as a company’s DNA, exposing hidden risks and highlighting operational strengths crucial for investment decisions.
Amphenol Corporation
Amphenol posts a robust 24.75% ROE and solid 15.92% net margin, indicating strong profitability. Its valuation appears stretched, with a high P/E of 34.49 and P/B of 8.54. Dividend yield is low at 0.71%, suggesting a focus on reinvestment in R&D and growth initiatives, enhancing long-term value.
Garmin Ltd.
Garmin delivers a healthy 17.98% ROE and superior 22.41% net margin, reflecting operational efficiency. Its P/E of 28.5 and P/B of 5.13 signal a relatively expensive stock, though less stretched than Amphenol. Garmin balances shareholder returns with a 1.42% dividend yield and solid cash flow, supporting steady capital allocation.
Valuation Stretch vs. Operational Strength
Garmin offers a more favorable ratio profile with higher margin and stronger balance sheet safety, despite a lower ROE than Amphenol. Amphenol’s premium valuation and reinvestment focus suit growth-oriented investors. Garmin’s blend of dividend and cash flow appeals to those seeking operational resilience.
Which one offers the Superior Shareholder Reward?
I compare Amphenol Corporation (APH) and Garmin Ltd. (GRMN) by their dividend yields, payout ratios, and buyback intensity. APH yields 0.71%, with a 24.5% payout ratio and moderate buybacks, covering dividends 2.23x with FCF. GRMN offers 2.27% yield, a 40.5% payout, and robust buybacks, but lower dividend coverage at 1.87x. Garmin’s higher yield and aggressive buybacks promise stronger total returns, yet APH’s conservative payout ensures sustainability. For 2026, I favor Garmin for superior shareholder reward, balancing growth and income with active capital return.
Comparative Score Analysis: The Strategic Profile
The radar chart reveals the fundamental DNA and trade-offs of Amphenol Corporation and Garmin Ltd., highlighting their distinct financial strengths and risks:
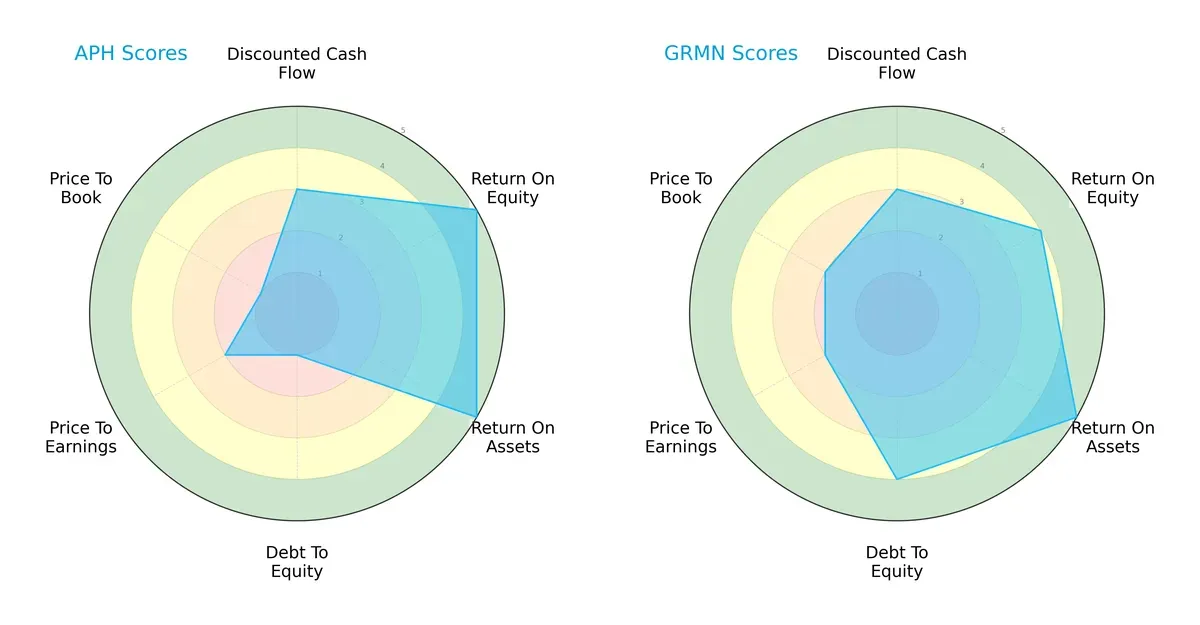
Amphenol excels in return on equity (5) and return on assets (5), signaling strong operational efficiency. However, its debt-to-equity (1) and price-to-book (1) scores raise red flags about leverage and valuation risk. Garmin shows a more balanced profile, with solid debt management (4) and moderately strong valuation scores, but slightly lower return on equity (4). Garmin’s overall score (4) edges out Amphenol’s (3), reflecting steadier financial footing.
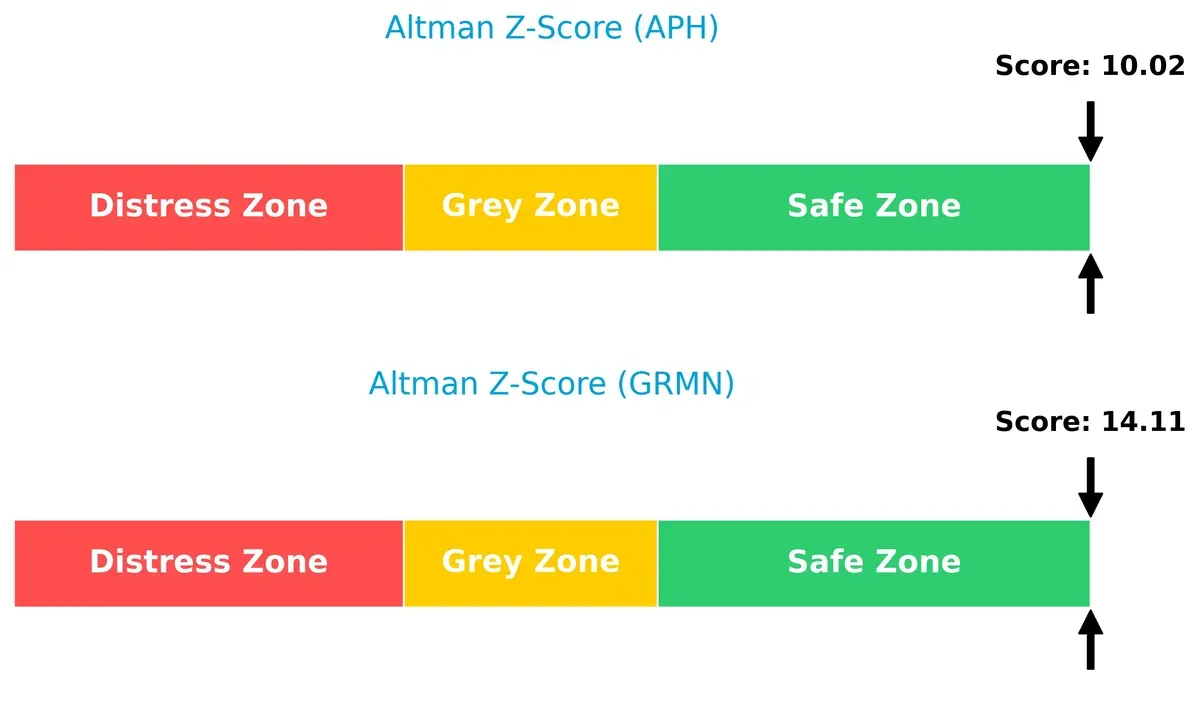
Bankruptcy Risk: Solvency Showdown
The Altman Z-Scores clearly place both firms in the safe zone, with Garmin scoring 14.1 and Amphenol at 10.0, indicating robust solvency and low bankruptcy risk in this cycle:
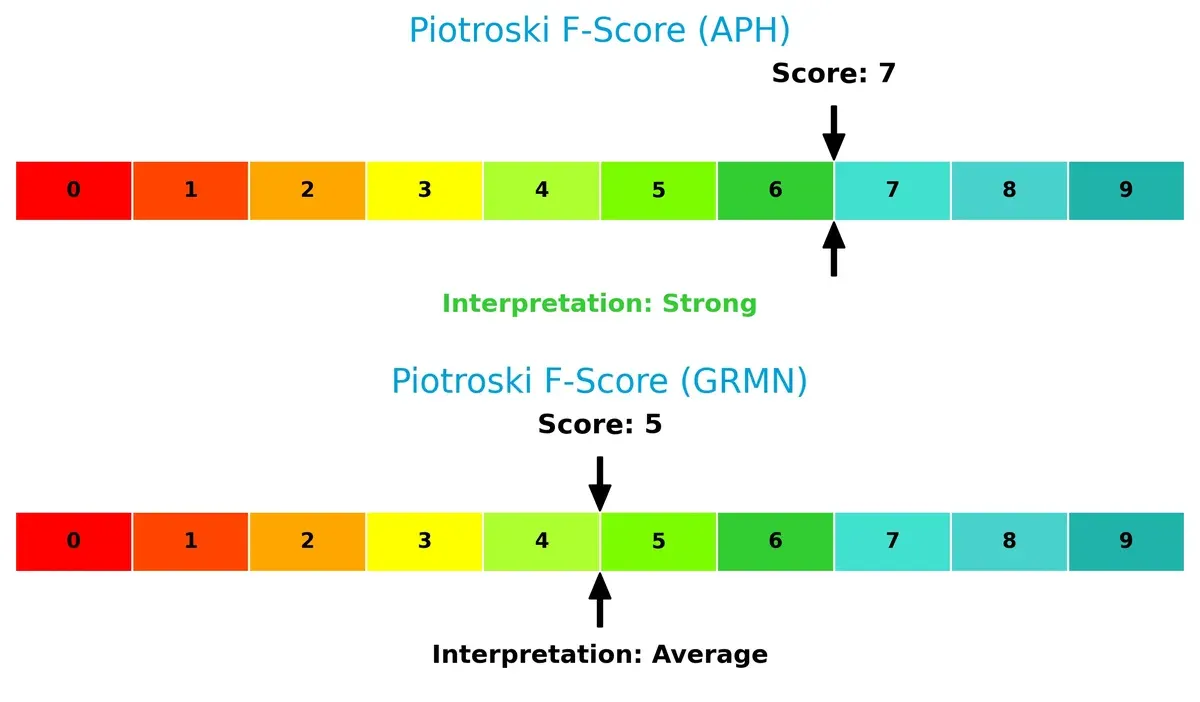
Financial Health: Quality of Operations
Amphenol’s Piotroski F-Score of 7 suggests strong financial health and operational quality. Garmin’s score of 5 is average, signaling some internal metric weaknesses compared to Amphenol:
How are the two companies positioned?
This section dissects the operational DNA of Amphenol and Garmin by comparing their revenue distribution and internal strengths and weaknesses. The final objective is to confront their economic moats to identify which model offers the most resilient and sustainable competitive advantage today.
Revenue Segmentation: The Strategic Mix
This visual comparison dissects how Amphenol Corporation and Garmin Ltd. diversify income streams and reveals their primary sector bets:
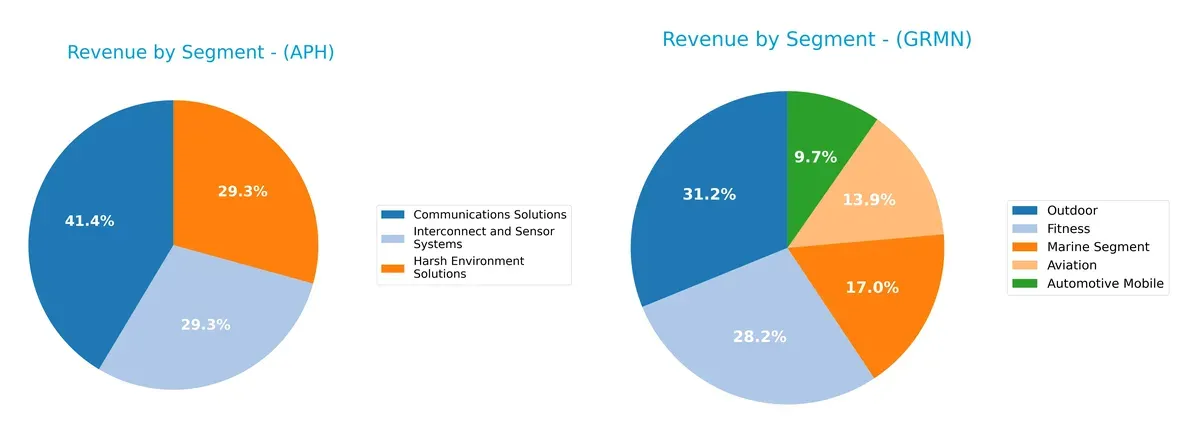
Amphenol anchors revenue in three nearly balanced segments: Communications Solutions at $6.38B, Harsh Environment Solutions at $4.51B, and Interconnect and Sensor Systems at $4.51B. Garmin shows a more diversified consumer focus, with Outdoor at $1.96B and Fitness at $1.77B leading, but no single segment dwarfs others. Amphenol’s mix signals industrial ecosystem lock-in, while Garmin pivots on lifestyle tech diversity, balancing sector-specific risks.
Strengths and Weaknesses Comparison
This table compares the Strengths and Weaknesses of Amphenol Corporation and Garmin Ltd.:
Amphenol Corporation Strengths
- Diversified revenue streams across communications, harsh environments, and sensor systems
- Favorable profitability with 15.92% net margin and 24.75% ROE
- Strong liquidity ratios: current 2.37 and quick 1.75
- Global revenue balanced across US, China, and other foreign locations
- High fixed asset turnover at 7.26 indicating efficient asset use
Garmin Ltd. Strengths
- Higher net margin at 22.41% and favorable ROIC of 16.28%
- Very low debt levels with 0.02 debt-to-equity and 1.69% debt-to-assets
- Favorable interest coverage and quick ratio indicating solid financial health
- Diversified product range including automotive, aviation, fitness, marine, and outdoor
- Geographic presence strong in Americas, EMEA, and Asia Pacific
Amphenol Corporation Weaknesses
- High valuation multiples: PE 34.49 and PB 8.54 suggest premium pricing
- Moderate debt level at 0.74 debt-to-equity ratio
- Dividend yield low at 0.71% might limit income appeal
- Neutral asset turnover at 0.71 may indicate room for operational improvement
- Moderate reliance on foreign markets exposes to geopolitical risks
Garmin Ltd. Weaknesses
- Unfavorable current ratio at 3.54 indicating potential short-term liquidity concerns
- PE of 28.5 and PB of 5.13 remain elevated
- Dividend yield neutral at 1.42% limits income attractiveness
- Fixed asset turnover lower at 4.49 compared to peer
- Concentrated revenue in fitness and outdoor segments may increase business cyclicality
Both companies demonstrate robust profitability and diversified business models but face valuation and operational efficiency challenges. Amphenol’s global footprint contrasts with Garmin’s focused geographic and product segmentation, influencing strategic priorities.
The Moat Duel: Analyzing Competitive Defensibility
A structural moat is the only barrier protecting long-term profits from relentless competitive erosion. Let’s dissect how these two firms defend their turf:
Amphenol Corporation: Diversified Industrial Connector Moat
Amphenol’s moat stems from its cost advantage and broad product portfolio across harsh environments and communication sectors. It shows a very favorable ROIC 6% above WACC and growing, signaling durable value creation. Expanding into new sensor markets in 2026 should deepen this moat.
Garmin Ltd.: Specialized Consumer & Aviation Tech Moat
Garmin’s moat relies on intangible assets and brand loyalty in fitness and avionics devices, yielding a stable ROIC over WACC by 7.7%. Unlike Amphenol, Garmin’s ROIC trend is flat, reflecting steady but less dynamic competitive positioning. New software platforms may boost growth.
Industrial Breadth vs. Niche Specialization
Amphenol holds a wider and more durable moat with growing profitability, fueled by scale and cost efficiency. Garmin’s moat is narrower but robust, reliant on brand and innovation in niche markets. Amphenol is better positioned to defend and expand market share long term.
Which stock offers better returns?
The past year reveals strong bullish momentum for both Amphenol Corporation and Garmin Ltd., with notable price acceleration and significant gains shaping their trading dynamics.
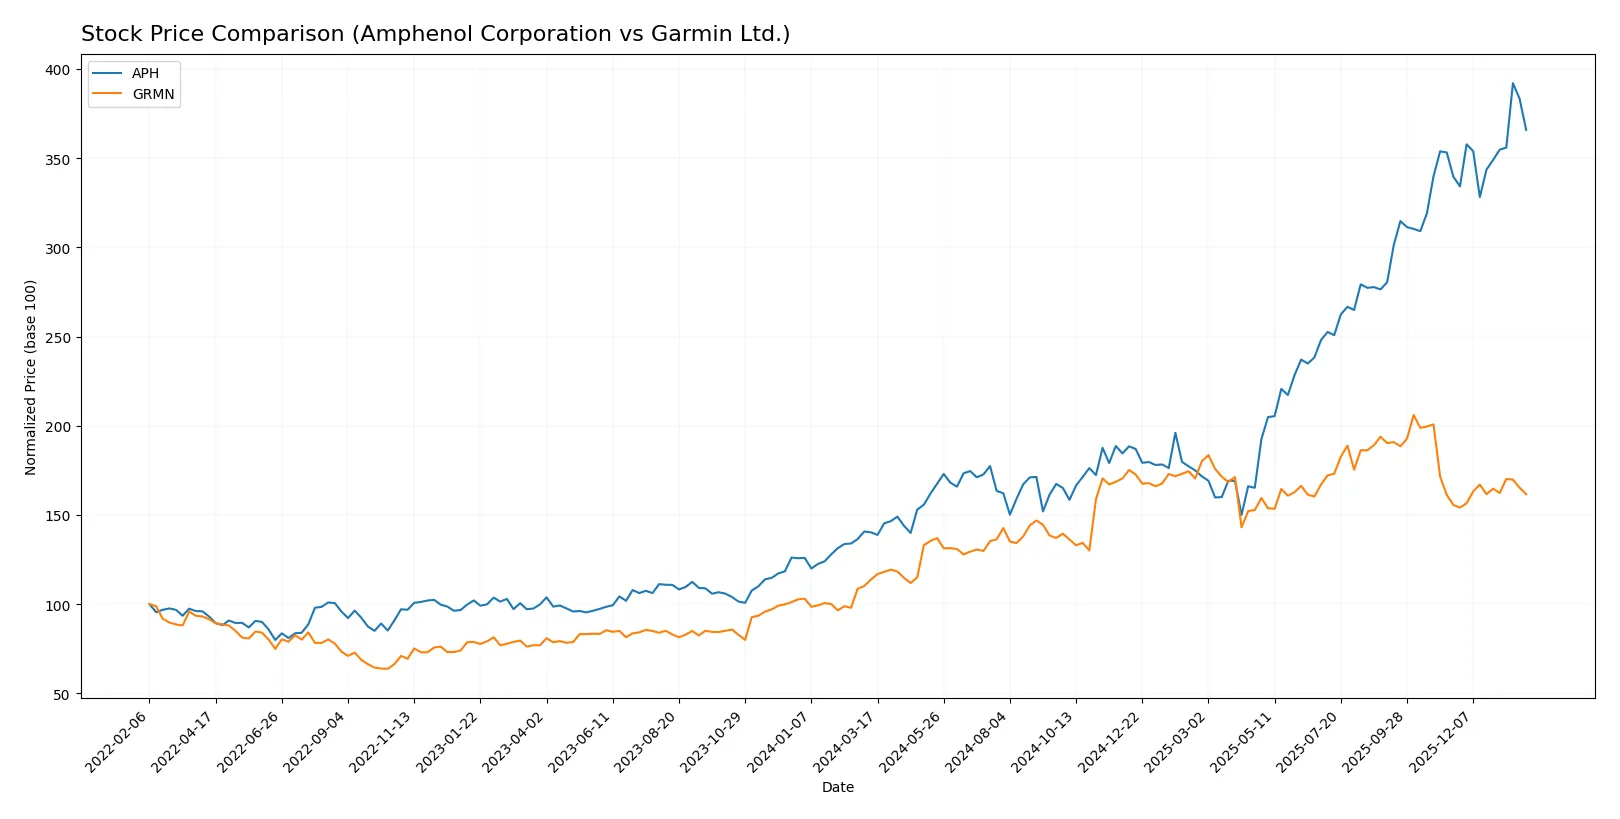
Trend Comparison
Amphenol Corporation’s stock surged 161% over the past 12 months, showing clear acceleration and hitting a high of 154.39. The trend remains strongly bullish despite recent slight seller dominance.
Garmin Ltd. gained 42% in the same period, also accelerating with a peak price of 257.06. The stock maintains a bullish trend but with lower recent buyer dominance compared to Amphenol.
Amphenol’s superior 161% gain outpaces Garmin’s 42%, making it the stronger performer over the past year based on price appreciation and trend acceleration.
Target Prices
Analyst consensus points to solid upside potential for Amphenol Corporation and Garmin Ltd.
| Company | Target Low | Target High | Consensus |
|---|---|---|---|
| Amphenol Corporation | 139 | 210 | 174.13 |
| Garmin Ltd. | 193 | 310 | 240 |
Amphenol’s consensus target is 21% above its current 144.08 price, signaling moderate growth expectations. Garmin’s target consensus of 240 suggests a 19% upside from 201.64, reflecting confidence in its diversified product segments.

Don’t Let Luck Decide Your Entry Point
Optimize your entry points with our advanced ProRealTime indicators. You’ll get efficient buy signals with precise price targets for maximum performance. Start outperforming now!
How do institutions grade them?
Amphenol Corporation Grades
Here are the recent institutional grades for Amphenol Corporation from major financial firms:
| Grading Company | Action | New Grade | Date |
|---|---|---|---|
| Citigroup | Maintain | Buy | 2026-01-29 |
| Barclays | Maintain | Overweight | 2026-01-29 |
| JP Morgan | Maintain | Overweight | 2026-01-27 |
| UBS | Maintain | Buy | 2026-01-14 |
| Citigroup | Maintain | Buy | 2026-01-12 |
| Barclays | Upgrade | Overweight | 2026-01-12 |
| Truist Securities | Maintain | Buy | 2025-12-19 |
| Barclays | Maintain | Equal Weight | 2025-11-13 |
| Citigroup | Maintain | Buy | 2025-10-23 |
| Truist Securities | Maintain | Buy | 2025-10-23 |
Garmin Ltd. Grades
These are the latest institutional grades available for Garmin Ltd.:
| Grading Company | Action | New Grade | Date |
|---|---|---|---|
| Barclays | Upgrade | Equal Weight | 2026-01-16 |
| Tigress Financial | Maintain | Strong Buy | 2025-12-19 |
| Longbow Research | Upgrade | Buy | 2025-12-03 |
| Morgan Stanley | Maintain | Underweight | 2025-10-30 |
| Barclays | Maintain | Underweight | 2025-10-30 |
| Tigress Financial | Maintain | Strong Buy | 2025-09-30 |
| Morgan Stanley | Maintain | Underweight | 2025-09-19 |
| Morgan Stanley | Maintain | Underweight | 2025-07-31 |
| Barclays | Maintain | Underweight | 2025-07-31 |
| JP Morgan | Maintain | Neutral | 2025-07-17 |
Which company has the best grades?
Amphenol has consistently stronger grades, predominantly Buy and Overweight, from several top-tier firms. Garmin’s ratings are mixed, with Strong Buy from Tigress but multiple Underweight grades from Morgan Stanley and Barclays. This divergence may affect investor confidence and portfolio positioning differently.
Risks specific to each company
The following categories identify the critical pressure points and systemic threats facing both firms in the 2026 market environment:
1. Market & Competition
Amphenol Corporation
- Faces intense competition in connectors and sensors across multiple sectors, risking margin pressure.
Garmin Ltd.
- Competes in diverse wireless devices and avionics, with innovation pace critical to retain market share.
2. Capital Structure & Debt
Amphenol Corporation
- Moderate leverage (D/E 0.74) with neutral debt-to-assets; interest coverage strong but debt management needs vigilance.
Garmin Ltd.
- Minimal debt (D/E 0.02), excellent interest coverage, showing robust balance sheet and low financial risk.
3. Stock Volatility
Amphenol Corporation
- Beta 1.21 suggests higher stock volatility relative to market; sensitive to economic cycles and tech sector swings.
Garmin Ltd.
- Beta 1.01 indicates volatility close to market average, providing relatively stable price movements.
4. Regulatory & Legal
Amphenol Corporation
- Exposure to US and China regulatory environments introduces risks from trade policies and compliance costs.
Garmin Ltd.
- Swiss domicile and global sales expose it to multifaceted regulatory frameworks; aviation segment faces strict certifications.
5. Supply Chain & Operations
Amphenol Corporation
- Complex global supply chains for connectors and sensors risk disruption and cost inflation.
Garmin Ltd.
- Diverse product lines and manufacturing require efficient logistics; reliance on component availability is a potential bottleneck.
6. ESG & Climate Transition
Amphenol Corporation
- Pressure to reduce environmental footprint in manufacturing and materials sourcing amidst growing investor scrutiny.
Garmin Ltd.
- Sustainability demands rising, especially in electronics and aviation sectors, requiring proactive climate strategy.
7. Geopolitical Exposure
Amphenol Corporation
- Significant exposure to US-China tensions impacting supply chain and market access.
Garmin Ltd.
- Operates globally with Swiss base, somewhat insulated but still vulnerable to trade and geopolitical shifts.
Which company shows a better risk-adjusted profile?
Amphenol faces market and geopolitical risks amplified by moderate leverage and higher stock volatility. Garmin’s minimal debt and stable beta offer financial resilience but regulatory and supply chain complexities persist. Garmin’s lower financial risk and stable operational footing give it a better risk-adjusted profile in 2026.
Final Verdict: Which stock to choose?
Amphenol Corporation’s superpower lies in its durable value creation, driven by a growing ROIC well above its cost of capital. Its aggressive growth profile is underpinned by robust profitability and efficient capital use. A point of vigilance is its relatively high valuation multiples, which could pressure returns if growth slows.
Garmin Ltd. boasts a strategic moat rooted in stable, recurring cash flows and a pristine balance sheet with minimal debt. It offers better financial safety compared to Amphenol, making it suitable for investors seeking steady growth blended with financial stability—a classic GARP candidate.
If you prioritize aggressive expansion backed by a proven ability to create value above capital costs, Amphenol emerges as the compelling choice. However, if you seek a safer, more stable investment with a strong moat and cleaner leverage profile, Garmin offers better stability and a more balanced risk-return trade-off.
Disclaimer: Investment carries a risk of loss of initial capital. The past performance is not a reliable indicator of future results. Be sure to understand risks before making an investment decision.
Go Further
I encourage you to read the complete analyses of Amphenol Corporation and Garmin Ltd. to enhance your investment decisions: