Home > Comparison > Technology > APH vs FTV
The strategic rivalry between Amphenol Corporation and Fortive Corporation shapes the evolution of the Technology sector’s hardware, equipment, and parts industry. Amphenol operates as a capital-intensive global connector and sensor manufacturer, while Fortive focuses on engineered products and software with a service-oriented model. This analysis pits Amphenol’s scale and manufacturing expertise against Fortive’s diversified, high-value solutions to identify which offers a superior risk-adjusted profile for a balanced portfolio.
Table of contents
Companies Overview
Amphenol Corporation and Fortive Corporation anchor critical niches within the hardware and equipment sector, each bringing distinct strategic strengths.
Amphenol Corporation: Global Connector Powerhouse
Amphenol commands a leading position in electrical and fiber optic connectors, generating revenue from harsh environment, communications, and sensor system segments. Its 2026 strategy emphasizes innovation in high-performance connectors and expanding global manufacturing footprints. The company leverages scale and a broad product portfolio to serve diverse markets like aerospace, automotive, and data communications.
Fortive Corporation: Precision Tech and Software Innovator
Fortive specializes in professional and engineered products, blending hardware with software solutions for reliability tools, calibration, and healthcare technology. Its strategic focus in 2026 targets digital transformation and subscription-based services to boost recurring revenue. Fortive capitalizes on a portfolio of industrial brands to penetrate manufacturing, healthcare, and energy sectors with integrated technology offerings.
Strategic Collision: Similarities & Divergences
Both companies excel in hardware and equipment, yet Amphenol leans on broad connector manufacturing while Fortive integrates software and services for precision tools. Their primary battleground lies in industrial markets demanding reliability and innovation. Amphenol offers a scalable manufacturing moat; Fortive presents a software-driven growth profile—distinct investment narratives for the technology hardware space.
Income Statement Comparison
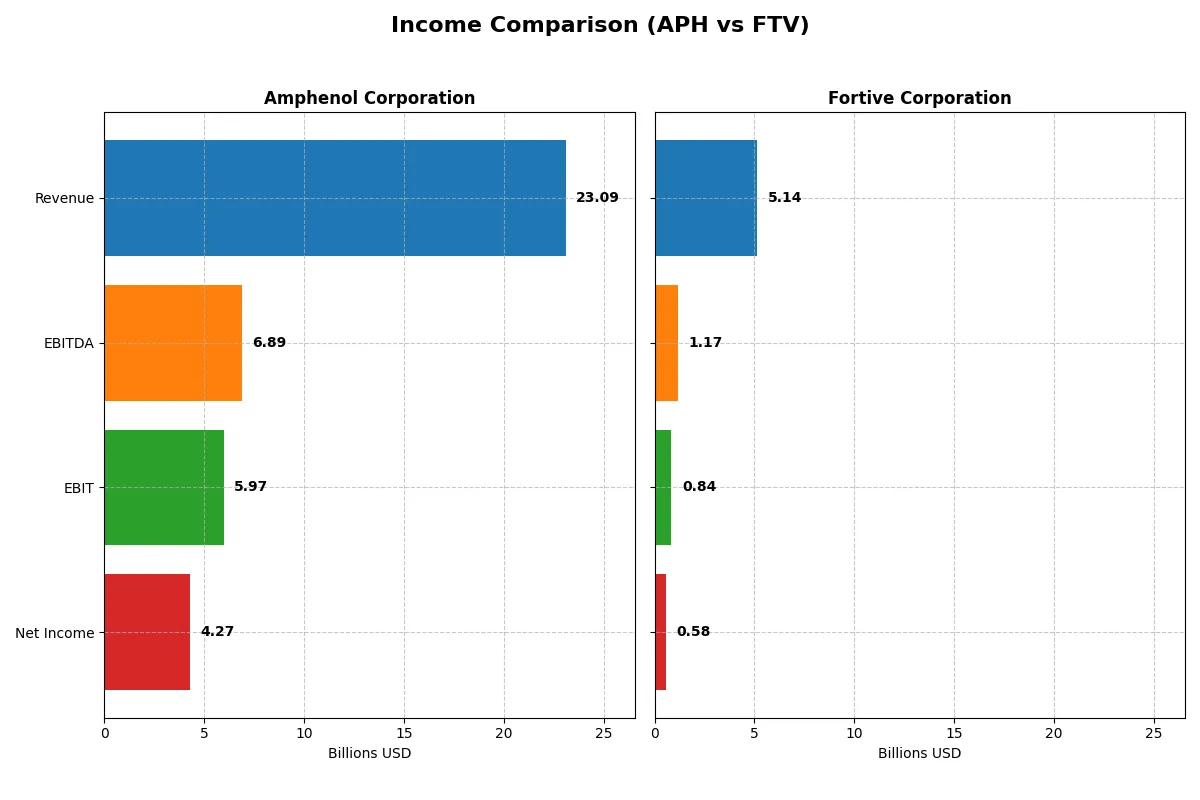
The table below dissects the core profitability and scalability of both corporate engines to reveal who dominates the bottom line:
| Metric | Amphenol Corporation (APH) | Fortive Corporation (FTV) |
|---|---|---|
| Revenue | 23B | 5.1B |
| Cost of Revenue | 15B | 2B |
| Operating Expenses | 2.5B | 2.2B |
| Gross Profit | 8.5B | 3.1B |
| EBITDA | 6.9B | 1.2B |
| EBIT | 6B | 843M |
| Interest Expense | 368M | 121M |
| Net Income | 4.3B | 579M |
| EPS | 3.51 | 1.75 |
| Fiscal Year | 2025 | 2025 |
Income Statement Analysis: The Bottom-Line Duel
This income statement comparison reveals which company operates with greater financial efficiency and growth momentum over recent years.
Amphenol Corporation Analysis
Amphenol demonstrates robust revenue growth, surging from 10.9B in 2021 to 23.1B in 2025. Net income more than doubled, reaching 4.3B in 2025. Gross margin holds steady at 36.9%, with net margin climbing to 18.5%. The company’s operating leverage and expanding margins highlight strong operational efficiency and accelerating momentum in the latest year.
Fortive Corporation Analysis
Fortive’s revenue peaked at 6.2B in 2024 but declined 17.5% to 5.1B in 2025. Net income fell similarly to 579M in 2025 from 833M the prior year. Despite a superior gross margin near 61%, its net margin contracts to 11.3%. The declining top line and shrinking bottom-line margins signal deteriorating profitability and operational challenges in its most recent results.
Sustained Growth vs. Margin Contraction
Amphenol clearly outpaces Fortive in revenue and net income growth, supported by improving margins and operational efficiency. Fortive’s higher gross margin is overshadowed by its declining revenue and net profitability. For investors prioritizing durable growth and margin expansion, Amphenol presents a more compelling financial profile.
Financial Ratios Comparison
These vital ratios act as a diagnostic tool to expose the underlying fiscal health, valuation premiums, and capital efficiency of the companies compared:
| Ratios | Amphenol Corporation (APH) | Fortive Corporation (FTV) |
|---|---|---|
| ROE | 31.84% | 8.98% |
| ROIC | 15.12% | 7.44% |
| P/E | 38.55 | 30.16 |
| P/B | 12.27 | 2.71 |
| Current Ratio | 2.98 | 0.71 |
| Quick Ratio | 2.48 | 0.58 |
| D/E (Debt-to-Equity) | 1.16 | 0.50 |
| Debt-to-Assets | 42.78% | 27.31% |
| Interest Coverage | 16.24 | 7.54 |
| Asset Turnover | 0.64 | 0.44 |
| Fixed Asset Turnover | 10.02 | 19.06 |
| Payout Ratio | 18.79% | 15.92% |
| Dividend Yield | 0.49% | 0.53% |
| Fiscal Year | 2025 | 2025 |
Efficiency & Valuation Duel: The Vital Signs
Financial ratios act as a company’s DNA, revealing hidden risks and operational strengths essential for informed investment decisions.
Amphenol Corporation
Amphenol posts a robust 31.8% ROE and a strong 18.5% net margin, signaling high profitability. Its valuation appears stretched with a P/E of 38.55 and P/B at 12.27. The firm returns value modestly through dividends (0.49% yield), balancing reinvestment and shareholder payouts amid solid operational efficiency.
Fortive Corporation
Fortive shows moderate profitability with an 8.98% ROE and an 11.3% net margin, indicating efficiency challenges. Its P/E at 30.16 is high but less stretched than Amphenol’s, while P/B at 2.71 remains reasonable. The company’s low liquidity ratios and modest dividend yield (0.53%) highlight a cautious capital allocation stance.
Premium Valuation vs. Operational Safety
Amphenol’s superior profitability comes at a premium valuation, while Fortive offers a more conservative valuation but weaker returns. Investors prioritizing operational excellence may lean toward Amphenol, whereas risk-averse profiles might prefer Fortive’s more balanced but less profitable outlook.
Which one offers the Superior Shareholder Reward?
I compare Amphenol Corporation (APH) and Fortive Corporation (FTV) on dividends and buybacks to assess shareholder reward. APH yields 0.49% with a 19% payout ratio, signaling moderate dividends well covered by free cash flow (~81%). FTV offers a 0.53% yield but a leaner 16% payout ratio, maintaining high free cash flow coverage (~90%). APH’s buybacks are steady but less aggressive than FTV’s, which prioritizes share repurchases alongside dividends. APH combines reliable dividends and buybacks with strong coverage ratios, enhancing sustainability. FTV’s lower payout and stronger buyback intensity offer a growth-tilted return. In 2026, I find APH’s balanced distribution and cash flow coverage more sustainable, delivering superior total shareholder reward for income and risk-conscious investors.
Comparative Score Analysis: The Strategic Profile
The radar chart reveals the fundamental DNA and trade-offs of Amphenol Corporation and Fortive Corporation, highlighting their core financial strengths and vulnerabilities:
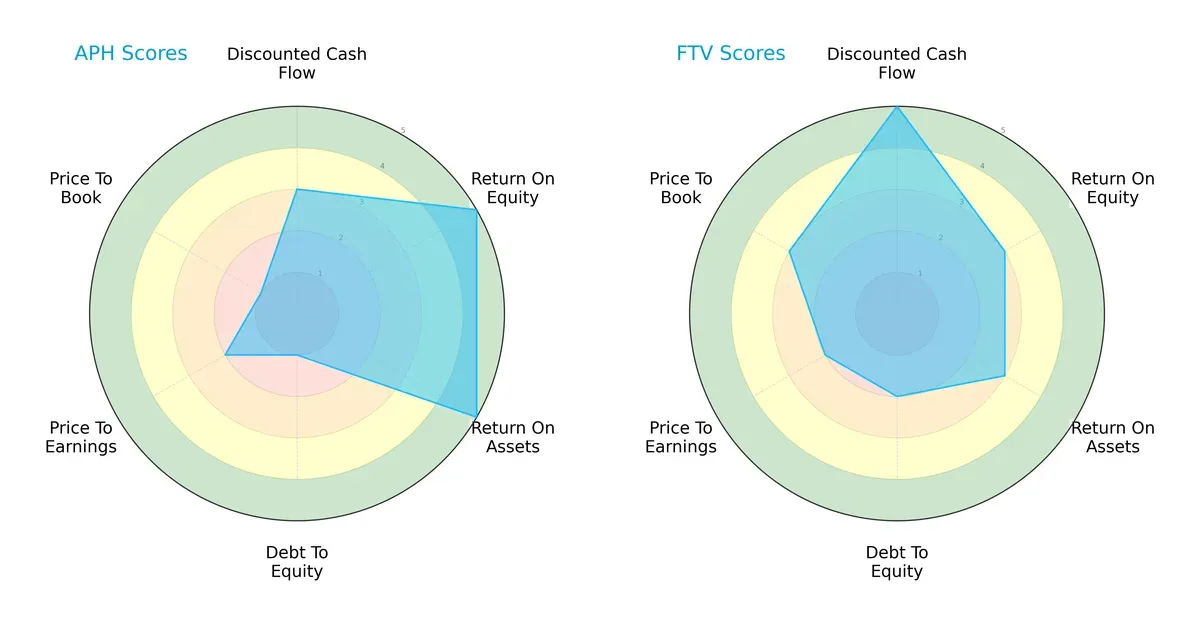
Amphenol excels in profitability with top ROE and ROA scores (5 each), while Fortive leads in discounted cash flow (5) and valuation metrics. Amphenol’s very low debt-to-equity score (1) contrasts sharply with Fortive’s moderate leverage (2). Fortive offers a more balanced profile, whereas Amphenol relies heavily on operational efficiency but carries financial risk from high leverage.
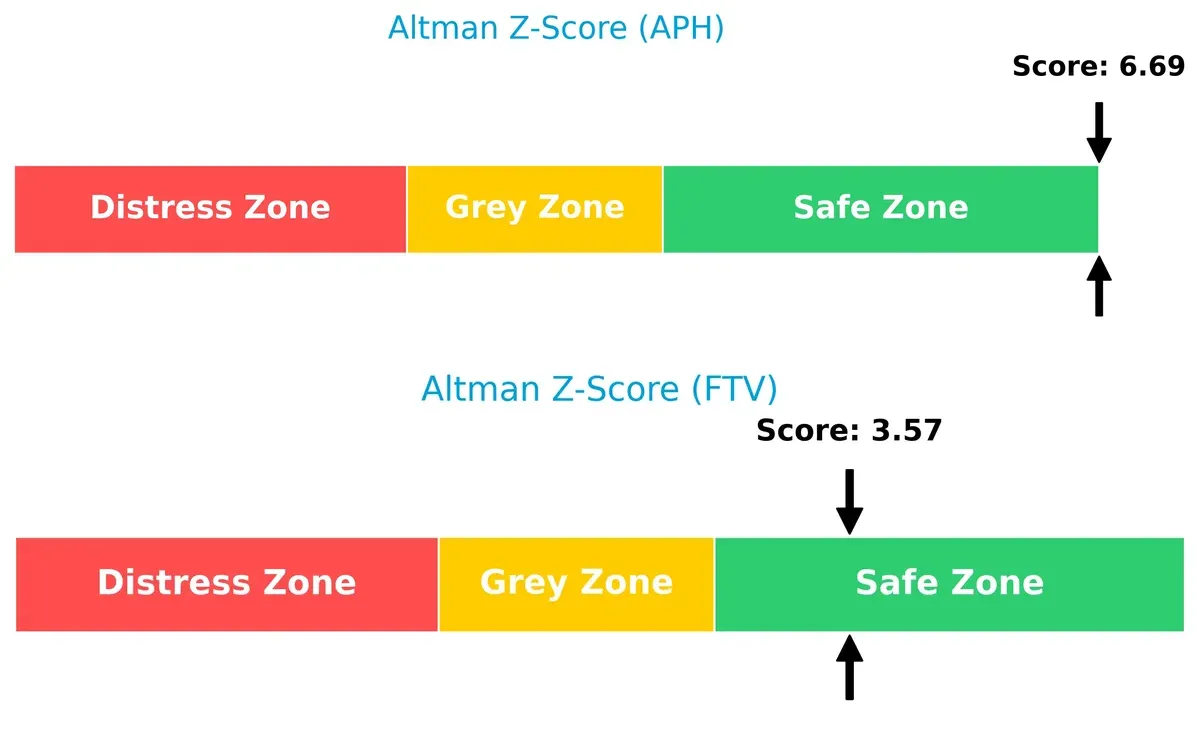
Bankruptcy Risk: Solvency Showdown
Amphenol’s Altman Z-Score at 6.69 significantly exceeds Fortive’s 3.57, placing both safely above distress thresholds but signaling Amphenol’s superior long-term solvency:
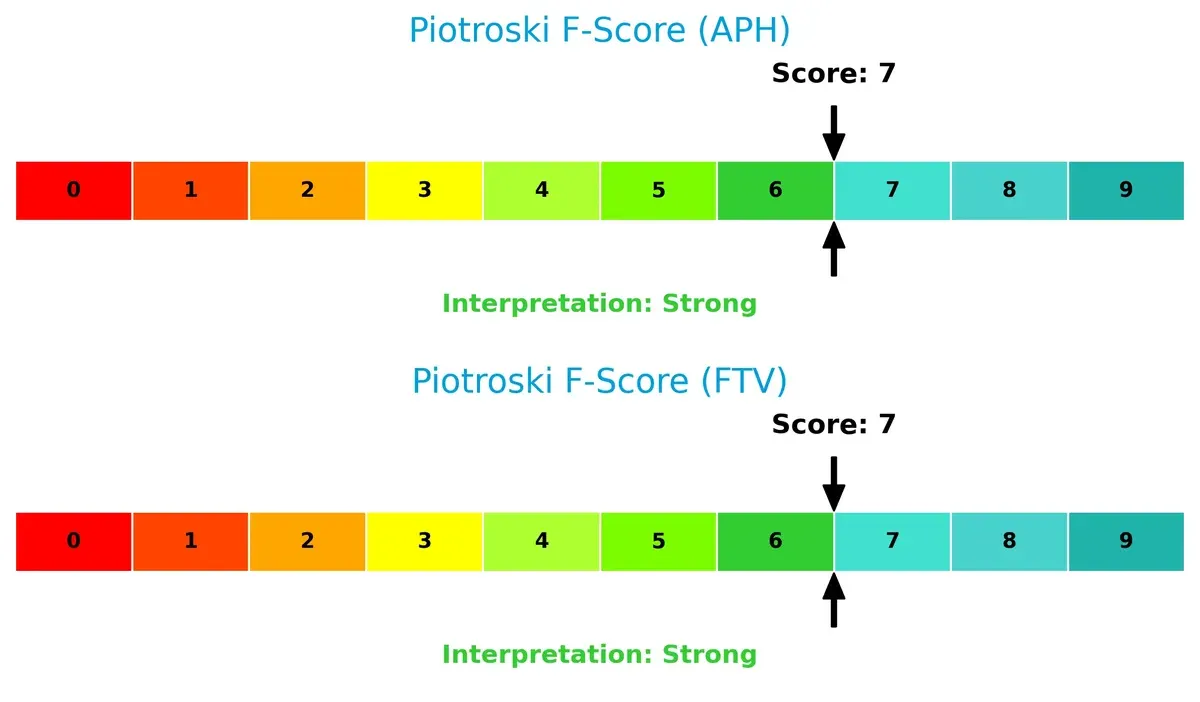
Financial Health: Quality of Operations
Both companies score a strong 7 on the Piotroski F-Score, indicating robust financial health and operational quality without obvious red flags:
How are the two companies positioned?
This section dissects the operational DNA of Amphenol and Fortive by comparing their revenue distribution and internal strengths and weaknesses. Our goal is to confront their economic moats to identify which model offers the most resilient competitive advantage today.
Revenue Segmentation: The Strategic Mix
This visual comparison dissects how Amphenol Corporation and Fortive Corporation diversify their income streams and where their primary sector bets lie:
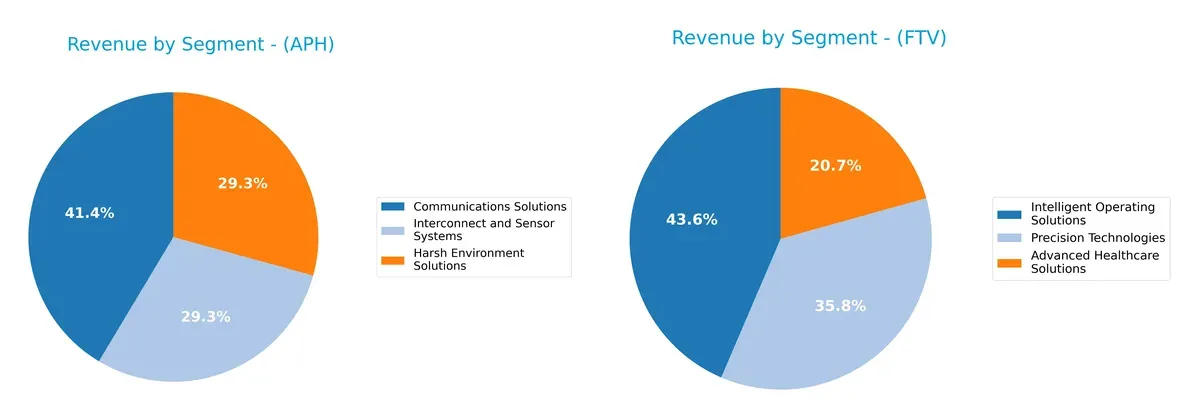
Amphenol pivots on three almost equally weighted segments in 2024: Communications Solutions at $6.4B, Harsh Environment Solutions $4.5B, and Interconnect and Sensor Systems $4.5B. Fortive shows a balanced but slightly more concentrated mix, with Intelligent Operating Solutions anchoring revenue at $2.7B, followed by Precision Technologies $2.2B and Advanced Healthcare Solutions $1.3B. Amphenol’s spread reduces concentration risk, while Fortive’s focus signals strategic bets on operational tech and healthcare innovation.
Strengths and Weaknesses Comparison
This table compares the Strengths and Weaknesses of Amphenol Corporation (APH) and Fortive Corporation (FTV):
APH Strengths
- High net margin at 18.49%
- Strong ROE of 31.84%
- ROIC well above WACC at 15.12%
- Favorable current and quick ratios above 2.4
- Robust interest coverage at 16.23
- Diverse revenue streams across three segments
- Significant global presence with balanced US, China, and other foreign locations
FTV Strengths
- Favorable net margin at 11.26%
- Low debt-to-equity ratio at 0.5
- Favorable debt-to-assets at 27.31%
- Interest coverage at 7.0 supports debt service
- High fixed asset turnover at 19.06
- Solid revenue diversification in healthcare, operating solutions, and precision technologies
- Strong US market dominance
APH Weaknesses
- High PE at 38.55 indicates expensive valuation
- Elevated PB ratio of 12.27 signals overvaluation
- Debt-to-equity at 1.16 is relatively high
- Dividend yield low at 0.49%
- Asset turnover moderate at 0.64
- Neutral debt-to-assets ratio at 42.78%
FTV Weaknesses
- ROE low at 8.98%, below industry favorability
- Unfavorable current and quick ratios below 1
- Asset turnover weak at 0.44
- PE still elevated at 30.16
- Dividend yield low at 0.53%
- Less diversified geographically, heavier US concentration
Overall, APH demonstrates stronger profitability and liquidity metrics, with a well-diversified product and geographic base. FTV shows financial conservatism with lower leverage but faces challenges in asset efficiency and liquidity. These factors influence each company’s strategic flexibility and risk profile.
The Moat Duel: Analyzing Competitive Defensibility
A structural moat is the only shield protecting long-term profits from relentless competitive erosion. Let’s dissect the moats of Amphenol and Fortive:
Amphenol Corporation: Engineering Excellence with High ROIC Moat
Amphenol’s moat stems from its intangible assets and complex product integration. It sustains a strong ROIC well above WACC, reflecting efficient capital use and stable margins. Expansion in harsh environment connectors and fiber optics promises deeper moat protection in 2026.
Fortive Corporation: Software-Driven Operational Efficiency
Fortive relies on its cost advantage and software-enabled product ecosystem, contrasting Amphenol’s hardware focus. Despite a growing ROIC trend, it currently sheds value with ROIC below WACC. Upcoming digital tools and healthcare solutions offer potential but face execution risk.
Intangible Assets vs. Cost Advantage: The Moat Mastery Battle
Amphenol holds the wider and deeper moat, demonstrated by sustained value creation and margin stability. Fortive’s improving profitability is encouraging but insufficient to defend market share as robustly as Amphenol in 2026.
Which stock offers better returns?
Over the past 12 months, Amphenol Corporation’s stock surged sharply before decelerating, while Fortive Corporation faced an overall decline with recent signs of recovery.
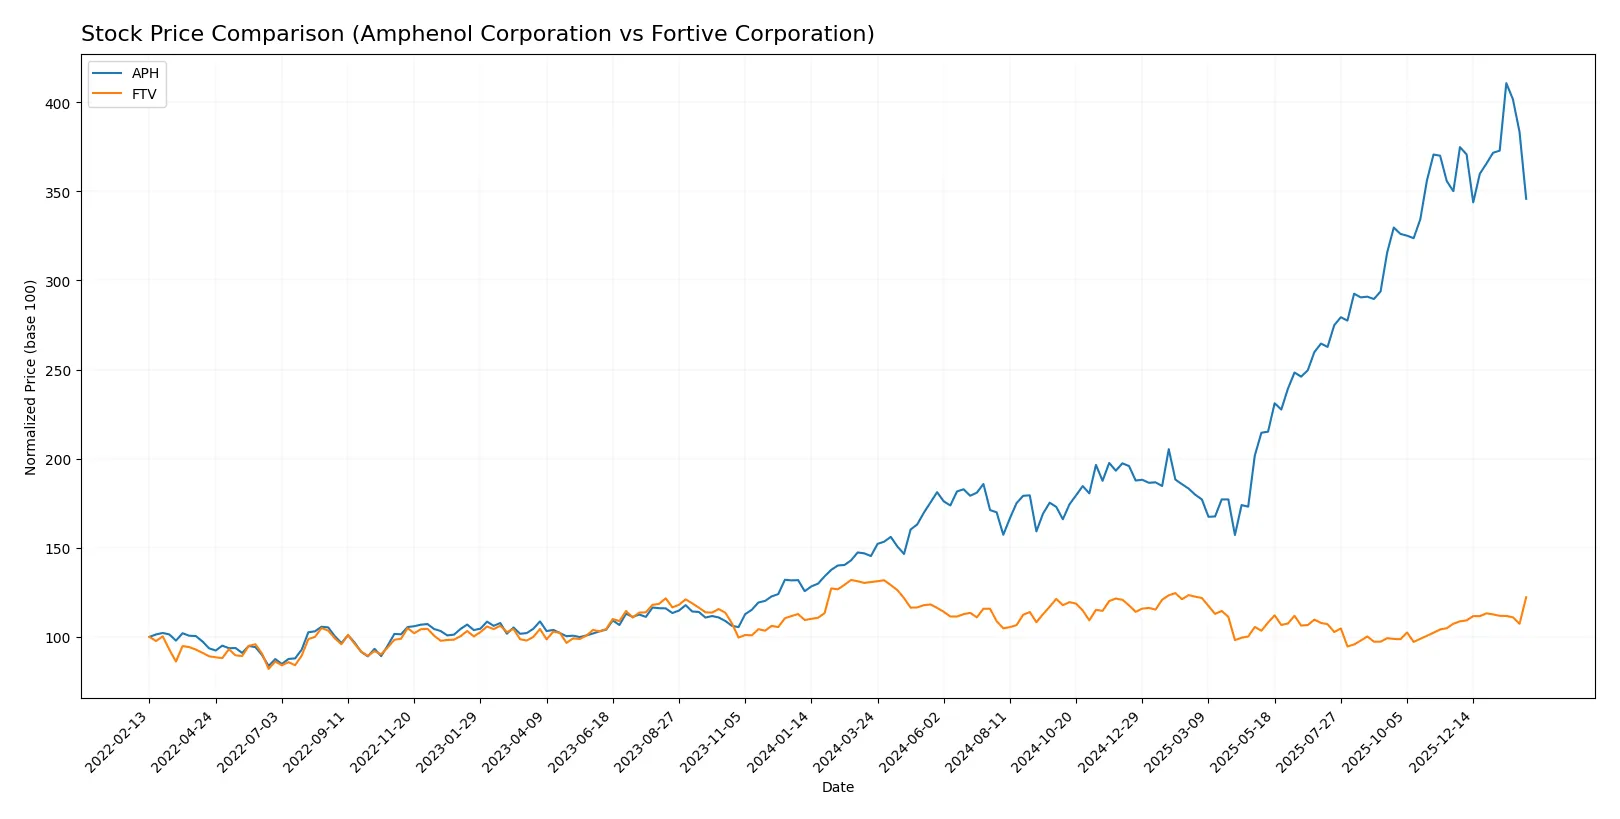
Trend Comparison
Amphenol’s stock gained 138% over the past year, marking a strong bullish trend with high volatility and a recent slight pullback of -1.22%. The price peaked at 154.39 and bottomed at 54.65.
Fortive’s stock fell 6.51% over the same period, reflecting a bearish trend despite accelerating momentum recently, rising 13.84% in the last quarter. Its price ranged between 46.55 and 64.82.
Amphenol clearly delivered superior market performance with a robust overall gain, while Fortive’s trend remains negative despite recent improvement.
Target Prices
Analysts show a clear consensus on target prices for Amphenol Corporation and Fortive Corporation, reflecting moderate upside potential.
| Company | Target Low | Target High | Consensus |
|---|---|---|---|
| Amphenol Corporation | 139 | 210 | 174.13 |
| Fortive Corporation | 51 | 66 | 58 |
The target consensus for Amphenol at 174.13 suggests a significant premium over its current price of 130. Fortive’s consensus at 58 is slightly below its current price of 60.13, indicating mixed expectations.

Don’t Let Luck Decide Your Entry Point
Optimize your entry points with our advanced ProRealTime indicators. You’ll get efficient buy signals with precise price targets for maximum performance. Start outperforming now!
How do institutions grade them?
The following tables summarize recent institutional grades for Amphenol Corporation and Fortive Corporation:
Amphenol Corporation Grades
This table shows current grades assigned by major financial institutions to Amphenol Corporation.
| Grading Company | Action | New Grade | Date |
|---|---|---|---|
| Citigroup | Maintain | Buy | 2026-01-29 |
| Barclays | Maintain | Overweight | 2026-01-29 |
| JP Morgan | Maintain | Overweight | 2026-01-27 |
| UBS | Maintain | Buy | 2026-01-14 |
| Barclays | Upgrade | Overweight | 2026-01-12 |
| Citigroup | Maintain | Buy | 2026-01-12 |
| Truist Securities | Maintain | Buy | 2025-12-19 |
| Barclays | Maintain | Equal Weight | 2025-11-13 |
| UBS | Maintain | Buy | 2025-10-23 |
| Goldman Sachs | Maintain | Buy | 2025-10-23 |
Fortive Corporation Grades
This table presents recent grades from major financial institutions for Fortive Corporation.
| Grading Company | Action | New Grade | Date |
|---|---|---|---|
| JP Morgan | Downgrade | Underweight | 2026-01-16 |
| Mizuho | Downgrade | Underperform | 2026-01-05 |
| Wells Fargo | Maintain | Equal Weight | 2025-12-22 |
| Citigroup | Maintain | Neutral | 2025-12-08 |
| Morgan Stanley | Maintain | Equal Weight | 2025-11-05 |
| Baird | Maintain | Outperform | 2025-11-04 |
| JP Morgan | Maintain | Neutral | 2025-10-30 |
| Barclays | Maintain | Equal Weight | 2025-10-30 |
| Citigroup | Maintain | Neutral | 2025-10-30 |
| Truist Securities | Maintain | Hold | 2025-10-30 |
Which company has the best grades?
Amphenol Corporation consistently receives Buy and Overweight ratings, indicating strong institutional confidence. Fortive Corporation’s grades skew Neutral to Underweight, reflecting more cautious views. Investors may interpret Amphenol’s higher grades as a signal of comparatively stronger market sentiment.
Risks specific to each company
The following categories identify the critical pressure points and systemic threats facing both firms in the 2026 market environment:
1. Market & Competition
Amphenol Corporation
- Faces intense competition in electronics connectors with pressure on pricing and innovation cycles.
Fortive Corporation
- Competes in diversified industrial and software solutions, where rapid tech evolution demands constant adaptation.
2. Capital Structure & Debt
Amphenol Corporation
- High debt-to-equity ratio (1.16) signals elevated leverage risk despite good interest coverage.
Fortive Corporation
- More conservative debt profile (D/E 0.5) reduces financial risk, aiding stability in volatile markets.
3. Stock Volatility
Amphenol Corporation
- Beta of 1.21 indicates higher volatility than the market, increasing investment risk.
Fortive Corporation
- Slightly lower beta at 1.12 suggests moderate sensitivity to market swings.
4. Regulatory & Legal
Amphenol Corporation
- Subject to global trade policies impacting supply chains and international sales.
Fortive Corporation
- Faces compliance complexities due to software and healthcare segments, with evolving regulatory landscapes.
5. Supply Chain & Operations
Amphenol Corporation
- Global manufacturing footprint exposed to component shortages and logistics disruptions.
Fortive Corporation
- Operations dependent on specialized manufacturing and software service delivery, vulnerable to tech supply constraints.
6. ESG & Climate Transition
Amphenol Corporation
- Pressure to reduce emissions in manufacturing and meet growing customer sustainability demands.
Fortive Corporation
- Must integrate ESG in software solutions and hardware production, balancing innovation with environmental compliance.
7. Geopolitical Exposure
Amphenol Corporation
- Significant exposure to US-China trade tensions given international sales base.
Fortive Corporation
- Less direct exposure but sensitive to global market shifts affecting industrial end-markets.
Which company shows a better risk-adjusted profile?
Amphenol’s largest risk is its elevated leverage, which magnifies vulnerability in downturns despite strong operational metrics. Fortive’s main risk lies in weaker profitability and liquidity ratios, challenging its resilience under stress. Fortive’s conservative debt and safer current ratios offer a better risk-adjusted profile. Amphenol’s high debt-to-equity ratio (1.16) contrasts sharply with Fortive’s 0.5, underscoring my concern about Amphenol’s financial risk despite its superior profitability.
Final Verdict: Which stock to choose?
Amphenol Corporation’s superpower lies in its robust value creation and operational efficiency, reflected in a very favorable moat and strong profitability growth. Its point of vigilance is the relatively high leverage, which could pressure financial flexibility. It fits well in aggressive growth portfolios seeking sustained capital appreciation.
Fortive Corporation’s strategic moat centers on improving profitability amid a challenging revenue environment. It offers a safer balance sheet with lower leverage but weaker returns, positioning it as a more cautious choice. This stock might align with GARP investors who value stability with moderate growth potential.
If you prioritize aggressive growth and strong value creation, Amphenol outshines due to its proven economic moat and earnings momentum. However, if you seek better balance sheet safety and a steadier risk profile, Fortive offers superior stability despite slower profit expansion. Each appeals to distinct investor profiles with different risk tolerances.
Disclaimer: Investment carries a risk of loss of initial capital. The past performance is not a reliable indicator of future results. Be sure to understand risks before making an investment decision.
Go Further
I encourage you to read the complete analyses of Amphenol Corporation and Fortive Corporation to enhance your investment decisions: