Home > Comparison > Technology > APH vs FN
The strategic rivalry between Amphenol Corporation and Fabrinet shapes the competitive landscape of the technology hardware sector. Amphenol, a diversified industrial leader, excels in harsh environment connectors and broad interconnect systems. Fabrinet operates as a specialized contract manufacturer focusing on precision optical and electro-mechanical solutions. This analysis contrasts their capital allocation and market positioning to identify which company offers a superior risk-adjusted return for a diversified portfolio in 2026.
Table of contents
Companies Overview
Amphenol Corporation and Fabrinet stand as key players in the global hardware, equipment, and parts sector, shaping connectivity and precision manufacturing markets.
Amphenol Corporation: Global Connector Powerhouse
Amphenol Corporation dominates as a leading designer and manufacturer of electrical and fiber optic connectors worldwide. Its core revenue derives from harsh environment solutions, communications, and sensor systems. In 2026, the firm emphasizes expanding its value-added product portfolio, including cable assemblies and sensor-based innovations, to strengthen its foothold across automotive, aerospace, and IT markets.
Fabrinet: Precision Optical Manufacturing Specialist
Fabrinet excels as a provider of advanced optical packaging and manufacturing services across North America, Asia-Pacific, and Europe. Its revenue engine revolves around optical components and modules that support high-speed data communications and industrial laser markets. The company’s strategic focus in 2026 centers on optimizing integration and testing capabilities to meet growing demand from data centers, automotive sensors, and medical device sectors.
Strategic Collision: Similarities & Divergences
Both companies operate in hardware and equipment but diverge sharply in their business philosophies. Amphenol pursues a broad product ecosystem with diverse end markets, while Fabrinet specializes in precision optical manufacturing services. Their primary battleground lies in advanced connectivity components for data and communication infrastructure. Amphenol offers a diversified investment profile; Fabrinet presents a niche, technologically focused exposure.
Income Statement Comparison
This data dissects the core profitability and scalability of both corporate engines to reveal who dominates the bottom line:
| Metric | Amphenol Corporation (APH) | Fabrinet (FN) |
|---|---|---|
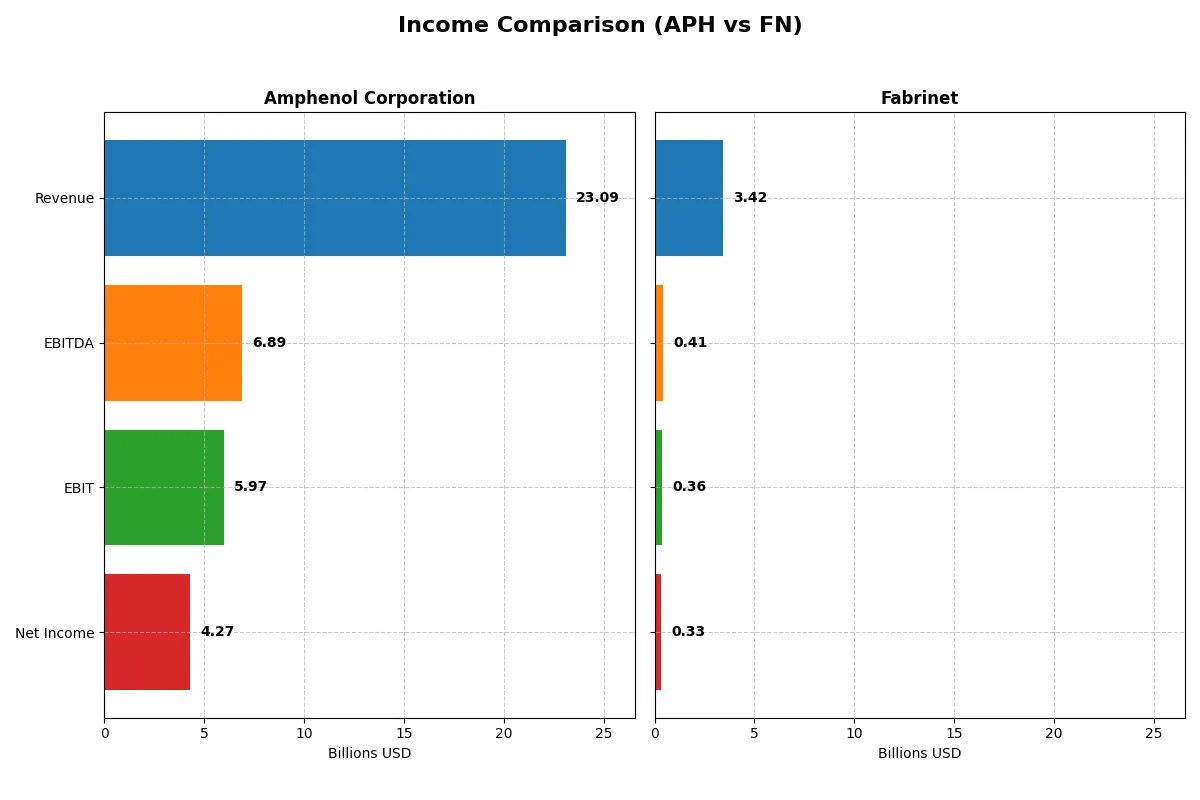
| Revenue | 23.1B | 3.4B |
| Cost of Revenue | 14.6B | 3.0B |
| Operating Expenses | 2.5B | 89M |
| Gross Profit | 8.5B | 413M |
| EBITDA | 6.9B | 409M |
| EBIT | 6.0B | 355M |
| Interest Expense | 368M | 0 |
| Net Income | 4.3B | 333M |
| EPS | 3.51 | 9.23 |
| Fiscal Year | 2025 | 2025 |
Income Statement Analysis: The Bottom-Line Duel
This income statement comparison unveils the true operational efficiency and profitability momentum of two distinct corporate engines.
Amphenol Corporation Analysis
Amphenol’s revenue more than doubled from 2021 to 2025, reaching 23B in 2025. Net income surged 168% over five years to 4.27B. Gross and net margins stand strong at 36.9% and 18.5%, respectively, reflecting excellent cost control. In 2025, Amphenol accelerated EBIT by 85%, signaling robust operational leverage and expanding profitability.
Fabrinet Analysis
Fabrinet grew revenue by 82% from 2021 to 2025, achieving 3.42B in the latest year. Net income climbed 124% to 333M, supported by a net margin of 9.7%. Gross margin remains modest at 12.1% but EBIT margin at 10.4% shows efficient overhead management. Despite a slight dip in net margin growth last year, Fabrinet maintains steady EPS growth and operational momentum.
Verdict: Margin Power vs. Revenue Scale
Amphenol dominates with superior scale, profitability, and margin expansion, delivering a powerful combination of growth and efficiency. Fabrinet offers solid growth and efficient cost management but at a smaller scale and lower margins. For investors, Amphenol’s profile signals a more compelling fundamental winner with greater earnings leverage and margin resilience.
Financial Ratios Comparison
These vital ratios act as a diagnostic tool to expose the underlying fiscal health, valuation premiums, and capital efficiency of the companies analyzed:
| Ratios | Amphenol Corporation (APH) | Fabrinet (FN) |
|---|---|---|
| ROE | 24.8% | 16.8% |
| ROIC | 14.9% | 15.0% |
| P/E | 34.5 | 32.0 |
| P/B | 8.54 | 5.37 |
| Current Ratio | 2.37 | 3.61 |
| Quick Ratio | 1.75 | 2.78 |
| D/E | 0.74 | 0.003 |
| Debt-to-Assets | 34.0% | 0.2% |
| Interest Coverage | 15.1 | 2240 (extremely high) |
| Asset Turnover | 0.71 | 1.23 |
| Fixed Asset Turnover | 7.26 | 9.22 |
| Payout ratio | 24.6% | 0% |
| Dividend yield | 0.71% | 0% |
| Fiscal Year | 2024 | 2024 |
Efficiency & Valuation Duel: The Vital Signs
Financial ratios act as a company’s DNA, uncovering hidden risks and operational strengths beneath headline figures.
Amphenol Corporation
Amphenol shows strong profitability with a 24.75% ROE and a favorable 15.92% net margin. However, its valuation appears stretched, with a high P/E of 34.49 and P/B of 8.54. The stock offers a modest 0.71% dividend yield, signaling limited shareholder returns amid reinvestment in R&D and growth.
Fabrinet
Fabrinet delivers solid efficiency, boasting a 16.78% ROE and a decent 9.72% net margin. Its valuation is also stretched, reflected by a P/E of 32.02 and P/B of 5.37. Fabrinet pays no dividend, instead focusing capital on operational growth and maintaining a strong balance sheet with zero debt.
Valuation Stretch vs. Operational Efficiency
Fabrinet leads in operational efficiency and balance sheet strength, while Amphenol excels in profitability but carries a higher valuation premium. Investors seeking growth with lower leverage might prefer Fabrinet’s profile; those valuing strong returns and modest yield might lean toward Amphenol.
Which one offers the Superior Shareholder Reward?
Amphenol Corporation (APH) pays a modest dividend yield around 0.85% with a sustainable payout ratio near 25%. Its free cash flow covers dividends over twice, signaling reliable income. APH combines dividends with steady buybacks, enhancing total shareholder return. Fabrinet (FN) offers zero dividends but reinvests heavily in growth and acquisitions, supported by robust free cash flow and minimal debt. However, FN’s buybacks are less aggressive. Historically, APH’s balanced distribution model with dividends plus buybacks presents a more consistent and sustainable total return profile for 2026 investors seeking both income and growth.
Comparative Score Analysis: The Strategic Profile
The radar chart reveals the fundamental DNA and trade-offs of Amphenol Corporation and Fabrinet, highlighting their distinct financial strengths and vulnerabilities:
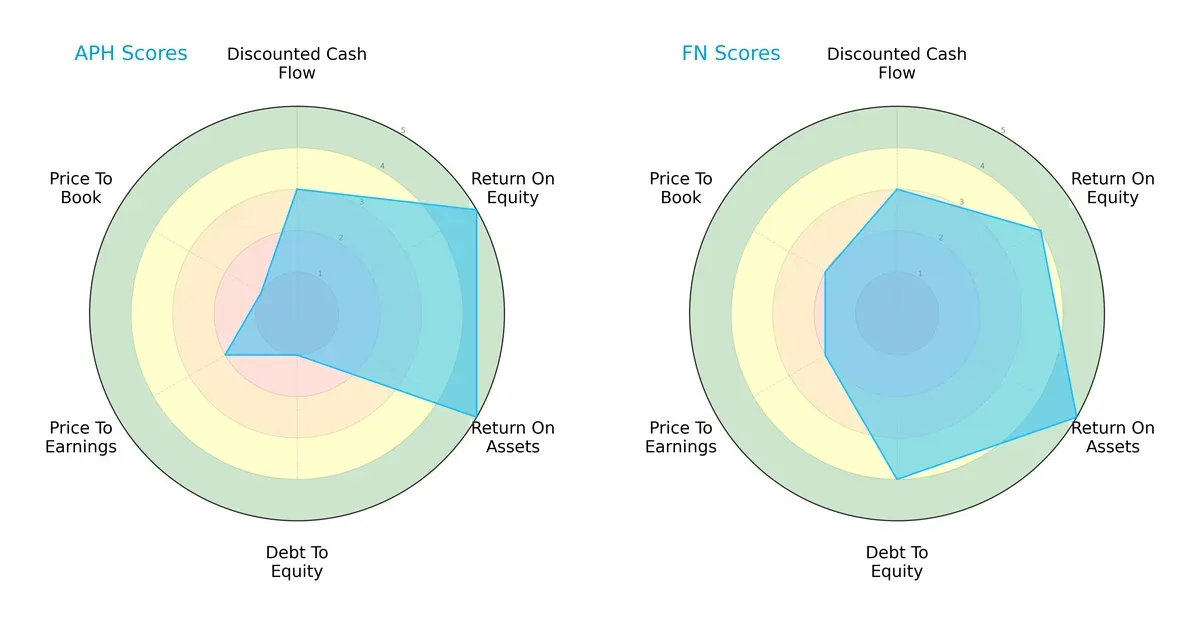
Amphenol boasts superior profitability metrics, scoring 5 in ROE and ROA, but suffers from a weak balance sheet with a debt-to-equity score of 1. Fabrinet presents a more balanced profile with strong asset efficiency (ROA 5) and a healthier leverage position (debt-to-equity 4). While Amphenol relies heavily on operational excellence, Fabrinet combines solid profitability with prudent financial risk management.
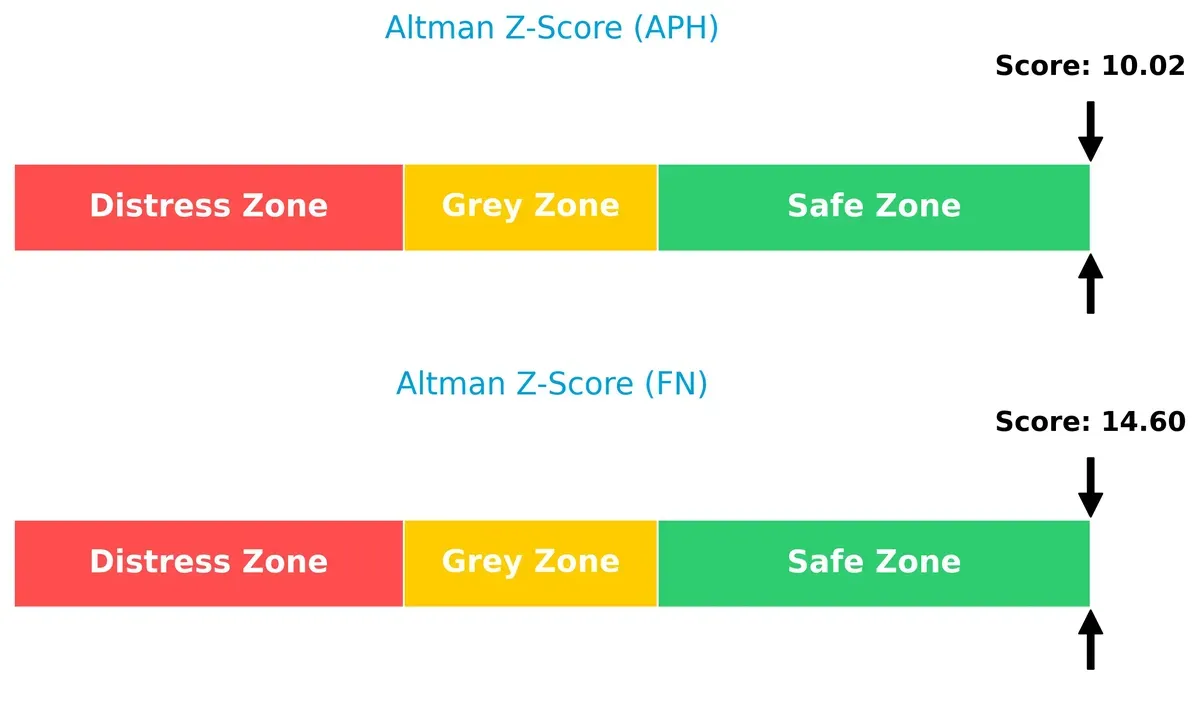
Bankruptcy Risk: Solvency Showdown
Fabrinet’s Altman Z-Score of 14.6 significantly surpasses Amphenol’s 10.0, signaling a stronger buffer against bankruptcy risks amid economic fluctuations:
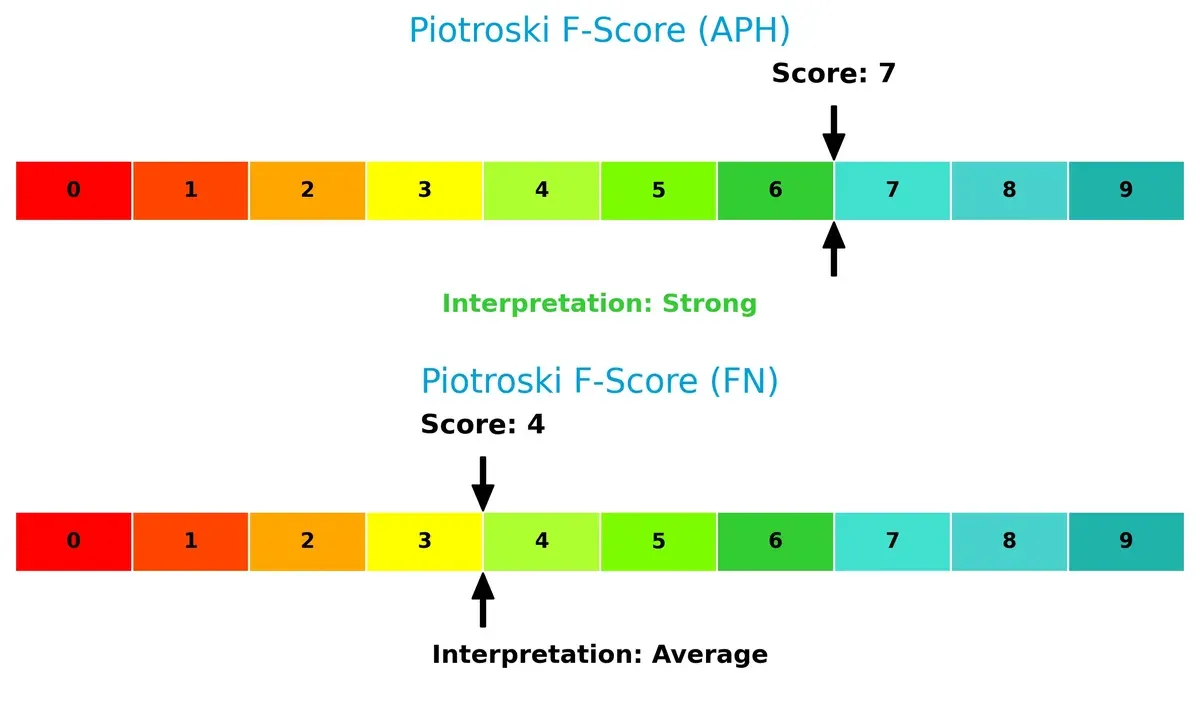
Financial Health: Quality of Operations
Amphenol’s Piotroski F-Score of 7 reflects robust internal financial health, outperforming Fabrinet’s average score of 4, which raises moderate red flags on operational quality:
How are the two companies positioned?
This section dissects Amphenol and Fabrinet’s operational DNA by comparing revenue distribution and internal strengths and weaknesses. The goal is to confront their economic moats to reveal which model delivers a more resilient, sustainable advantage.
Revenue Segmentation: The Strategic Mix
This visual comparison dissects how Amphenol Corporation and Fabrinet diversify income streams and highlights their primary sector bets in recent years:
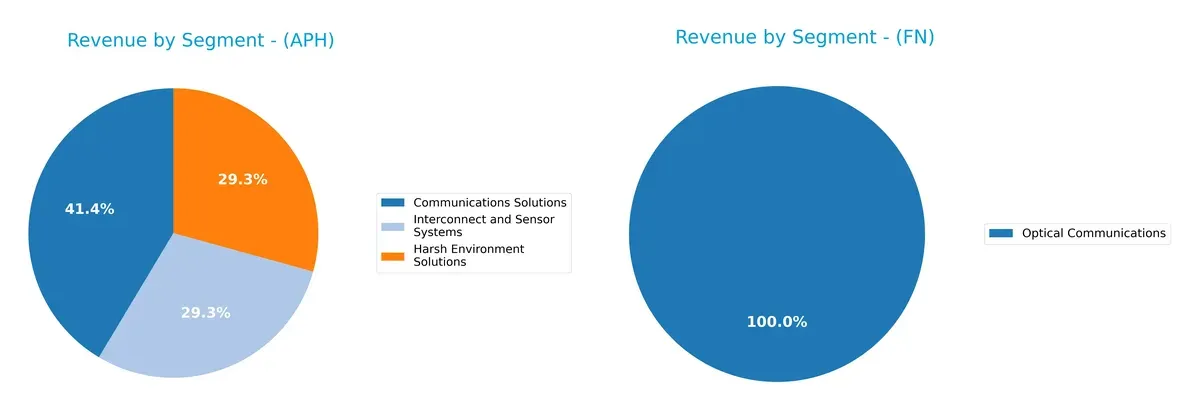
Amphenol anchors revenue across three sizable segments: Communications Solutions at $6.38B, and Harsh Environment and Interconnect Systems each near $4.5B. This diversified portfolio reduces concentration risk and leverages broad industrial demand. Fabrinet pivots heavily on Optical Communications, generating $2.62B in 2025, with a smaller $637M from Lasers and Sensors. Fabrinet’s narrower focus risks exposure but could benefit from deep expertise and infrastructure lock-in in optical components.
Strengths and Weaknesses Comparison
This table compares the strengths and weaknesses of Amphenol Corporation and Fabrinet based on diversification, profitability, financials, innovation, global presence, and market share:
Amphenol Corporation Strengths
- Diverse product segments with strong revenue in communications and sensor systems
- Favorable ROE and net margin above 15%
- Solid liquidity ratios with current ratio at 2.37
- Global operations with significant revenue from U.S. and foreign locations
Fabrinet Strengths
- Favorable ROE and ROIC exceeding WACC indicate efficient capital use
- Strong liquidity with current ratio at 3.0 and zero debt
- Higher asset turnover demonstrates operational efficiency
- Growing optical communications revenue supports innovation and market focus
Amphenol Corporation Weaknesses
- High P/E and P/B ratios suggest potential overvaluation risk
- Dividend yield low at 0.71% may limit income appeal
- Debt-to-equity ratio of 0.74 indicates moderate leverage
- Neutral interest coverage ratio could constrain financial flexibility
Fabrinet Weaknesses
- Also exhibits high P/E and P/B ratios, indicating valuation concerns
- Zero dividend yield offers no income to shareholders
- Net margin is neutral at 9.72%, below Amphenol’s level
- Limited product diversification focused mainly on optical communications
Amphenol’s diversified segments and favorable profitability ratios provide resilience across market cycles. Fabrinet excels in capital efficiency and liquidity but faces challenges from narrower diversification and valuation risks. Both companies show strengths in market presence yet differ in financial leverage and income distribution strategies.
The Moat Duel: Analyzing Competitive Defensibility
A structural moat shields long-term profits from relentless competitive pressure. Without it, earnings inevitably erode:
Amphenol Corporation (APH): Intangible Assets & Scale Moat
I see APH’s moat rooted in its broad product portfolio and global scale, driving stable margins and high ROIC near 26%. Its growing ROIC trend (+17%) confirms durable value creation. In 2026, expansion into harsh environment connectors and sensor systems could deepen this advantage.
Fabrinet (FN): Precision Manufacturing & Customer Lock-in
FN’s moat hinges on specialized manufacturing expertise and close OEM relationships, supporting a solid ROIC and a +20% ROIC growth trend. Unlike APH, FN’s narrower product scope limits scale but enhances switching costs. Opportunities lie in optical and laser component markets, potentially disrupting adjacent sectors.
Scale & Intangibles vs. Specialized Manufacturing Expertise
Both companies post very favorable moats with ROIC above WACC and growing trends. APH’s wider moat benefits from diversified product lines and geographic reach. FN’s moat, while deep, is more niche. APH appears better positioned to defend market share amid evolving industry demands.
Which stock offers better returns?
Over the past year, both Amphenol Corporation and Fabrinet exhibited strong upward momentum with accelerating price gains, reflecting robust trading dynamics and notable volatility differences.
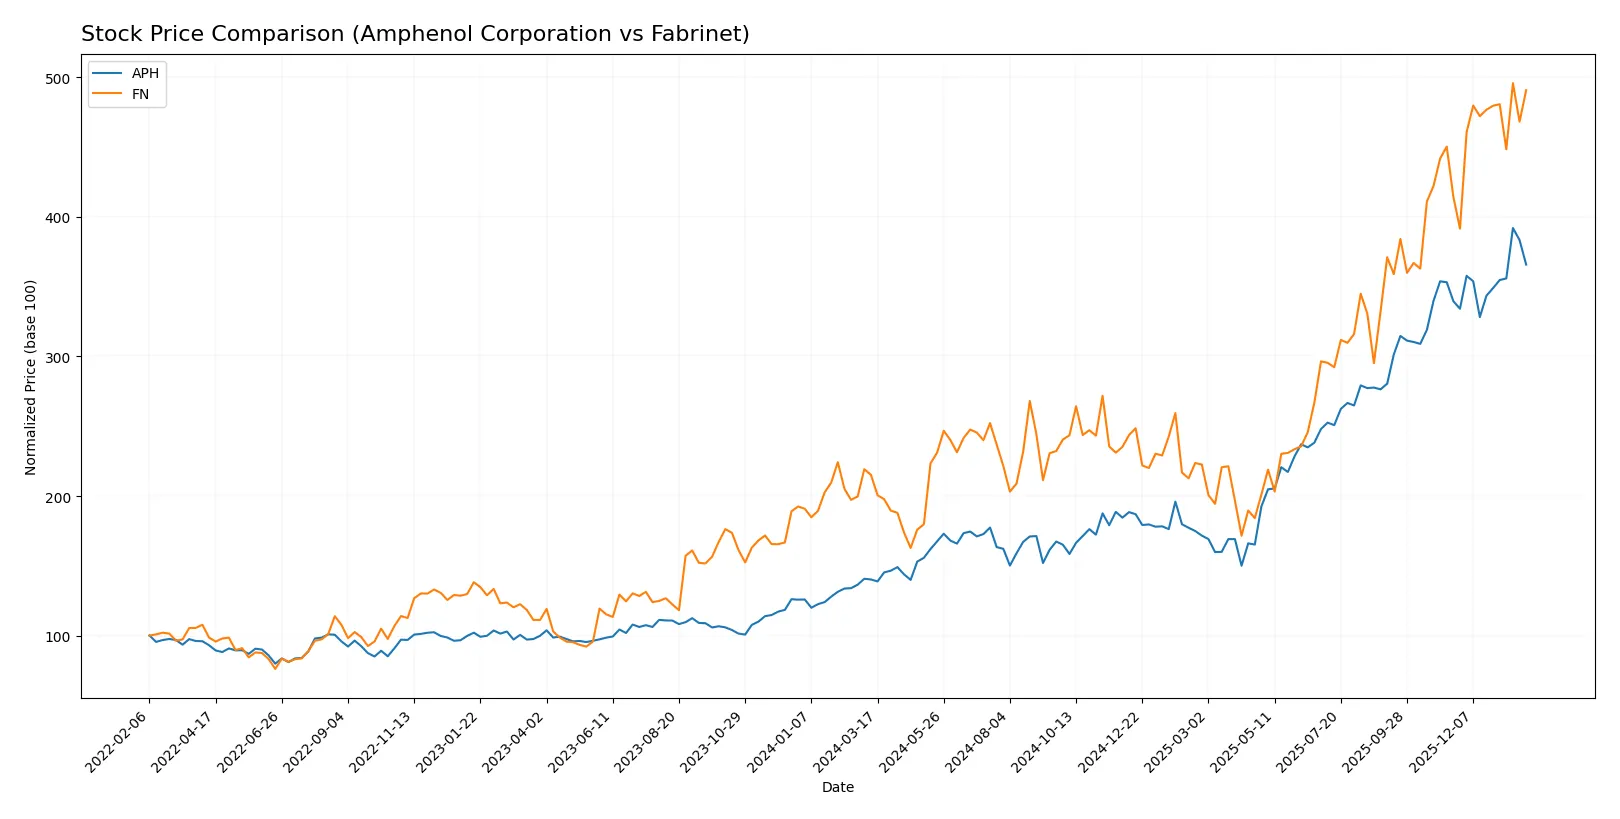
Trend Comparison
Amphenol Corporation’s stock rose 161% over 12 months, showing a bullish trend with accelerating gains, a high of 154.39, and low volatility (28.51 std deviation).
Fabrinet gained 128% in the same period, also bullish with accelerating momentum, but exhibited higher volatility (90.27 std deviation) and a peak price of 494.45.
Amphenol outperformed Fabrinet in total return, despite Fabrinet’s higher recent momentum and volatility.
Target Prices
Analysts present a bullish consensus for both Amphenol Corporation and Fabrinet, signaling growth potential above current prices.
| Company | Target Low | Target High | Consensus |
|---|---|---|---|
| Amphenol Corporation | 139 | 210 | 174.13 |
| Fabrinet | 537 | 600 | 569 |
Amphenol’s consensus target exceeds its current 144.08 price by over 20%, suggesting upside potential. Fabrinet’s target consensus at 569 is substantially higher than its 489.44 price, indicating strong analyst confidence.

Don’t Let Luck Decide Your Entry Point
Optimize your entry points with our advanced ProRealTime indicators. You’ll get efficient buy signals with precise price targets for maximum performance. Start outperforming now!
How do institutions grade them?
Amphenol Corporation Grades
The following table summarizes recent grades from major financial institutions for Amphenol Corporation.
| Grading Company | Action | New Grade | Date |
|---|---|---|---|
| Citigroup | Maintain | Buy | 2026-01-29 |
| Barclays | Maintain | Overweight | 2026-01-29 |
| JP Morgan | Maintain | Overweight | 2026-01-27 |
| UBS | Maintain | Buy | 2026-01-14 |
| Citigroup | Maintain | Buy | 2026-01-12 |
| Barclays | Upgrade | Overweight | 2026-01-12 |
| Truist Securities | Maintain | Buy | 2025-12-19 |
| Barclays | Maintain | Equal Weight | 2025-11-13 |
| Citigroup | Maintain | Buy | 2025-10-23 |
| Truist Securities | Maintain | Buy | 2025-10-23 |
Fabrinet Grades
Below is a table presenting recent grades from respected financial firms for Fabrinet.
| Grading Company | Action | New Grade | Date |
|---|---|---|---|
| Susquehanna | Maintain | Positive | 2026-01-22 |
| Barclays | Upgrade | Overweight | 2026-01-14 |
| Barclays | Maintain | Equal Weight | 2025-11-05 |
| JP Morgan | Maintain | Overweight | 2025-11-04 |
| Needham | Maintain | Buy | 2025-11-04 |
| Rosenblatt | Maintain | Buy | 2025-11-04 |
| JP Morgan | Maintain | Overweight | 2025-10-16 |
| Rosenblatt | Maintain | Buy | 2025-10-02 |
| JP Morgan | Upgrade | Overweight | 2025-08-25 |
| Rosenblatt | Maintain | Buy | 2025-08-19 |
Which company has the best grades?
Amphenol Corporation consistently receives Buy and Overweight ratings from top firms, signaling strong institutional confidence. Fabrinet shows a mix of Buy and Overweight grades but also some Equal Weight ratings. Investors may interpret Amphenol’s steadier high-grade trend as a clearer signal of analyst conviction.
Risks specific to each company
The following categories identify critical pressure points and systemic threats facing Amphenol Corporation and Fabrinet within the 2026 market environment:
1. Market & Competition
Amphenol Corporation
- Faces intense competition in electronic connectors and interconnect solutions, requiring constant innovation to maintain leadership.
Fabrinet
- Operates in advanced optical and electro-mechanical manufacturing, facing pressure from specialized competitors and technology shifts.
2. Capital Structure & Debt
Amphenol Corporation
- Moderate leverage with debt-to-assets at 34%; interest coverage strong at 16.2x but debt-to-equity score very unfavorable, signaling some financial risk.
Fabrinet
- Virtually no debt, debt-to-assets at 0.2%, and infinite interest coverage delivers a very strong balance sheet and financial flexibility.
3. Stock Volatility
Amphenol Corporation
- Beta of 1.21 suggests above-market volatility; stock trading near 52-week high but recent pullback signals sensitivity to market swings.
Fabrinet
- Beta near 1.04 indicates moderate volatility; stable trading range with less reactive price movements than Amphenol.
4. Regulatory & Legal
Amphenol Corporation
- Exposure to global trade policies and compliance in multiple industries, including aerospace and automotive, creates regulatory complexity.
Fabrinet
- Regulatory risks stem from global manufacturing footprint and advanced tech sectors, but less diversified exposure may concentrate risk.
5. Supply Chain & Operations
Amphenol Corporation
- Large, complex supply chain across harsh environment and communication solutions; supply disruptions could impact production significantly.
Fabrinet
- Relies heavily on precision manufacturing and optical components; supply chain agility critical but smaller scale may limit resilience.
6. ESG & Climate Transition
Amphenol Corporation
- ESG initiatives face challenges due to broad manufacturing footprint and energy-intensive processes; climate transition costs could pressure margins.
Fabrinet
- Focus on advanced manufacturing allows targeted ESG improvements, but limited disclosure on climate strategy may raise investor concerns.
7. Geopolitical Exposure
Amphenol Corporation
- Significant US and China operations expose it to trade tensions and geopolitical risks influencing supply and sales.
Fabrinet
- Headquartered in Cayman Islands with Asia-Pacific manufacturing; geopolitical risks present but more regionally concentrated.
Which company shows a better risk-adjusted profile?
Amphenol’s key risk lies in market competition and its leveraged capital structure, which could strain financial flexibility amid volatile markets. Fabrinet’s main concern is its concentrated supply chain and moderate regulatory exposure. I see Fabrinet as having a stronger risk-adjusted profile, buoyed by its pristine balance sheet and lower stock volatility. The stark contrast in debt-to-equity scores and Altman Z-Scores underscores Fabrinet’s superior financial stability.
Final Verdict: Which stock to choose?
Amphenol Corporation’s superpower lies in its durable competitive advantage, evidenced by a growing ROIC well above its cost of capital. It efficiently converts invested capital into strong profitability and revenue growth. A point of vigilance is its relatively high valuation multiples, which could temper near-term upside. It fits well in aggressive growth portfolios seeking industry leadership.
Fabrinet’s strategic moat centers on its debt-free balance sheet and solid operational efficiency, delivering a safer profile than Amphenol. Its well-managed capital allocation and consistent profitability provide stability, though growth rates are more moderate. Fabrinet suits growth-at-a-reasonable-price (GARP) investors favoring resilience over rapid expansion.
If you prioritize robust growth and can tolerate valuation premiums, Amphenol outshines as a dynamic value creator with accelerating momentum. However, if you seek better financial stability with a cleaner balance sheet and a more conservative risk profile, Fabrinet offers that edge. Both show durable moats, but your investor profile dictates which scenario is more compelling.
Disclaimer: Investment carries a risk of loss of initial capital. The past performance is not a reliable indicator of future results. Be sure to understand risks before making an investment decision.
Go Further
I encourage you to read the complete analyses of Amphenol Corporation and Fabrinet to enhance your investment decisions: