Home > Comparison > Technology > APH vs GLW
The strategic rivalry between Amphenol Corporation and Corning Incorporated shapes the trajectory of the technology hardware sector. Amphenol operates as a diversified connector and sensor systems manufacturer, while Corning focuses on specialty materials and optical communications. This head-to-head highlights a contrast between broad industrial components and advanced material science leadership. This analysis aims to identify which company delivers superior risk-adjusted returns for a diversified investor portfolio.
Table of contents
Companies Overview
Amphenol Corporation and Corning Incorporated stand as leading forces in the hardware and equipment sector, shaping global technology infrastructure.
Amphenol Corporation: Global Connector Powerhouse
Amphenol dominates as a designer and manufacturer of electrical, electronic, and fiber optic connectors. Its core revenue comes from harsh environment solutions, communications, and sensor systems serving automotive, aerospace, and industrial markets. In 2026, Amphenol focuses strategically on expanding its high-speed and fiber optic connector offerings to capture growth in broadband and mobile networks.
Corning Incorporated: Specialty Glass & Optical Innovator
Corning leads in specialty materials and optical communications, producing glass substrates for displays and optical fibers for telecommunications. It generates revenue by serving display technologies, environmental controls, and life sciences segments worldwide. The company’s 2026 strategy emphasizes advancing ultra-thin glass technologies and expanding its environmental and life sciences product lines to diversify its portfolio.
Strategic Collision: Similarities & Divergences
Both companies operate in the hardware space but diverge sharply in focus. Amphenol pursues a connector-centric, integrated systems approach, while Corning emphasizes materials science and optical innovation. Their primary battleground lies in telecommunications infrastructure, where Corning’s fiber optic products face Amphenol’s connector systems. These differences shape distinct investment profiles: Amphenol offers broad industrial exposure, whereas Corning provides niche specialization with diversified end markets.
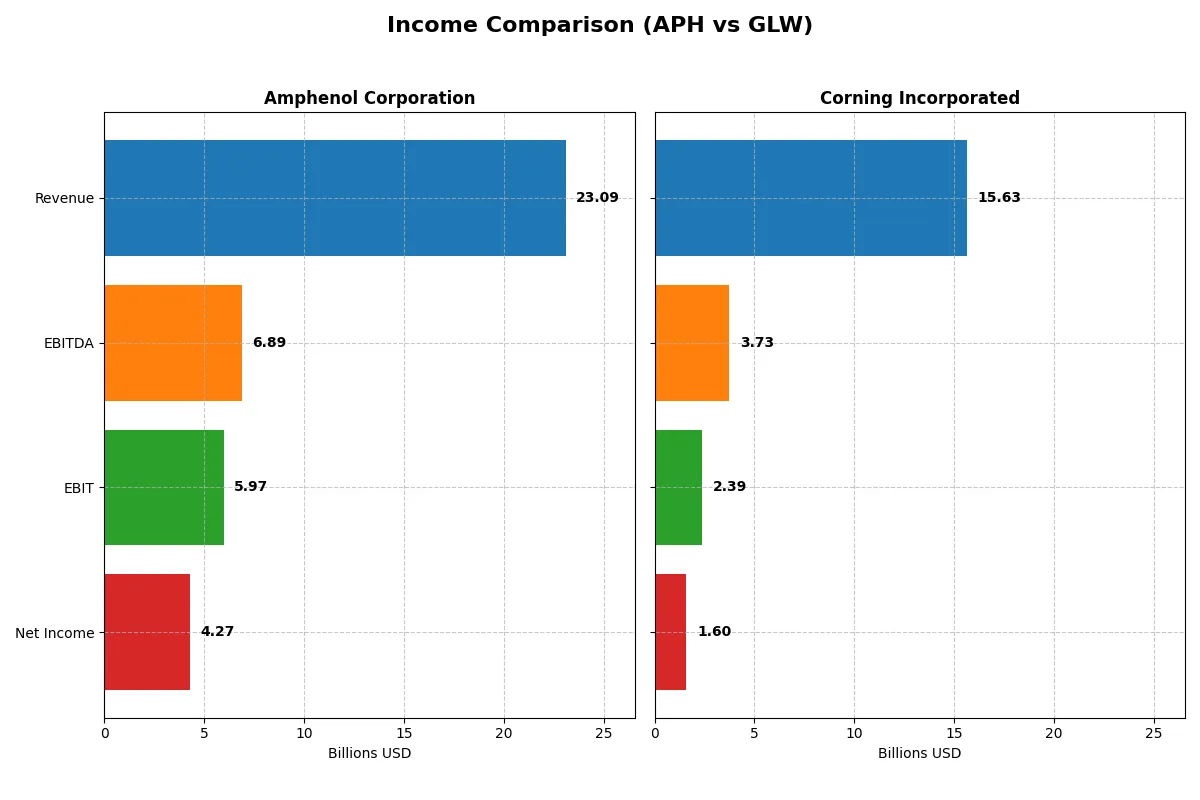
Income Statement Comparison
The following data dissects the core profitability and scalability of both corporate engines to reveal who dominates the bottom line:
| Metric | Amphenol Corporation (APH) | Corning Incorporated (GLW) |
|---|---|---|
| Revenue | 23B | 15.6B |
| Cost of Revenue | 14.6B | 10.1B |
| Operating Expenses | 2.55B | 3.18B |
| Gross Profit | 8.5B | 5.51B |
| EBITDA | 6.89B | 3.74B |
| EBIT | 6B | 2.39B |
| Interest Expense | 368M | 336M |
| Net Income | 4.27B | 1.6B |
| EPS | 3.51 | 1.86 |
| Fiscal Year | 2025 | 2025 |
Income Statement Analysis: The Bottom-Line Duel
The upcoming income statement comparison reveals which company operates with superior efficiency and sustainable profitability over recent years.
Amphenol Corporation Analysis
Amphenol’s revenue surged from $10.9B in 2021 to $23.1B in 2025, nearly doubling over five years. Net income increased even faster, from $1.59B to $4.27B, reflecting expanding margins. Its 2025 gross margin stood at a strong 36.9%, and net margin at 18.5%, signaling excellent cost control and operational leverage. The latest year shows robust momentum with 52% revenue growth and 16% net margin improvement.
Corning Incorporated Analysis
Corning’s revenue rose more modestly, from $14.1B in 2021 to $15.6B in 2025, a 10.99% increase over five years. Net income, however, declined over the period, dropping from $1.91B to $1.60B, causing net margin to compress to 10.2% in 2025. Despite a recent 19% revenue growth and a 165% net margin surge in 2025, overall profitability has weakened, reflecting margin pressure and less efficient capital deployment.
Margin Strength vs. Revenue Growth Scale
Amphenol delivers superior margin expansion and consistent net income growth, doubling revenue with strong operational efficiency. Corning shows respectable revenue stability but suffers from shrinking net margins and declining net income over five years. For investors prioritizing profitability and margin resilience, Amphenol’s profile offers a clearer fundamental advantage.
Financial Ratios Comparison
These vital ratios act as a diagnostic tool to expose the underlying fiscal health, valuation premiums, and capital efficiency of the companies compared below:
| Ratios | Amphenol Corporation (APH) | Corning Incorporated (GLW) |
|---|---|---|
| ROE | 31.8% | 13.5% |
| ROIC | 15.1% | 7.6% |
| P/E | 38.6 | 47.2 |
| P/B | 12.3 | 6.4 |
| Current Ratio | 2.98 | 1.59 |
| Quick Ratio | 2.48 | 1.04 |
| D/E | 1.16 | 0.71 |
| Debt-to-Assets | 42.8% | 27.2% |
| Interest Coverage | 16.2 | 6.9 |
| Asset Turnover | 0.64 | 0.50 |
| Fixed Asset Turnover | 10.0 | 1.05 |
| Payout ratio | 18.8% | 62.6% |
| Dividend yield | 0.49% | 1.33% |
| Fiscal Year | 2025 | 2025 |
Efficiency & Valuation Duel: The Vital Signs
Financial ratios serve as a company’s DNA, exposing hidden risks and shining a light on operational excellence and valuation discipline.
Amphenol Corporation
Amphenol posts a robust 31.8% ROE and a healthy 18.5% net margin, demonstrating strong profitability. The stock trades at a stretched 38.5 P/E and a lofty 12.3 P/B, suggesting premium valuation. Shareholders receive a modest 0.49% dividend yield, reflecting limited payouts amid reinvestment in growth and innovation.
Corning Incorporated
Corning delivers a modest 13.5% ROE and a 10.2% net margin, signaling moderate efficiency. Its valuation is more stretched with a 47.2 P/E but a lower 6.4 P/B. The company offers a 1.33% dividend yield, balancing shareholder returns with continued investment in R&D, supporting future value creation.
Premium Valuation vs. Operational Safety
Amphenol’s superior profitability compensates for its higher valuation, while Corning’s lower profitability comes with a more tempered valuation and higher dividend yield. Investors seeking operational excellence may prefer Amphenol. Those favoring income and moderate risk might lean toward Corning.
Which one offers the Superior Shareholder Reward?
I see Amphenol (APH) delivers modest dividends with a 0.49% yield and a conservative 19% payout ratio, supported by strong free cash flow coverage near 3x. Its buybacks are steady, enhancing shareholder value sustainably. Corning (GLW) pays a higher 1.33% yield but with a hefty 63% payout ratio and weaker FCF coverage around 1.2x, raising sustainability concerns. GLW’s buybacks are less intense, and earnings margins lag APH’s. I conclude APH offers a more attractive total return profile in 2026, balancing income with disciplined capital allocation and durable growth.
Comparative Score Analysis: The Strategic Profile
The radar chart reveals the fundamental DNA and trade-offs of Amphenol Corporation and Corning Incorporated, highlighting their financial strengths and weaknesses:
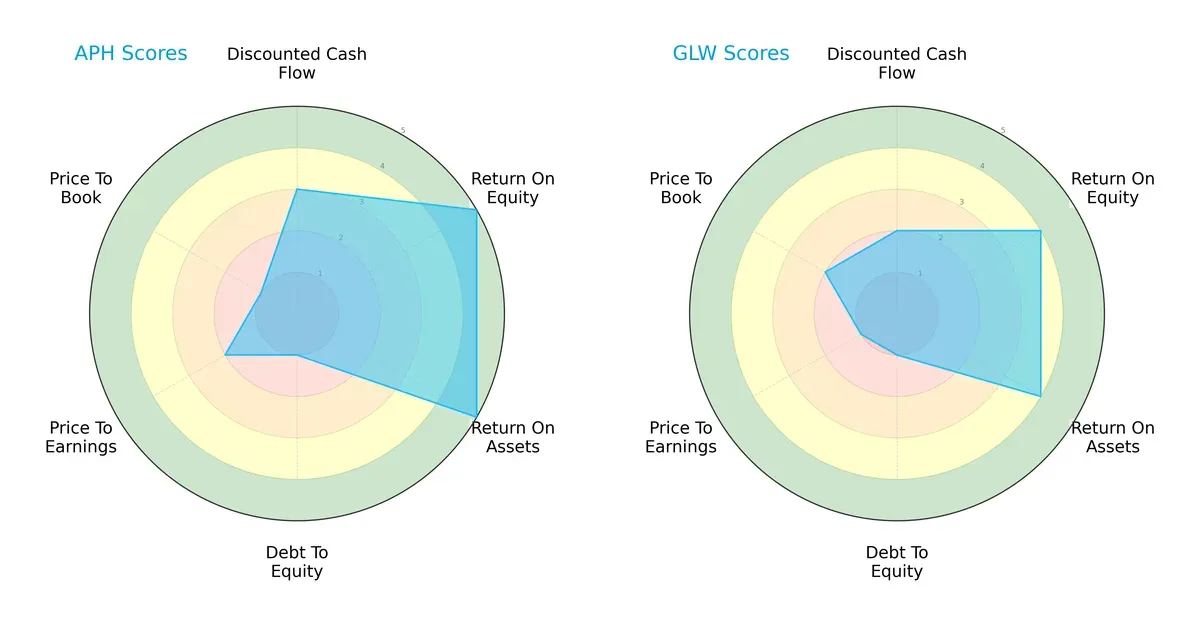
Amphenol shows superior efficiency with higher ROE and ROA scores (5 vs. 4 for Corning). However, both firms share a significant red flag: a very unfavorable debt-to-equity score of 1. Amphenol’s valuation scores (PE and PB) are slightly worse, indicating possible overvaluation risks. Overall, Amphenol presents a more balanced profile driven by operational efficiency, while Corning relies on a narrower margin of strength.
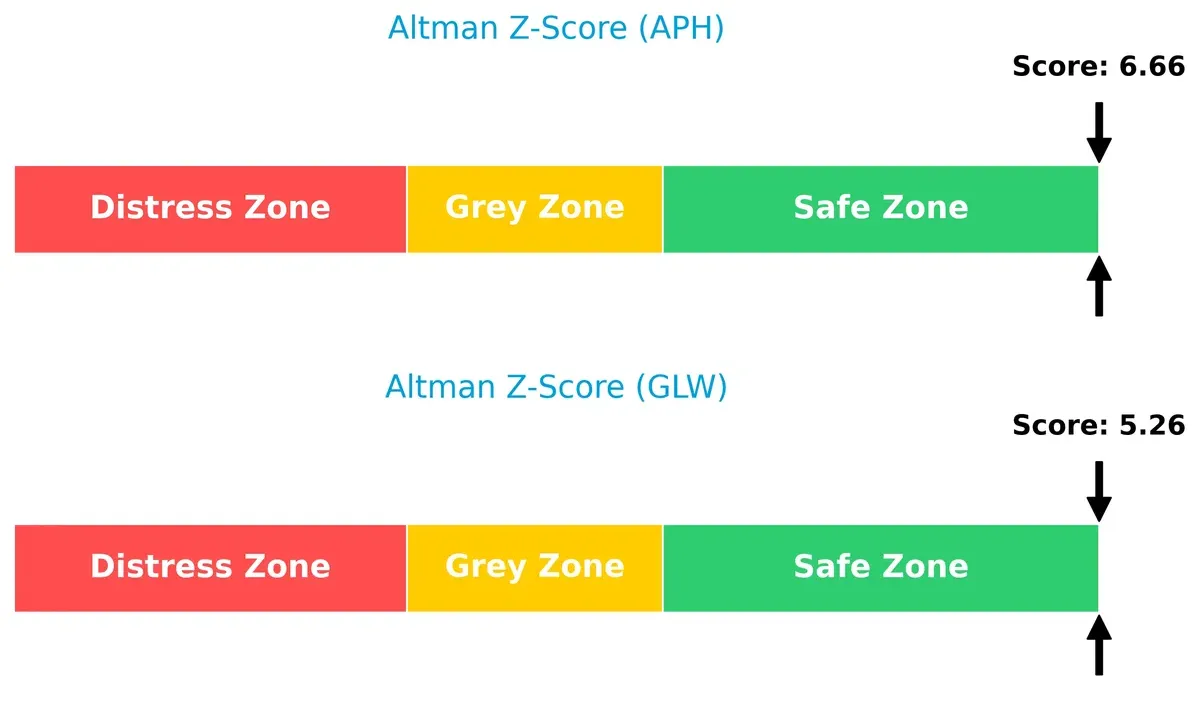
Bankruptcy Risk: Solvency Showdown
Amphenol’s Altman Z-Score of 6.66 surpasses Corning’s 5.26, signaling stronger financial stability and lower bankruptcy risk in this economic cycle:
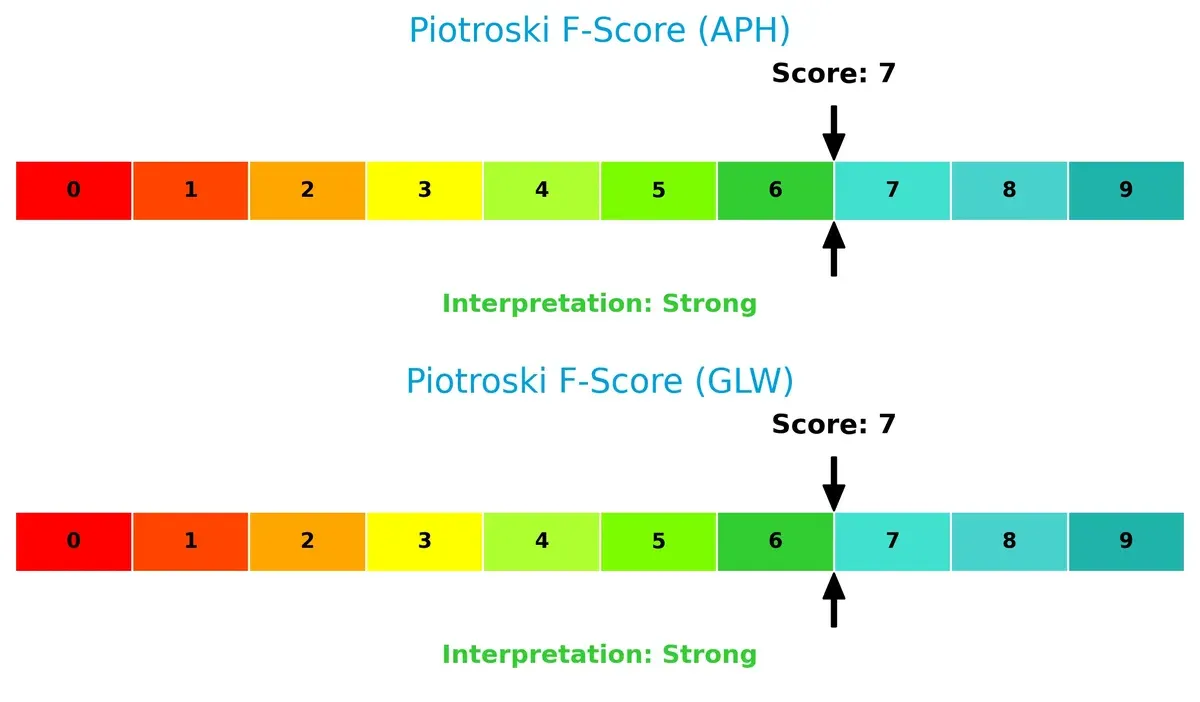
Financial Health: Quality of Operations
Both companies score a strong 7 on the Piotroski F-Score, reflecting robust internal financial health and operational quality with no immediate red flags:
How are the two companies positioned?
This section dissects Amphenol and Corning’s operational DNA by comparing their revenue distribution and internal strengths and weaknesses. The goal is to confront their economic moats to identify which business model delivers the most resilient, sustainable competitive advantage today.
Revenue Segmentation: The Strategic Mix
This comparison dissects how Amphenol Corporation and Corning Incorporated diversify their income streams and where their primary sector bets lie:
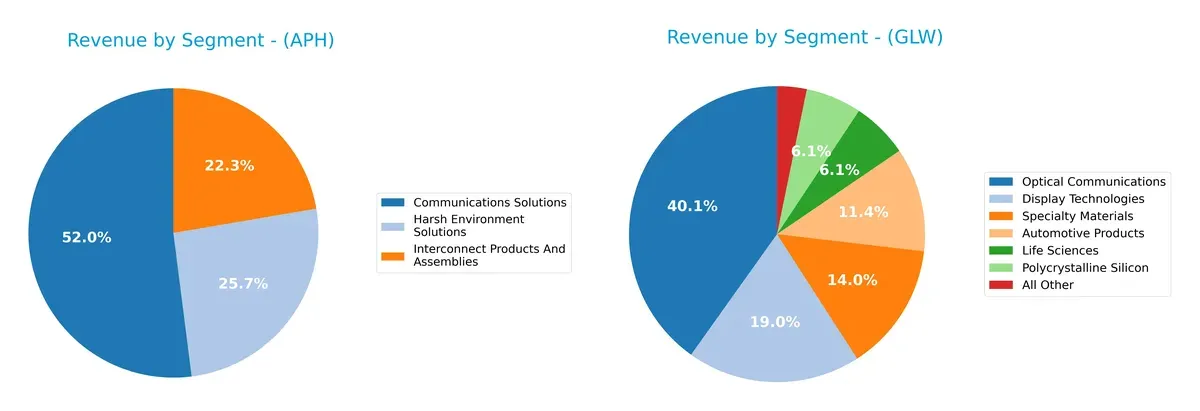
Amphenol anchors its revenue in Communications Solutions at $12.2B, with Harsh Environment ($6B) and Interconnect Products ($5.2B) trailing, showing moderate diversification. Corning leans on Optical Communications, which dwarfs other segments at $6.3B, but also spreads risk across Display Technologies ($3B), Specialty Materials ($2.2B), and others. Amphenol’s focus suggests ecosystem lock-in in connectivity, while Corning’s broader mix mitigates concentration risk through varied technology bets.
Strengths and Weaknesses Comparison
This table compares the strengths and weaknesses of Amphenol Corporation and Corning Incorporated:
Amphenol Corporation Strengths
- Diverse product segments including Communications and Harsh Environment Solutions
- Favorable profitability with 18.5% net margin and 31.8% ROE
- Strong liquidity ratios with current ratio near 3.0
- High fixed asset turnover indicating efficient use of assets
Corning Incorporated Strengths
- Broad business diversification across Optical Communications, Specialty Materials, and Display Technologies
- Favorable net margin of 10.2% with stable interest coverage
- Lower debt-to-assets ratio at 27.2% improves financial stability
- Global presence with strong revenue from Asia Pacific and North America
Amphenol Corporation Weaknesses
- High valuation multiples with P/E at 38.6 and P/B at 12.3 may limit upside
- Elevated debt-to-equity ratio of 1.16 signals higher leverage risk
- Dividend yield under 0.5% is low for income investors
- Neutral asset turnover suggests room for operational improvement
Corning Incorporated Weaknesses
- Elevated P/E ratio of 47.2 and P/B at 6.4 imply premium pricing
- Moderate returns with neutral ROIC at 7.6% versus WACC
- Lower ROE at 13.5% indicates less profitability than peers
- Quick ratio barely above 1.0 may constrain short-term liquidity
Both companies exhibit solid diversification and favorable profitability, but Amphenol shows stronger returns and liquidity. Corning benefits from a broad global footprint and lower leverage but faces valuation and efficiency challenges. These profiles affect strategic priorities such as capital allocation and growth investments.
The Moat Duel: Analyzing Competitive Defensibility
A structural moat is the only thing protecting long-term profits from the erosion of competition. Here is how Amphenol and Corning defend their turf:
Amphenol Corporation: Robust Switching Costs and Diverse Product Ecosystem
Amphenol’s moat stems from high switching costs and a broad product portfolio. Its 6.3% ROIC advantage over WACC confirms efficient capital use and margin stability. Expansion in harsh environment and sensor markets could deepen this moat by 2026.
Corning Incorporated: Innovation-Driven Intangible Assets
Corning’s competitive edge lies in its cutting-edge specialty materials and optical technologies. Despite a negative ROIC spread, growing profitability signals improving efficiency. Its leadership in display and life sciences segments offers avenues for market disruption.
Verdict: Switching Costs vs. Intangible Innovation
Amphenol holds a wider and deeper moat with sustained value creation and stable margins. Corning’s rising ROIC trend is promising but still trails in capital efficiency. Amphenol is better positioned to defend market share through entrenched customer relationships and product breadth.
Which stock offers better returns?
The past year reveals strong bullish momentum in both stocks, with Corning showing sharper gains and more pronounced buyer dominance in recent trading.
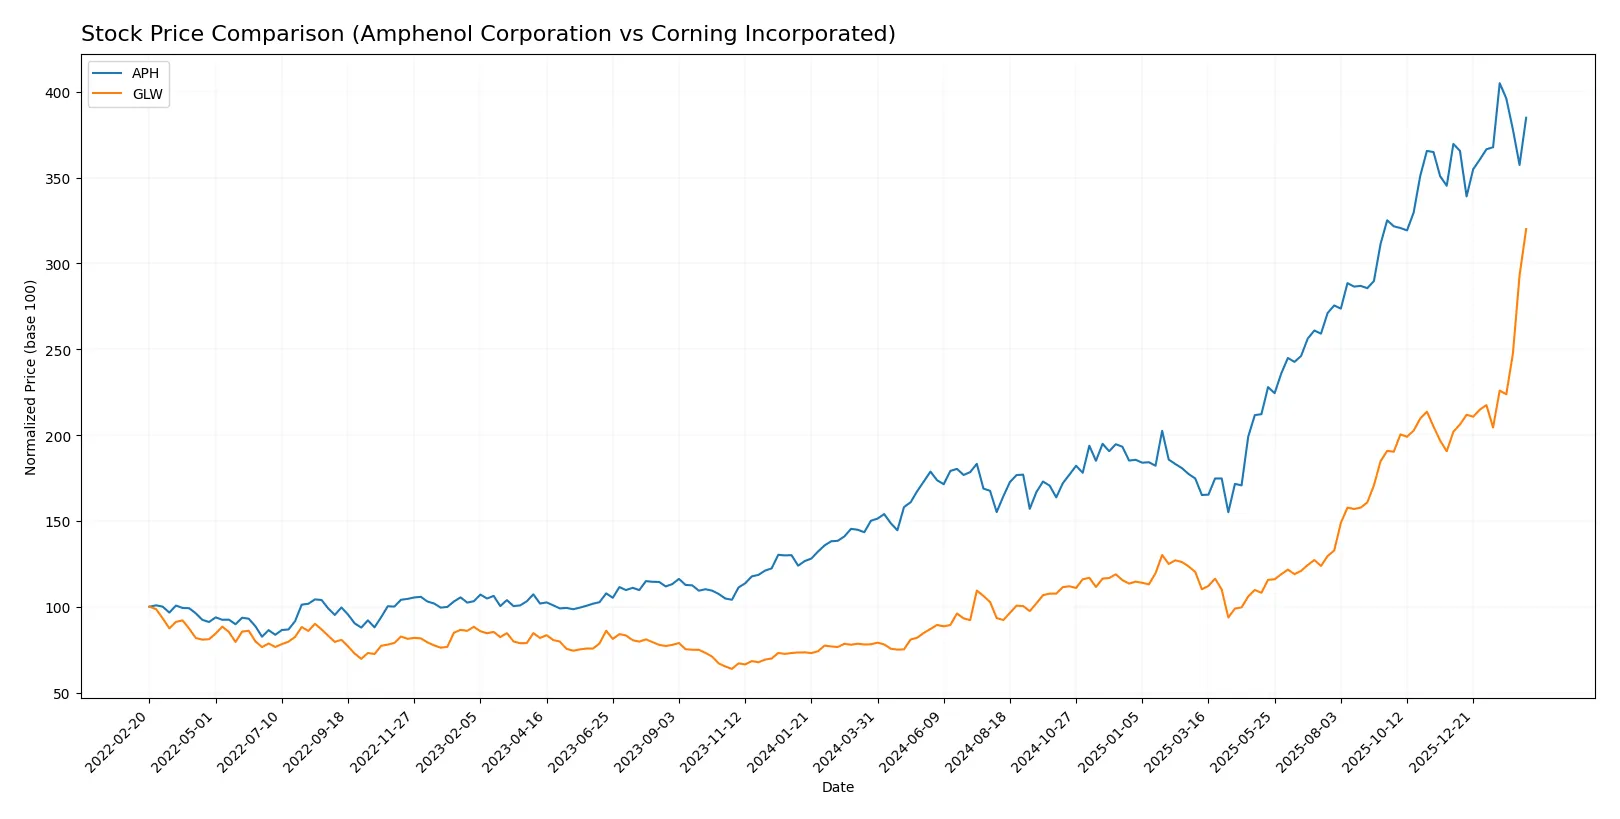
Trend Comparison
Amphenol’s stock rose 156.46% over the past year, signaling a bullish trend with accelerating momentum. It showed a wide price range between 55.09 and 154.39 and moderate volatility at 29.17.
Corning’s stock surged 309.76% over the same period, also bullish with acceleration. It traded between 31.27 and 133.46, exhibiting lower volatility at 20.87, and a stronger recent upward slope.
Corning’s stock outperformed Amphenol, delivering the highest market returns and stronger buyer dominance, especially in the recent three-month period ending February 2026.
Target Prices
Analysts present a clear consensus on target prices for Amphenol Corporation and Corning Incorporated.
| Company | Target Low | Target High | Consensus |
|---|---|---|---|
| Amphenol Corporation | 139 | 210 | 174.13 |
| Corning Incorporated | 100 | 135 | 118.67 |
The target consensus for Amphenol at $174.13 suggests upside potential from the current $146.72 price. Corning’s consensus at $118.67 is slightly below its current $133.46, indicating a cautious outlook.

Don’t Let Luck Decide Your Entry Point
Optimize your entry points with our advanced ProRealTime indicators. You’ll get efficient buy signals with precise price targets for maximum performance. Start outperforming now!
How do institutions grade them?
I present the recent grades assigned by notable financial institutions for Amphenol Corporation and Corning Incorporated:
Amphenol Corporation Grades
The following table summarizes recent grades from reputable financial firms for Amphenol Corporation:
| Grading Company | Action | New Grade | Date |
|---|---|---|---|
| Citigroup | Maintain | Buy | 2026-01-29 |
| Barclays | Maintain | Overweight | 2026-01-29 |
| JP Morgan | Maintain | Overweight | 2026-01-27 |
| UBS | Maintain | Buy | 2026-01-14 |
| Citigroup | Maintain | Buy | 2026-01-12 |
| Barclays | Upgrade | Overweight | 2026-01-12 |
| Truist Securities | Maintain | Buy | 2025-12-19 |
| Barclays | Maintain | Equal Weight | 2025-11-13 |
| Truist Securities | Maintain | Buy | 2025-10-23 |
| Citigroup | Maintain | Buy | 2025-10-23 |
Corning Incorporated Grades
Below are the latest grades issued by established institutions for Corning Incorporated:
| Grading Company | Action | New Grade | Date |
|---|---|---|---|
| Morgan Stanley | Maintain | Equal Weight | 2026-01-29 |
| Mizuho | Maintain | Outperform | 2026-01-29 |
| Citigroup | Maintain | Buy | 2026-01-29 |
| Susquehanna | Maintain | Positive | 2026-01-29 |
| JP Morgan | Maintain | Overweight | 2026-01-28 |
| Citigroup | Maintain | Buy | 2026-01-12 |
| Morgan Stanley | Maintain | Equal Weight | 2025-12-17 |
| UBS | Maintain | Buy | 2025-11-21 |
| UBS | Maintain | Buy | 2025-10-29 |
| Susquehanna | Maintain | Positive | 2025-10-29 |
Which company has the best grades?
Both companies receive strong institutional support, but Amphenol’s consistent “Buy” and “Overweight” grades slightly outpace Corning’s mixture of “Buy,” “Outperform,” and “Equal Weight.” This consistency signals robust confidence in Amphenol, potentially attracting more investor interest and stability.
Risks specific to each company
The following categories identify the critical pressure points and systemic threats facing both firms in the 2026 market environment:
1. Market & Competition
Amphenol Corporation
- Faces intense competition in electronic connectors; innovation and diversification are key to maintaining leadership.
Corning Incorporated
- Competes in diverse segments; display technologies face rapid innovation cycles and pricing pressure.
2. Capital Structure & Debt
Amphenol Corporation
- High debt-to-equity ratio (1.16) signals elevated leverage risk despite strong interest coverage.
Corning Incorporated
- More conservative leverage (0.71 debt-to-equity) reduces financial risk and supports stability.
3. Stock Volatility
Amphenol Corporation
- Beta of 1.21 suggests moderately higher volatility than the market, reflecting sensitivity to sector cycles.
Corning Incorporated
- Slightly lower beta at 1.124 indicates somewhat less stock price volatility amid market shifts.
4. Regulatory & Legal
Amphenol Corporation
- Regulatory exposure primarily in global manufacturing and export controls; risk from evolving trade policies.
Corning Incorporated
- Faces regulatory scrutiny in environmental technologies and product safety; compliance costs may rise.
5. Supply Chain & Operations
Amphenol Corporation
- Complex global supply chains for connectors and sensors; susceptible to raw material and logistic disruptions.
Corning Incorporated
- Supply chain risks from specialty materials and optical components; relies on precision manufacturing processes.
6. ESG & Climate Transition
Amphenol Corporation
- ESG initiatives advancing but must address emissions in manufacturing and product lifecycle management.
Corning Incorporated
- Strong focus on environmental tech; climate transition offers growth but also regulatory compliance costs.
7. Geopolitical Exposure
Amphenol Corporation
- Significant international sales, including China; geopolitical tensions may impact market access and costs.
Corning Incorporated
- Also exposed to global markets; trade tensions and tariffs could disrupt revenue streams and supply chains.
Which company shows a better risk-adjusted profile?
Amphenol’s highest risk lies in its elevated leverage, raising financial vulnerability despite robust operational metrics. Corning’s most pressing risk is market cyclicality and innovation pace in display technologies. Both show slightly favorable overall financial health, but Corning’s lower debt and stable cash flows tip the scale. Notably, Amphenol’s debt-to-equity ratio above 1.0 contrasts with Corning’s conservative 0.71, justifying caution on leverage risk for Amphenol investors.
Final Verdict: Which stock to choose?
Amphenol Corporation’s superpower lies in its exceptional capital efficiency and strong value creation, consistently outpacing its cost of capital. Its point of vigilance is the elevated debt-to-equity ratio, which could constrain flexibility. Amphenol fits well within aggressive growth portfolios seeking robust profitability and expanding returns.
Corning Incorporated offers a strategic moat through its entrenched market presence and steady innovation pipeline, underpinning recurring revenue streams. It presents a safer profile than Amphenol, with lower leverage and a solid balance sheet, appealing to investors favoring growth at a reasonable price with moderate risk exposure.
If you prioritize aggressive growth backed by sustained value creation, Amphenol outshines with superior profitability and expanding returns on invested capital. However, if you seek better stability and a more conservative risk profile, Corning offers that safety net while still delivering growth potential, though at a premium valuation. Each presents a compelling scenario tailored to distinct investor appetites.
Disclaimer: Investment carries a risk of loss of initial capital. The past performance is not a reliable indicator of future results. Be sure to understand risks before making an investment decision.
Go Further
I encourage you to read the complete analyses of Amphenol Corporation and Corning Incorporated to enhance your investment decisions: