Home > Comparison > Technology > APH vs COHR
The strategic rivalry between Amphenol Corporation and Coherent, Inc. shapes the evolution of the hardware, equipment, and parts industry. Amphenol stands as a capital-intensive manufacturing powerhouse with a broad portfolio of connectors and sensor systems. Coherent, by contrast, focuses on high-tech laser solutions and precision optics, targeting specialized industrial and scientific markets. This analysis will assess which company’s operational model delivers superior risk-adjusted returns for a diversified portfolio in today’s technology landscape.
Table of contents
Companies Overview
Two leaders shape the hardware and equipment sector with distinct technological fortes and market footprints.
Amphenol Corporation: Connector and Sensor Systems Powerhouse
Amphenol Corporation dominates the electrical and fiber optic connectors market, generating revenue by designing and manufacturing connectors, cable assemblies, and sensors. Its 2026 strategy centers on expanding harsh environment solutions and communication systems. Amphenol serves diverse sectors, from automotive to aerospace, leveraging a broad product portfolio and a global sales network to maintain its competitive advantage.
Coherent, Inc.: Laser Technology Innovator
Coherent, Inc. specializes in laser-based technologies and system solutions for industrial and scientific uses. It generates revenue through OEM laser sources and industrial laser systems. In 2026, Coherent focuses on enhancing precision optics and laser measurement products. As a subsidiary of II-VI Incorporated, the company leverages its advanced laser capabilities to serve microelectronics, materials processing, and research sectors.
Strategic Collision: Similarities & Divergences
Both companies operate in hardware and equipment but differ fundamentally: Amphenol emphasizes broad interconnect systems, while Coherent excels in specialized laser technology. Their primary battleground is high-tech industrial applications, where precision and reliability are critical. Amphenol offers scale and diversification, Coherent presents niche innovation, defining their distinct investment profiles in a competitive technology landscape.
Income Statement Comparison
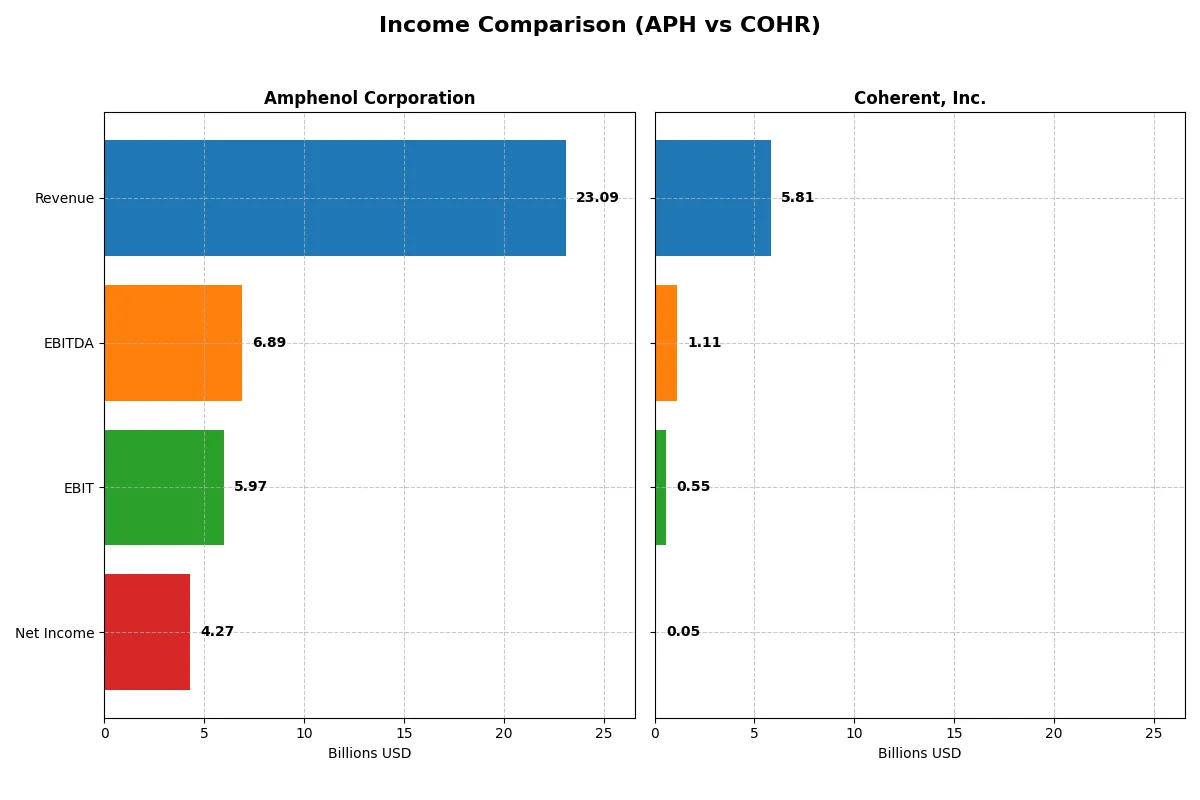
This data dissects the core profitability and scalability of both corporate engines to reveal who dominates the bottom line:
| Metric | Amphenol Corporation (APH) | Coherent, Inc. (COHR) |
|---|---|---|
| Revenue | 23.1B | 5.81B |
| Cost of Revenue | 14.6B | 3.75B |
| Operating Expenses | 2.55B | 1.51B |
| Gross Profit | 8.52B | 2.06B |
| EBITDA | 6.89B | 1.11B |
| EBIT | 5.97B | 552M |
| Interest Expense | 368M | 243M |
| Net Income | 4.27B | -81M |
| EPS | 3.51 | -0.52 |
| Fiscal Year | 2025 | 2025 |
Income Statement Analysis: The Bottom-Line Duel
This income statement comparison reveals which company drives efficiency and profitability most effectively through its corporate engine.
Amphenol Corporation Analysis
Amphenol’s revenue grew robustly from $10.9B in 2021 to $23.1B in 2025, nearly doubling over five years. Net income climbed from $1.59B to $4.27B, reflecting strong momentum. Gross margin stands healthy at 36.9%, with a net margin of 18.5%, showcasing efficient cost control and sustained profitability in 2025.
Coherent, Inc. Analysis
Coherent’s revenue rose from $3.11B in 2021 to $5.81B in 2025, a solid 87% increase overall. However, net income turned sharply negative, dropping from $297M to -$81M by 2025. Its gross margin remains favorable at 35.4%, but net margin hovers near zero at 0.85%, signalling pressure on bottom-line efficiency despite recent operational improvements.
Margin Leadership vs. Revenue Expansion
Amphenol clearly leads with superior net margins and consistent profit growth, doubling revenue while tripling net income over five years. Coherent shows respectable top-line growth but suffers from steep net income declines and volatile margins. For investors, Amphenol’s profile offers a more stable, efficient earnings engine aligned with long-term value creation.
Financial Ratios Comparison
These vital ratios act as a diagnostic tool to expose the underlying fiscal health, valuation premiums, and capital efficiency of the companies compared below:
| Ratios | Amphenol Corporation (APH) | Coherent, Inc. (COHR) |
|---|---|---|
| ROE | 24.75% | 0.61% |
| ROIC | 14.90% | 1.31% |
| P/E | 34.49 | 279.75 |
| P/B | 8.54 | 1.70 |
| Current Ratio | 2.37 | 2.19 |
| Quick Ratio | 1.75 | 1.39 |
| D/E | 0.74 | 0.48 |
| Debt-to-Assets | 33.96% | 26.11% |
| Interest Coverage | 15.14 | 2.26 |
| Asset Turnover | 0.71 | 0.39 |
| Fixed Asset Turnover | 7.26 | 3.09 |
| Payout ratio | 24.55% | 23.17% |
| Dividend yield | 0.71% | 0.08% |
| Fiscal Year | 2024 | 2025 |
Efficiency & Valuation Duel: The Vital Signs
Financial ratios serve as a company’s DNA, unveiling operational strengths and hidden risks that shape investor decisions.
Amphenol Corporation
Amphenol exhibits strong profitability with a 24.75% ROE and a solid 15.92% net margin, signaling efficient operations. However, its valuation appears stretched, with a high P/E of 34.49 and P/B at 8.54. The company returns value modestly through a low 0.71% dividend yield, focusing on reinvestment in R&D for growth.
Coherent, Inc.
Coherent struggles with profitability, showing a weak 0.61% ROE and a 0.85% net margin, indicating operational challenges. Its valuation is extremely stretched, with a P/E soaring to 279.75, despite a reasonable P/B of 1.7. The minimal dividend yield of 0.08% reflects limited shareholder returns, with heavy reinvestment in R&D aimed at turnaround.
Premium Valuation vs. Operational Safety
Amphenol offers a better balance of profitability and operational efficiency despite a premium valuation. Coherent’s stretched multiples and poor returns signal higher risk. Investors seeking operational safety might prefer Amphenol’s profile, while risk-tolerant investors might consider Coherent’s growth potential.
Which one offers the Superior Shareholder Reward?
Amphenol (APH) delivers a more attractive shareholder reward than Coherent (COHR) in 2026. APH pays a consistent dividend yield around 0.7–1.0%, supported by a sustainable payout ratio near 25%, backed by strong free cash flow coverage above 75%. It also aggressively repurchases shares, enhancing total return. COHR’s dividend yield is negligible, with erratic payouts and weak free cash flow conversion under 40%, signaling limited income return. Its reinvestment focuses on capex and growth amid inconsistent profitability, which raises risk. APH’s balanced dividend and buyback approach offers a more reliable, long-term value proposition compared to COHR’s growth-risk model.
Comparative Score Analysis: The Strategic Profile
The radar chart reveals the fundamental DNA and trade-offs of Amphenol Corporation and Coherent, Inc., highlighting their financial strengths and vulnerabilities:
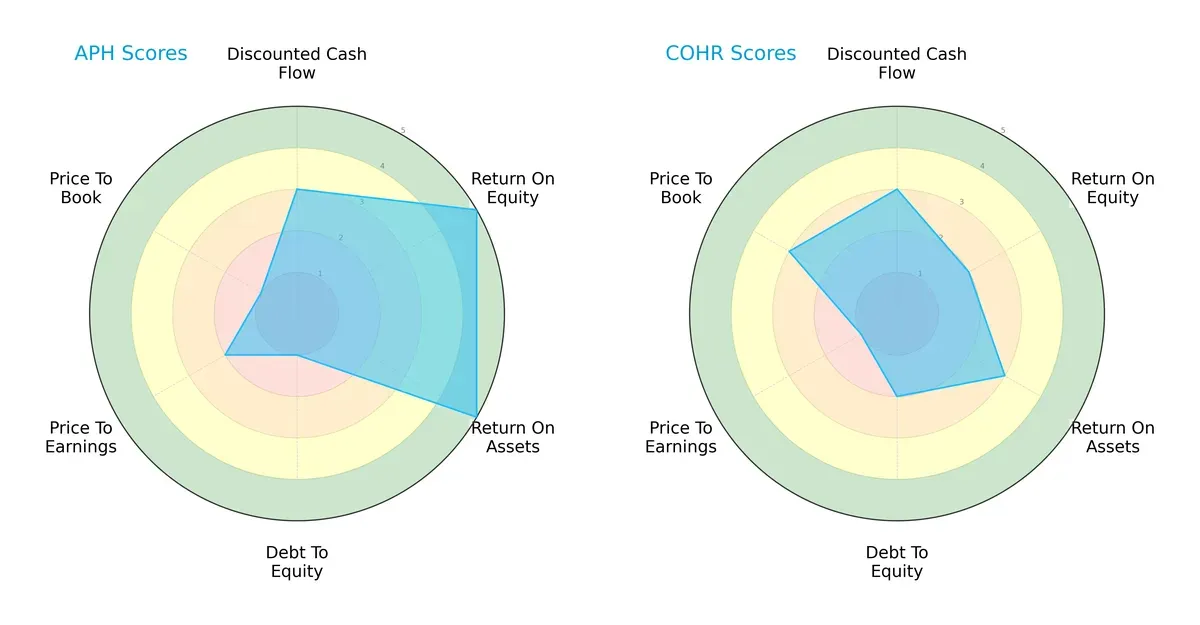
Amphenol excels in Return on Equity (5) and Return on Assets (5), showcasing operational efficiency. However, it carries significant debt risk (Debt/Equity score 1) and unfavorable valuation metrics (P/B score 1). Coherent presents a more balanced debt profile (2) and better Price-to-Book valuation (3) but lags in profitability scores (ROE 2, ROA 3). Amphenol relies on strong operational performance, while Coherent offers a steadier capital structure.
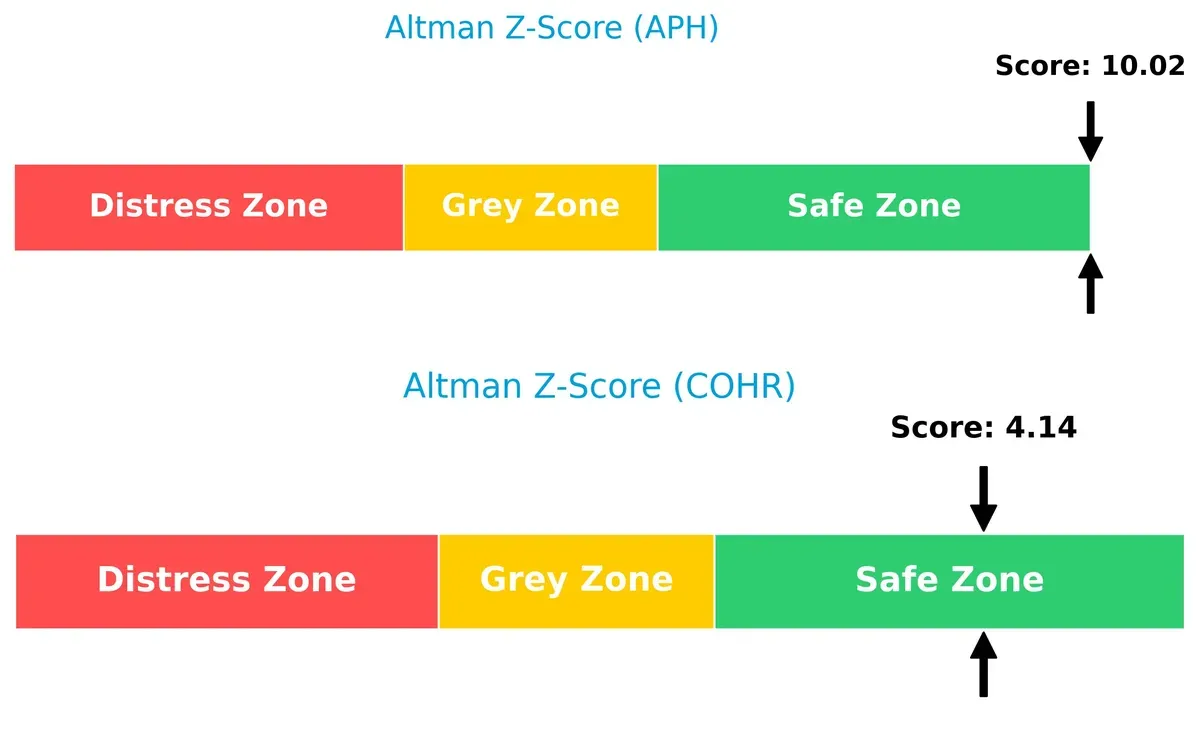
Bankruptcy Risk: Solvency Showdown
Amphenol’s Altman Z-Score (10.02) far exceeds Coherent’s (4.14), indicating superior solvency and a much lower bankruptcy risk in this cycle:
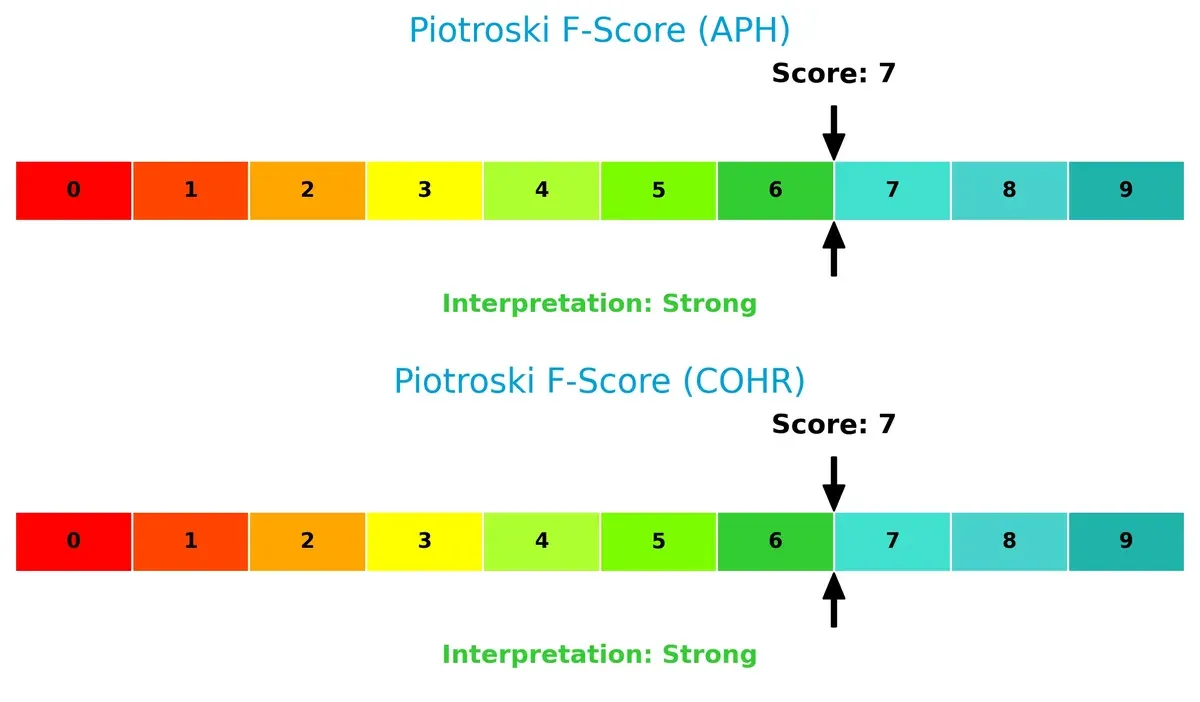
Financial Health: Quality of Operations
Both companies score a strong 7 on the Piotroski F-Score, reflecting solid financial health with no clear red flags in internal metrics:
How are the two companies positioned?
This section dissects the operational DNA of Amphenol and Coherent by comparing their revenue distribution and internal dynamics. The goal is to confront their economic moats to identify which model offers the most resilient, sustainable advantage today.
Revenue Segmentation: The Strategic Mix
This visual comparison dissects how Amphenol Corporation and Coherent, Inc. diversify their income streams and where their primary sector bets lie:
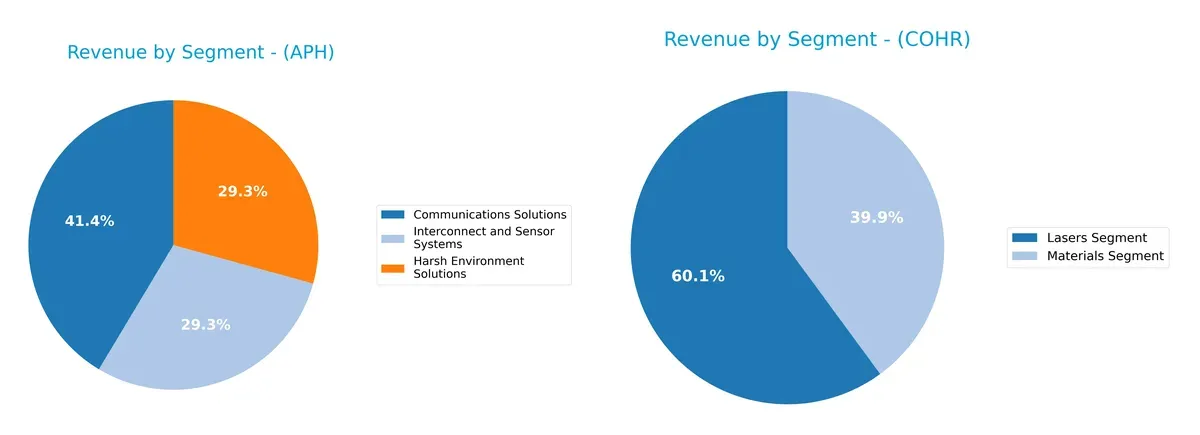
Amphenol leans on a balanced mix, with Communications Solutions at $6.38B, closely matched by Harsh Environment and Interconnect segments near $4.5B each. This diversification reduces concentration risk and signals strength across industrial ecosystems. In contrast, Coherent pivots mainly on its Lasers Segment, $1.43B, which dwarfs its Materials segment at $954M, indicating higher dependency on a niche technology market and potential volatility versus Amphenol’s broad infrastructure reach.
Strengths and Weaknesses Comparison
This table compares the strengths and weaknesses of Amphenol Corporation and Coherent, Inc.:
Amphenol Corporation Strengths
- Diversified product segments generating $6.4B, $4.5B, and $4.5B revenues
- Strong profitability with 15.9% net margin and 24.8% ROE
- Solid liquidity with current ratio 2.37 and quick ratio 1.75
- Favorable fixed asset turnover at 7.26
- Global presence across US, China, and other foreign locations with multi-billion revenues
Coherent, Inc. Strengths
- Favorable debt metrics with D/E 0.48 and debt-to-assets 26%
- Positive liquidity with current ratio 2.19 and quick ratio 1.39
- Favorable fixed asset turnover at 3.09
- Global presence with $3.6B North America and significant Asia and Europe sales
Amphenol Corporation Weaknesses
- High valuation multiples with P/E 34.5 and P/B 8.54
- Moderate leverage with D/E 0.74 and debt-to-assets 34% neutral
- Dividend yield low at 0.71%
- Asset turnover moderate at 0.71
- WACC neutral at 9.0%
Coherent, Inc. Weaknesses
- Weak profitability with net margin 0.85%, ROE 0.61%, and ROIC 1.3%
- High WACC at 11.65% and very high P/E 280
- Low dividend yield at 0.08%
- Unfavorable asset turnover at 0.39
- Interest coverage low at 2.27
Amphenol’s strengths lie in its diverse revenue streams, strong profitability, and robust liquidity, offset by valuation and leverage concerns. Coherent shows solid balance sheet metrics but suffers from weak profitability and high valuation, indicating challenges in operational efficiency and cost of capital.
The Moat Duel: Analyzing Competitive Defensibility
A structural moat is the only reliable shield protecting long-term profits from relentless competitive erosion. Here’s how Amphenol and Coherent stack up:
Amphenol Corporation: Durable Cost and Intangible Asset Moat
Amphenol’s moat stems from a blend of cost advantages and strong intangible assets like proprietary connector technology. Its ROIC exceeds WACC by nearly 6%, signaling efficient capital use and robust margin stability. Expansion into harsh environment and fiber optic markets in 2026 should fortify this moat further.
Coherent, Inc.: Specialized Technology Moat Under Pressure
Coherent’s moat relies on specialized laser technology, but unlike Amphenol, it struggles with declining ROIC and negative value creation. Despite recent revenue growth and EBIT improvement, profitability erosion signals a weak competitive position. New laser applications offer growth, but sustaining a moat is uncertain.
Cost Efficiency vs. Technological Edge: Who Defends Better?
Amphenol’s wider moat combines cost leadership and intangible assets, delivering durable value creation and profit growth. Coherent’s technological moat is narrower and weakening, risking market share loss. I see Amphenol as better equipped to defend and expand its competitive ground in 2026.
Which stock offers better returns?
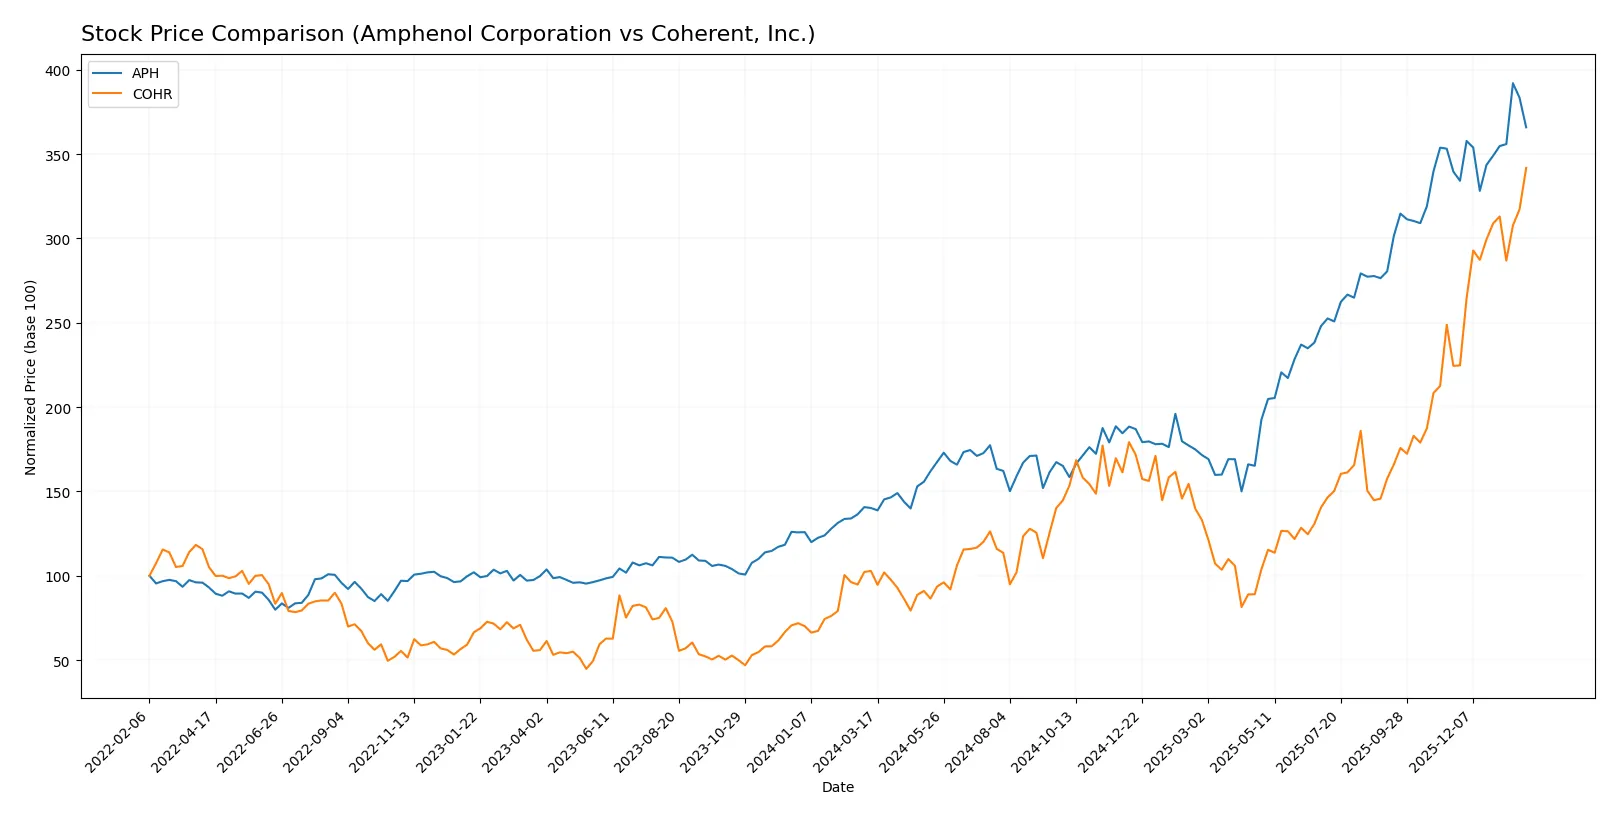
Over the past 12 months, both stocks showed strong gains with distinct acceleration patterns and varying recent trading dynamics, highlighting contrasting momentum and buyer dominance.
Trend Comparison
Amphenol Corporation’s stock price surged 161% over the last year, showing a bullish trend with accelerating momentum. Its price ranged between 54.65 and 154.39, with a recent 7.7% gain under slight seller dominance.
Coherent, Inc. gained 232% over the same period, also bullish with acceleration. Its price fluctuated from 49.26 to 212.18. Recently, it rose 52.3% with strong buyer dominance and higher volatility.
Coherent’s stock outperformed Amphenol’s overall and recently, reflecting stronger momentum and more decisive buyer control in the latest months.
Target Prices
Analysts present a bullish consensus for both Amphenol Corporation and Coherent, Inc.
| Company | Target Low | Target High | Consensus |
|---|---|---|---|
| Amphenol Corporation | 139 | 210 | 174.13 |
| Coherent, Inc. | 190 | 235 | 210 |
The target consensus for Amphenol suggests a 21% upside from the current price of $144.08. Coherent’s consensus target at $210 is slightly below its current price of $212.18, indicating limited near-term upside.

Don’t Let Luck Decide Your Entry Point
Optimize your entry points with our advanced ProRealTime indicators. You’ll get efficient buy signals with precise price targets for maximum performance. Start outperforming now!
How do institutions grade them?
Amphenol Corporation Grades
The following table summarizes recent grades from major financial institutions for Amphenol Corporation:
| Grading Company | Action | New Grade | Date |
|---|---|---|---|
| Citigroup | Maintain | Buy | 2026-01-29 |
| Barclays | Maintain | Overweight | 2026-01-29 |
| JP Morgan | Maintain | Overweight | 2026-01-27 |
| UBS | Maintain | Buy | 2026-01-14 |
| Citigroup | Maintain | Buy | 2026-01-12 |
| Barclays | Upgrade | Overweight | 2026-01-12 |
| Truist Securities | Maintain | Buy | 2025-12-19 |
| Barclays | Maintain | Equal Weight | 2025-11-13 |
| Citigroup | Maintain | Buy | 2025-10-23 |
| Truist Securities | Maintain | Buy | 2025-10-23 |
Coherent, Inc. Grades
The following table summarizes recent grades from major financial institutions for Coherent, Inc.:
| Grading Company | Action | New Grade | Date |
|---|---|---|---|
| Morgan Stanley | Maintain | Equal Weight | 2026-01-30 |
| Citigroup | Maintain | Buy | 2026-01-26 |
| Susquehanna | Maintain | Positive | 2026-01-22 |
| Stifel | Maintain | Buy | 2026-01-22 |
| Barclays | Maintain | Overweight | 2026-01-15 |
| Morgan Stanley | Maintain | Equal Weight | 2025-12-17 |
| JP Morgan | Maintain | Overweight | 2025-12-05 |
| Barclays | Maintain | Overweight | 2025-11-07 |
| Needham | Maintain | Buy | 2025-11-06 |
| Morgan Stanley | Maintain | Equal Weight | 2025-11-06 |
Which company has the best grades?
Amphenol Corporation consistently receives Buy and Overweight grades, showing strong institutional confidence. Coherent, Inc. has a mix of Buy, Overweight, and Equal Weight ratings. Amphenol’s higher frequency of Buy ratings may signal stronger market sentiment, potentially influencing investor preference for stability.
Risks specific to each company
The following categories identify the critical pressure points and systemic threats facing both firms in the 2026 market environment:
1. Market & Competition
Amphenol Corporation
- Operates in a broad hardware and connector market with strong global presence and diversified segments.
Coherent, Inc.
- Focuses on laser technologies with niche industrial and scientific applications, facing intense innovation pressure.
2. Capital Structure & Debt
Amphenol Corporation
- Moderate debt-to-equity ratio of 0.74; interest coverage strong at 16.23, indicating manageable debt risk.
Coherent, Inc.
- Lower debt-to-equity ratio at 0.48 but interest coverage weaker at 2.27, signaling higher risk if cash flows falter.
3. Stock Volatility
Amphenol Corporation
- Beta of 1.214 suggests moderate sensitivity to market swings; more stable than COHR.
Coherent, Inc.
- Higher beta at 1.835 points to pronounced stock price volatility and sensitivity to market shocks.
4. Regulatory & Legal
Amphenol Corporation
- Operates globally with diverse regulations but in a relatively stable hardware sector.
Coherent, Inc.
- Faces stricter regulatory scrutiny on laser safety and export controls, increasing compliance costs.
5. Supply Chain & Operations
Amphenol Corporation
- Benefits from extensive manufacturing footprint and established distribution networks.
Coherent, Inc.
- More vulnerable to supply chain disruptions due to specialized components and reliance on precision manufacturing.
6. ESG & Climate Transition
Amphenol Corporation
- Larger scale provides leverage to invest in ESG initiatives; pressure to meet broad sustainability standards.
Coherent, Inc.
- Smaller scale limits ESG spending but industry demand for energy-efficient products creates both opportunity and risk.
7. Geopolitical Exposure
Amphenol Corporation
- Significant international sales expose it to trade tensions and currency risks globally.
Coherent, Inc.
- Less diversified geographically, with concentration in U.S. and allied markets, reducing geopolitical risk but limiting growth.
Which company shows a better risk-adjusted profile?
Amphenol’s strongest risk is geopolitical exposure due to its vast international footprint, while Coherent struggles with market volatility and regulatory pressure. Amphenol’s robust debt coverage and diversified operations provide a better risk-adjusted profile. Coherent’s high beta and weak profitability metrics heighten its risk, despite lower leverage. The stable Altman Z-Score and strong Piotroski Score for Amphenol underscore its superior financial resilience in 2026’s uncertain environment.
Final Verdict: Which stock to choose?
Amphenol Corporation’s superpower lies in its robust capital efficiency and consistent value creation. It commands a durable moat with steadily growing ROIC well above cost of capital. A point of vigilance is its premium valuation metrics, which may temper upside. It suits portfolios targeting aggressive growth with strong fundamentals.
Coherent, Inc. leverages a strategic moat centered on innovation-driven R&D and niche market positioning, though it currently struggles to translate this into profitability. Its lower leverage and moderate valuation suggest a safer risk profile compared to Amphenol. It fits well within GARP portfolios seeking growth tempered by reasonable financial discipline.
If you prioritize durable competitive advantage and proven value creation, Amphenol outshines due to its strong profitability and capital allocation. However, if you seek growth exposure with a more conservative balance sheet, Coherent offers better stability despite profitability challenges. Both present distinct analytical scenarios for different investor risk appetites.
Disclaimer: Investment carries a risk of loss of initial capital. The past performance is not a reliable indicator of future results. Be sure to understand risks before making an investment decision.
Go Further
I encourage you to read the complete analyses of Amphenol Corporation and Coherent, Inc. to enhance your investment decisions: