Home > Comparison > Technology > APH vs CGNX
The strategic rivalry between Amphenol Corporation and Cognex Corporation shapes the future of the Technology sector’s hardware and equipment industry. Amphenol operates as a diversified, capital-intensive connector and sensor manufacturer with a global footprint. Cognex, by contrast, specializes in high-margin machine vision systems that automate manufacturing processes. This analysis will evaluate which company offers a superior risk-adjusted return, balancing scale and innovation for a diversified portfolio in 2026.
Table of contents
Companies Overview
Amphenol and Cognex both anchor critical niches in the hardware and equipment sector, shaping industrial automation and connectivity.
Amphenol Corporation: Global Connector Powerhouse
Amphenol leads as a designer and manufacturer of electrical and fiber optic connectors worldwide. It generates revenue through diverse product lines including harsh environment data connectors, power systems, and sensor-based products. In 2026, Amphenol focuses on expanding its communications solutions and sensor systems, reinforcing its broad industrial footprint across automotive, aerospace, and IT sectors.
Cognex Corporation: Vision Technology Innovator
Cognex specializes in machine vision systems that automate manufacturing and distribution. Its core revenue arises from software and hardware that inspect, identify, and guide products in industries like electronics and pharmaceuticals. The company’s 2026 strategy emphasizes advancing deep learning vision software and enhancing its DataMan barcode readers, aiming to boost automation efficiencies globally.
Strategic Collision: Similarities & Divergences
Both companies operate in hardware but diverge sharply in philosophy. Amphenol pursues a broad connector ecosystem; Cognex focuses on a specialized, software-driven machine vision niche. Their primary battleground lies in industrial automation—Amphenol through connectivity hardware and Cognex via intelligent vision systems. Investors will find Amphenol’s scale and diversification contrast with Cognex’s innovation-led, high-growth profile.
Income Statement Comparison
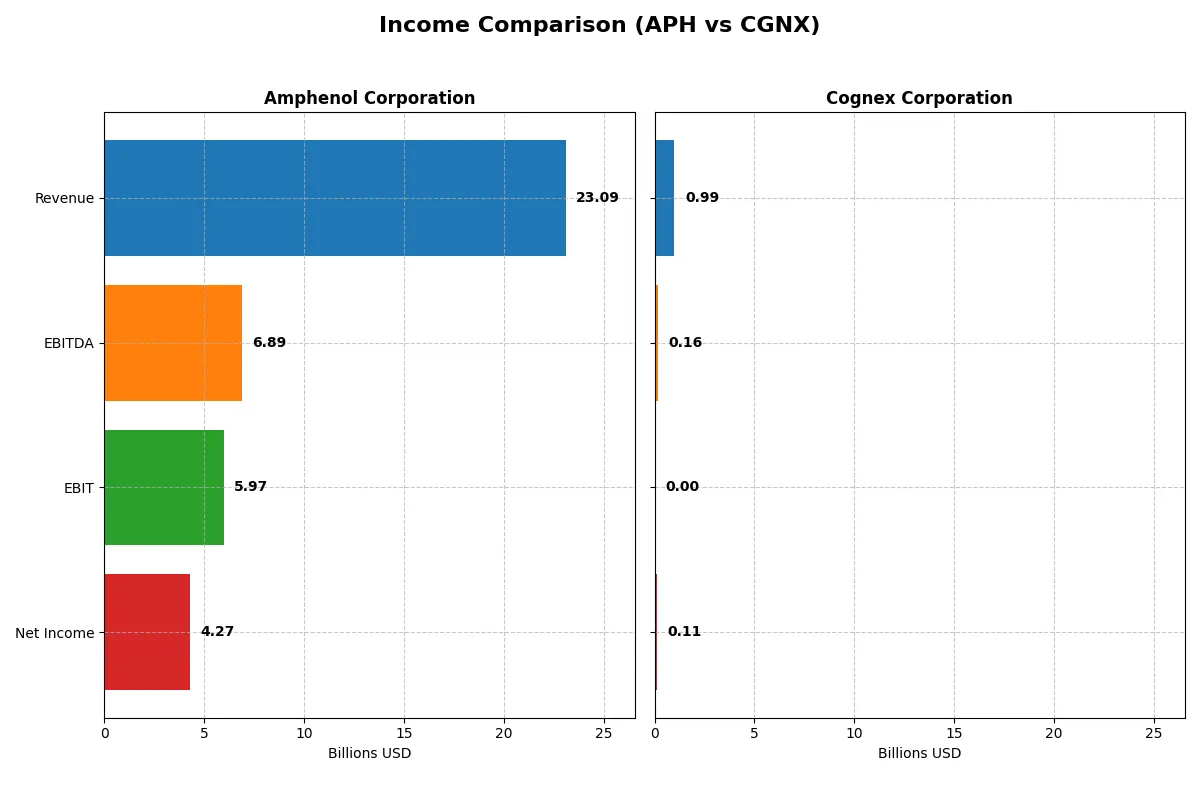
The following data dissects the core profitability and scalability of both corporate engines to reveal who dominates the bottom line:
| Metric | Amphenol Corporation (APH) | Cognex Corporation (CGNX) |
|---|---|---|
| Revenue | 23B | 994M |
| Cost of Revenue | 14.6B | 329M |
| Operating Expenses | 2.55B | 503M |
| Gross Profit | 8.52B | 665M |
| EBITDA | 6.89B | 163M |
| EBIT | 6.0B | 0 |
| Interest Expense | 368M | 0 |
| Net Income | 4.27B | 114M |
| EPS | 3.51 | 0.68 |
| Fiscal Year | 2025 | 2025 |
Income Statement Analysis: The Bottom-Line Duel
This income statement comparison reveals which company operates its business with superior efficiency and profit generation.
Amphenol Corporation Analysis
Amphenol’s revenue surged from $10.9B in 2021 to $23.1B in 2025, doubling over five years. Net income followed suit, rising from $1.59B to $4.27B. Gross margin remains healthy at 36.9%, with a strong net margin of 18.5%. The latest year shows remarkable momentum, with revenue and EBIT growing over 50% and 85%, respectively, reflecting solid operational leverage.
Cognex Corporation Analysis
Cognex’s revenue showed modest fluctuations, peaking near $1.04B in 2021 but declining by 4.1% overall through 2025 to $994M. Net income fell sharply by 59%, down to $114M in 2025, with net margin at 11.5%. Gross margin is robust at nearly 67%, but EBIT margin dropped to zero, signaling challenges in profitability despite stable sales growth of 8.7% last year.
Margin Power vs. Revenue Scale
Amphenol clearly dominates with robust revenue growth and expanding net margins, signaling efficient scale and capital allocation. Cognex boasts superior gross margins but suffers from declining EBIT and net income, highlighting operational inefficiencies. For investors, Amphenol’s strong momentum and margin expansion present a more compelling income statement profile.
Financial Ratios Comparison
These vital ratios act as a diagnostic tool to expose underlying fiscal health, valuation premiums, and capital efficiency for the companies compared below:
| Ratios | Amphenol Corporation (APH) | Cognex Corporation (CGNX) |
|---|---|---|
| ROE | 31.8% | 7.7% |
| ROIC | 15.1% | 5.5% |
| P/E | 38.6 | 52.8 |
| P/B | 12.3 | 4.1 |
| Current Ratio | 3.0 | 3.8 |
| Quick Ratio | 2.5 | 3.0 |
| D/E (Debt-to-Equity) | 1.16 | 0.05 |
| Debt-to-Assets | 42.8% | 3.8% |
| Interest Coverage | 16.2 | N/A |
| Asset Turnover | 0.64 | 0.49 |
| Fixed Asset Turnover | 10.0 | 6.3 |
| Payout Ratio | 18.8% | 47.7% |
| Dividend Yield | 0.49% | 0.90% |
| Fiscal Year | 2025 | 2025 |
Efficiency & Valuation Duel: The Vital Signs
Financial ratios act as a company’s DNA, exposing hidden risks and operational strengths critical for investment decisions.
Amphenol Corporation
Amphenol delivers strong profitability with a 31.8% ROE and an 18.5% net margin, reflecting operational efficiency. However, its valuation is stretched, with a high P/E of 38.55 and P/B of 12.27. The company returns cash cautiously, offering a modest 0.49% dividend yield, focusing more on internal growth and capital allocation.
Cognex Corporation
Cognex shows weaker profitability, with a 7.7% ROE and an 11.5% net margin, indicating operational challenges. Its valuation is more stretched, marked by a P/E of 52.83, despite a lower P/B of 4.05. Cognex maintains low debt but provides no interest coverage, paying a 0.9% dividend while investing heavily in R&D for growth.
Valuation Stretch vs. Operational Strength
Amphenol balances robust profitability against a high valuation, while Cognex faces weaker returns with an even higher P/E. Amphenol’s profile suits investors prioritizing operational safety; Cognex appeals more to those seeking growth with elevated risk.
Which one offers the Superior Shareholder Reward?
I see Amphenol (APH) offers a modest 0.49% dividend yield with a conservative payout ratio near 19%. It backs dividends with strong free cash flow (3.6 per share) and maintains buybacks as part of total return. Cognex (CGNX) delivers a slightly higher 0.90% yield but with a near 48% payout ratio, risking sustainability. CGNX’s free cash flow per share is lower at 1.4, yet it aggressively supplements returns with buybacks. Historically in tech hardware, steady dividends plus disciplined buybacks, as APH demonstrates, tend to sustain long-term value better than high payout risk. I favor Amphenol’s balanced distribution model for a superior total return profile in 2026.
Comparative Score Analysis: The Strategic Profile
The radar chart reveals the fundamental DNA and trade-offs of Amphenol Corporation and Cognex Corporation, highlighting their core financial strengths and vulnerabilities:
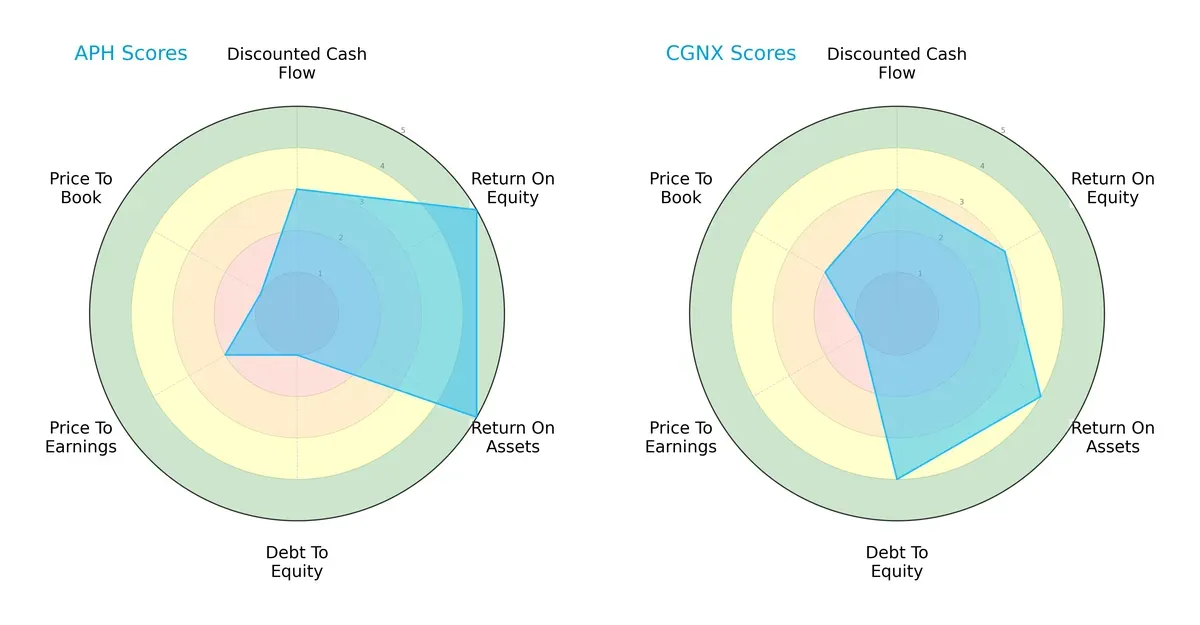
Amphenol excels in profitability metrics, posting higher ROE and ROA scores (5 vs. 3, and 5 vs. 4 respectively), reflecting superior asset utilization and equity returns. Cognex, however, demonstrates a stronger balance sheet with a favorable debt-to-equity score of 4 versus Amphenol’s weak 1. Both firms show moderate discounted cash flow scores (3 each), but Amphenol’s valuation metrics (P/E and P/B) lag behind Cognex, indicating potential overvaluation risks. Overall, Amphenol’s profile leans on operational efficiency, while Cognex offers a more balanced risk position.
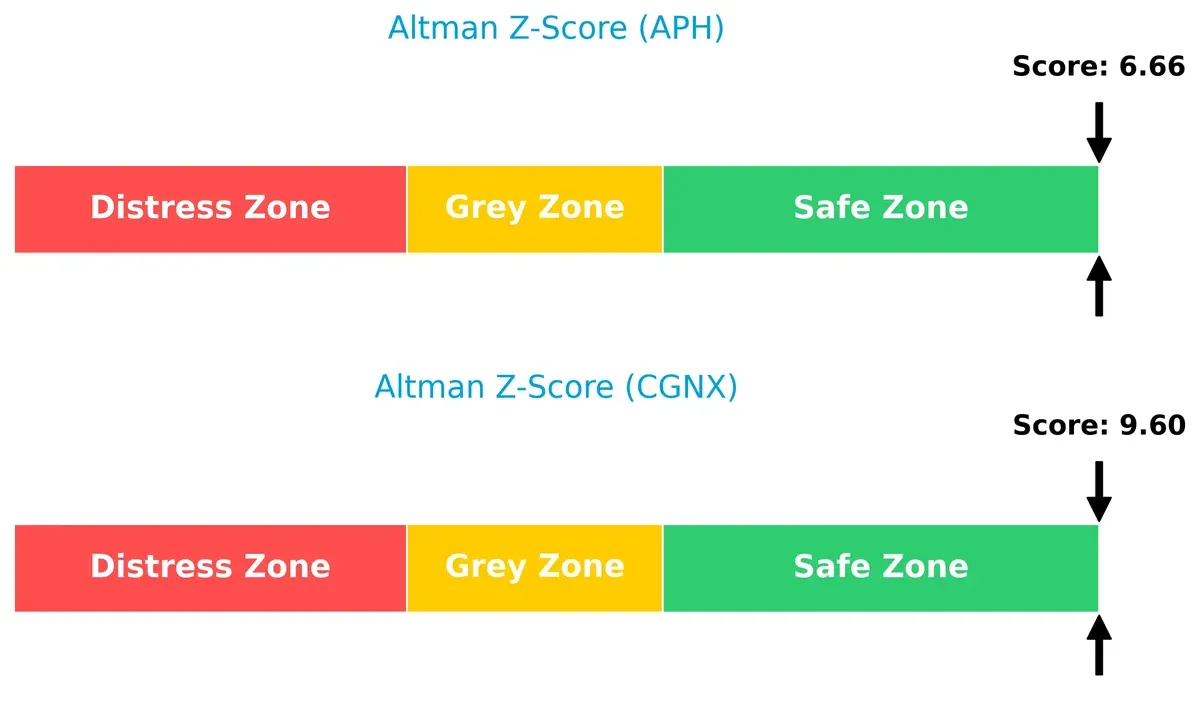
Bankruptcy Risk: Solvency Showdown
Amphenol’s Altman Z-Score of 6.66 versus Cognex’s 9.60 places both firms comfortably in the safe zone. Cognex’s higher score signals even stronger long-term solvency potential in this cycle:
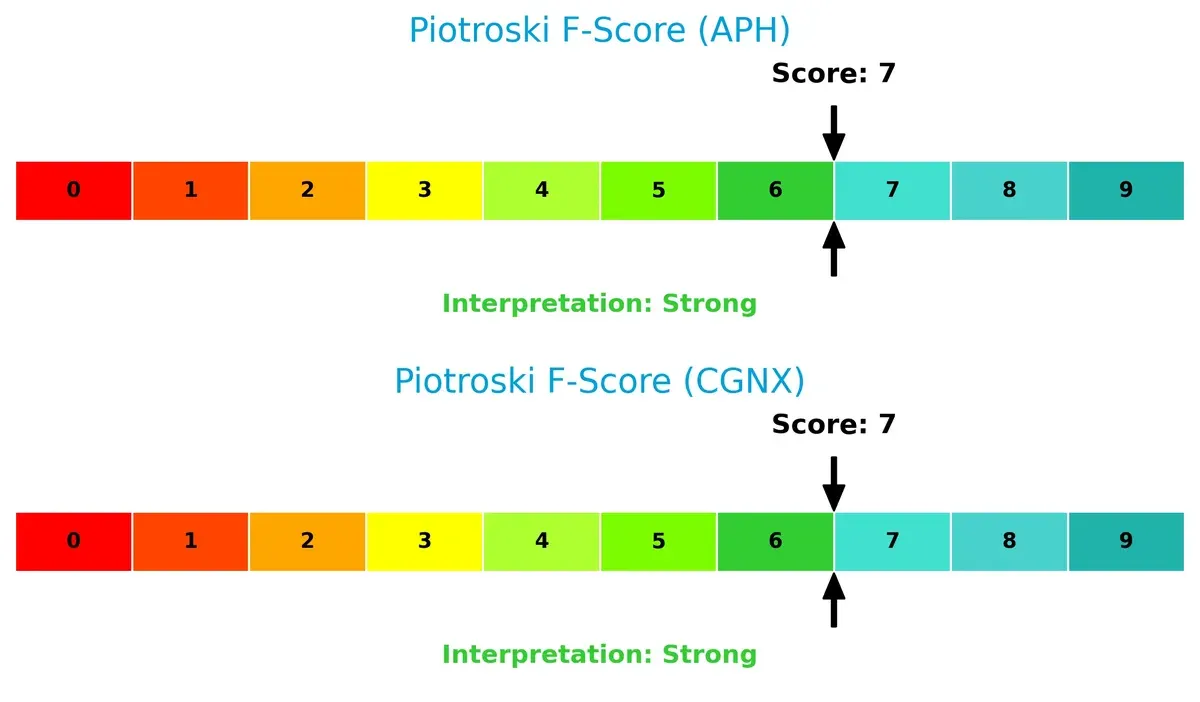
Financial Health: Quality of Operations
Both companies share a strong Piotroski F-Score of 7, indicating robust internal financial health and operational quality. Neither shows immediate red flags, but this parity suggests investors should focus on other differentiators:
How are the two companies positioned?
This section dissects the operational DNA of Amphenol and Cognex by comparing revenue distribution and internal dynamics. The goal is to confront their economic moats to identify which model offers the most resilient competitive advantage today.
Revenue Segmentation: The Strategic Mix
This visual comparison dissects how Amphenol Corporation and Cognex Corporation diversify their income streams and where their primary sector bets lie:
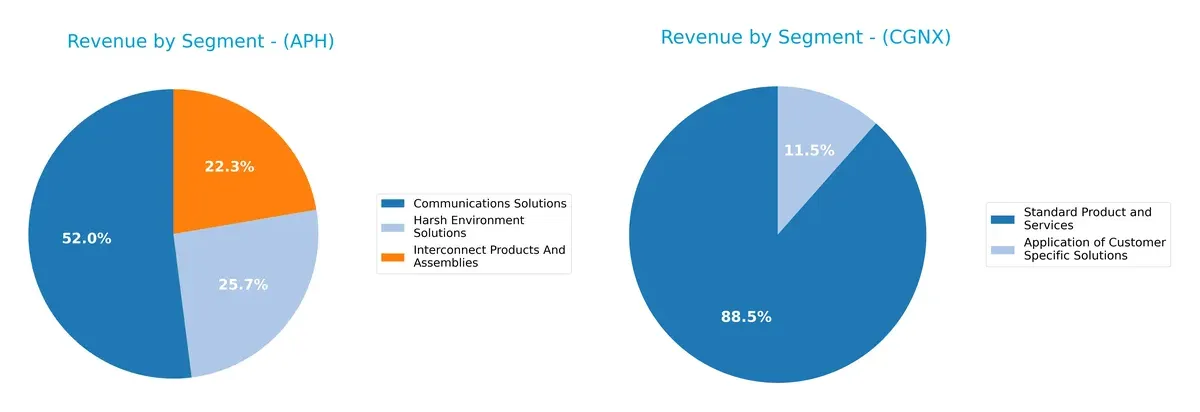
Amphenol relies heavily on Communications Solutions, generating $12.2B in 2025, dwarfing its other segments like Harsh Environment ($6B) and Interconnect Products ($5.2B). Cognex shows a more balanced mix, with Standard Products and Services anchoring $880M, complemented by Application of Customer Specific Solutions at $114M. Amphenol’s concentration signals infrastructure dominance but raises concentration risk. Cognex’s diversification supports resilience in its niche automation market.
Strengths and Weaknesses Comparison
This table compares the Strengths and Weaknesses of Amphenol Corporation (APH) and Cognex Corporation (CGNX):
APH Strengths
- Diverse product segments with strong revenues in Communications, Harsh Environment, and Interconnect solutions
- Favorable net margin (18.49%) and high ROE (31.84%) indicate superior profitability
- Robust liquidity ratios (current 2.98, quick 2.48) support financial stability
- Global presence with significant revenue from Other Foreign Locations ($11.4B)
CGNX Strengths
- Focus on customer-specific solutions and standard products diversifies revenue streams
- Favorable net margin (11.51%) and low debt-to-assets (3.8%) enhance financial health
- Quick ratio (3.05) and low debt-equity (0.05) indicate strong short-term liquidity and low leverage
- Innovation reflected in favorable fixed asset turnover (6.28)
APH Weaknesses
- High price multiples (PE 38.55, PB 12.27) suggest expensive valuation
- Elevated debt-to-equity (1.16) may increase financial risk
- Dividend yield low at 0.49%, potentially less attractive to income investors
- Neutral asset turnover (0.64) limits operational efficiency
CGNX Weaknesses
- Unfavorable ROE (7.67%) and ROIC (5.52%) point to weaker profitability
- WACC (10.79%) exceeds ROIC, signaling value destruction
- Unfavorable interest coverage (0) raises solvency concerns
- Elevated PE (52.83) and PB (4.05) show expensive valuation
- Unfavorable asset turnover (0.49) restricts operational leverage
The comparison reveals APH’s strong profitability and global footprint counterbalanced by valuation and leverage concerns. CGNX shows strengths in liquidity and product focus but faces profitability and solvency challenges. These factors highlight contrasting strategic priorities and risk profiles.
The Moat Duel: Analyzing Competitive Defensibility
A structural moat shields long-term profits from relentless competitive pressures. Without it, market share and margins erode quickly:
Amphenol Corporation: Diverse Product Ecosystem with Scale Advantage
Amphenol’s moat stems from its broad product range and harsh environment connectors, driving stable 26% EBIT margins and a growing ROIC. Expansion into fiber optics deepens its competitive edge in 2026.
Cognex Corporation: Specialized Intangible Asset Moat
Cognex relies on patented machine vision software and sensors, a narrow moat compared to Amphenol’s scale. However, declining ROIC and negative EBIT growth signal pressure on profitability and future moat sustainability.
Scale and Diversification vs. Patent-Driven Complexity
Amphenol’s wide moat benefits from scale, diversified markets, and improving capital efficiency. Cognex faces a shrinking moat with worsening returns. Amphenol stands better equipped to defend and grow market share in 2026.
Which stock offers better returns?
The past year shows pronounced price advances for both Amphenol Corporation and Cognex Corporation, each exhibiting accelerating upward trends with distinct volatility profiles.
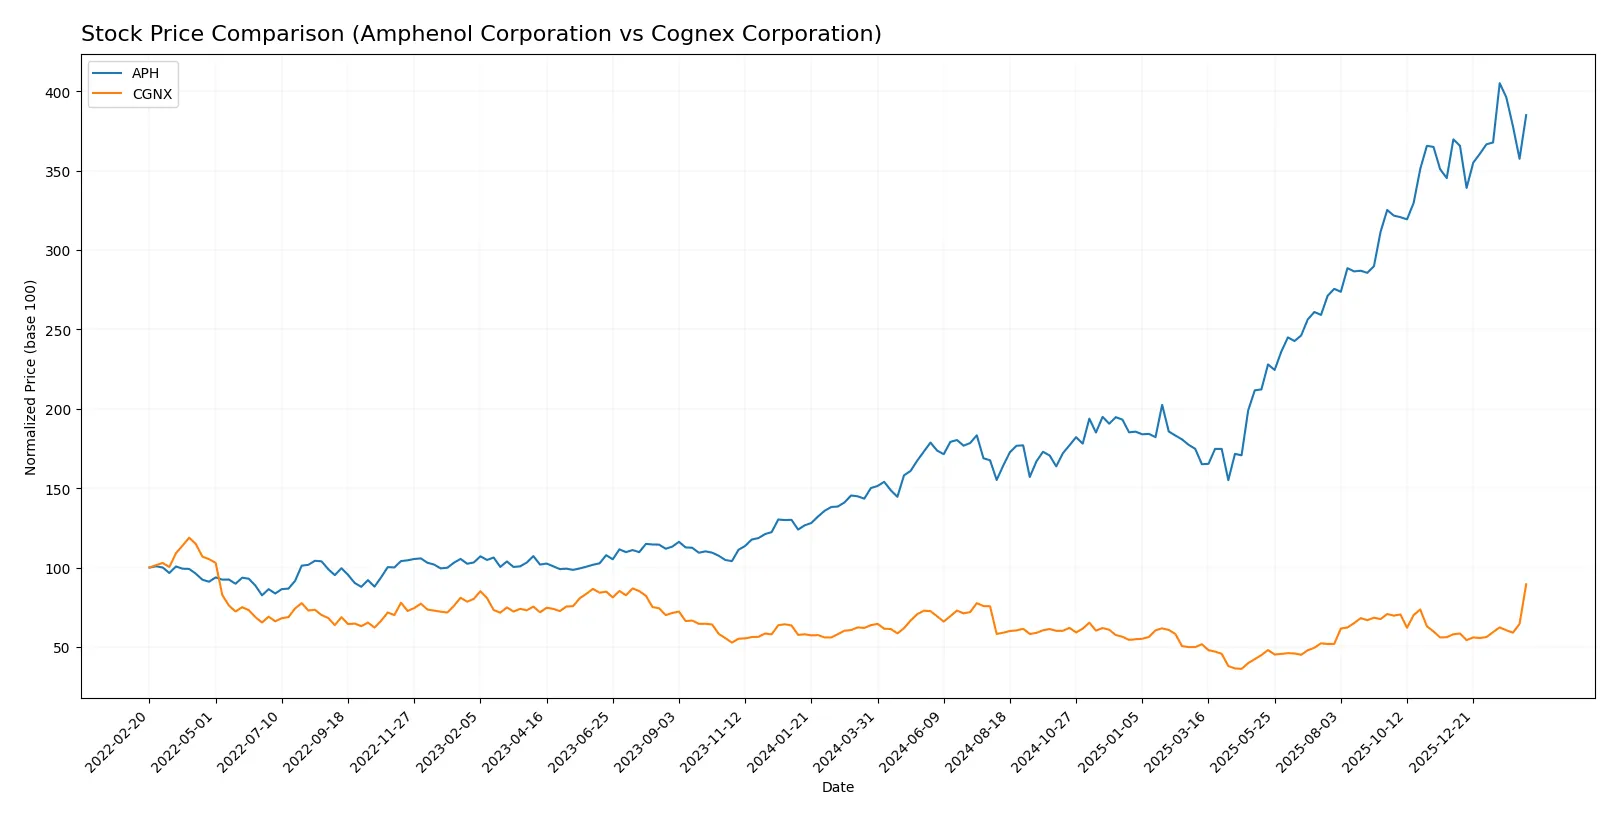
Trend Comparison
Amphenol Corporation’s stock surged 156.46% over the past 12 months, marking a bullish trend with accelerating momentum and a high 29.17 standard deviation, indicating notable volatility.
Cognex Corporation’s stock rose 40.48% in the same period, also bullish with acceleration but lower volatility at a 6.25 standard deviation, reflecting steadier price movement.
Amphenol’s strong 156.46% gain notably outperforms Cognex’s 40.48%, delivering the highest market return between these two stocks.
Target Prices
Analysts present a balanced target consensus for Amphenol Corporation and Cognex Corporation.
| Company | Target Low | Target High | Consensus |
|---|---|---|---|
| Amphenol Corporation | 139 | 210 | 174.13 |
| Cognex Corporation | 38 | 70 | 54.88 |
The consensus target for Amphenol at $174 compares favorably to its current price of $146.72, implying upside potential. Cognex’s consensus of $54.88 sits slightly below its current price of $58.79, suggesting a cautious outlook.

Don’t Let Luck Decide Your Entry Point
Optimize your entry points with our advanced ProRealTime indicators. You’ll get efficient buy signals with precise price targets for maximum performance. Start outperforming now!
How do institutions grade them?
Amphenol Corporation Grades
The following table summarizes recent grades from major institutions for Amphenol Corporation:
| Grading Company | Action | New Grade | Date |
|---|---|---|---|
| Citigroup | Maintain | Buy | 2026-01-29 |
| Barclays | Maintain | Overweight | 2026-01-29 |
| JP Morgan | Maintain | Overweight | 2026-01-27 |
| UBS | Maintain | Buy | 2026-01-14 |
| Citigroup | Maintain | Buy | 2026-01-12 |
| Barclays | Upgrade | Overweight | 2026-01-12 |
| Truist Securities | Maintain | Buy | 2025-12-19 |
| Barclays | Maintain | Equal Weight | 2025-11-13 |
| Truist Securities | Maintain | Buy | 2025-10-23 |
| Citigroup | Maintain | Buy | 2025-10-23 |
Cognex Corporation Grades
The following table summarizes recent grades from major institutions for Cognex Corporation:
| Grading Company | Action | New Grade | Date |
|---|---|---|---|
| Keybanc | Maintain | Overweight | 2026-02-13 |
| Barclays | Maintain | Overweight | 2026-02-13 |
| Needham | Maintain | Buy | 2026-02-12 |
| Barclays | Maintain | Overweight | 2026-01-12 |
| Truist Securities | Maintain | Hold | 2025-12-18 |
| Goldman Sachs | Upgrade | Buy | 2025-12-16 |
| JP Morgan | Downgrade | Underweight | 2025-12-03 |
| DA Davidson | Maintain | Neutral | 2025-11-03 |
| Baird | Maintain | Neutral | 2025-10-31 |
| Needham | Maintain | Buy | 2025-10-31 |
Which company has the best grades?
Amphenol Corporation consistently receives Buy and Overweight grades, signaling strong institutional confidence. Cognex Corporation’s ratings are more mixed, with upgrades to Buy but also downgrades to Underweight and Neutral. This divergence can influence investor sentiment and portfolio decisions.
Risks specific to each company
The following categories identify the critical pressure points and systemic threats facing both firms in the 2026 market environment:
1. Market & Competition
Amphenol Corporation
- Large market cap and diverse segments buffer competitive pressures.
Cognex Corporation
- Smaller scale and niche focus intensify vulnerability to market shifts.
2. Capital Structure & Debt
Amphenol Corporation
- Higher debt-to-equity ratio (1.16) indicates leverage risk.
Cognex Corporation
- Minimal debt (0.05 D/E) offers strong financial flexibility.
3. Stock Volatility
Amphenol Corporation
- Beta of 1.21 suggests moderate market sensitivity.
Cognex Corporation
- Higher beta at 1.53 signals greater stock price volatility.
4. Regulatory & Legal
Amphenol Corporation
- Global operations expose it to complex regulatory environments.
Cognex Corporation
- Focus on machine vision may face evolving tech-specific regulations.
5. Supply Chain & Operations
Amphenol Corporation
- Extensive manufacturing and distribution networks increase operational risk.
Cognex Corporation
- More concentrated operations reduce diversification but enhance control.
6. ESG & Climate Transition
Amphenol Corporation
- Larger footprint implies higher ESG scrutiny and transition risk.
Cognex Corporation
- Smaller scale may limit ESG impact but also resource allocation.
7. Geopolitical Exposure
Amphenol Corporation
- Operations in China and globally heighten geopolitical risk.
Cognex Corporation
- Primarily US-based, lowering direct geopolitical exposure.
Which company shows a better risk-adjusted profile?
Amphenol’s greatest risk is its elevated leverage, increasing financial risk despite solid profitability. Cognex faces significant stock volatility tied to its smaller size and higher beta. Cognex’s minimal debt and strong Altman Z-score provide financial stability, but its unfavorable P/E and regulatory risks pressure valuation. Amphenol’s diversified operations and strong liquidity mitigate some risks, though leverage remains a red flag. Overall, Cognex shows a better risk-adjusted profile due to low leverage and strong bankruptcy safety, despite higher market volatility.
Final Verdict: Which stock to choose?
Amphenol Corporation’s superpower lies in its robust value creation and operational efficiency. Its consistently growing ROIC well above WACC signals a sustainable competitive advantage. The main point of vigilance is its elevated debt-to-equity ratio, which warrants caution. This stock suits aggressive growth portfolios seeking strong capital returns amid cyclical markets.
Cognex Corporation’s strategic moat is its niche in machine vision technology with recurring revenue potential. It maintains a low debt profile, offering a safer balance sheet compared to Amphenol. However, declining profitability and negative ROIC trends temper its appeal. Cognex fits portfolios focused on growth at a reasonable price (GARP) with a tolerance for operational turnaround risks.
If you prioritize durable value creation and strong profitability, Amphenol outshines due to its solid capital efficiency and expanding margins. However, if you seek exposure to innovative tech niches with lower leverage, Cognex offers better stability despite its current challenges. Each scenario requires weighing growth ambitions against financial resilience in 2026’s market environment.
Disclaimer: Investment carries a risk of loss of initial capital. The past performance is not a reliable indicator of future results. Be sure to understand risks before making an investment decision.
Go Further
I encourage you to read the complete analyses of Amphenol Corporation and Cognex Corporation to enhance your investment decisions: