Home > Comparison > Technology > APH vs CLS
The strategic rivalry between Amphenol Corporation and Celestica Inc. shapes the Technology sector’s hardware landscape. Amphenol operates as a capital-intensive manufacturer specializing in electrical connectors and harsh environment solutions. Celestica, by contrast, is a diversified hardware platform and supply chain service provider emphasizing complex assembly and integration. This analysis will assess which business model offers superior risk-adjusted returns, guiding investors seeking durable exposure in technology hardware and equipment.
Table of contents
Companies Overview
Amphenol and Celestica stand as key players in the global hardware and equipment sector, each commanding distinct niches.
Amphenol Corporation: Global Connector Powerhouse
Amphenol dominates as a leading designer and manufacturer of electrical and fiber optic connectors worldwide. Its core revenue derives from diversified segments, including harsh environment solutions and communication systems. In 2026, Amphenol focuses strategically on expanding its value-add product lines like cable assemblies and sensor-based technologies to capture growing demand in aerospace, automotive, and broadband communications.
Celestica Inc.: Comprehensive Supply Chain Innovator
Celestica operates as a foremost provider of hardware platform and supply chain services, spanning design, engineering, and logistics. Its revenue engine centers on advanced manufacturing and integration services for industries such as aerospace, cloud, and healthtech. This year, Celestica prioritizes enhancing its connectivity and cloud solutions, targeting hyperscalers and original equipment manufacturers to strengthen its foothold in high-growth technology sectors.
Strategic Collision: Similarities & Divergences
Both companies emphasize technology hardware but diverge sharply in approach: Amphenol builds proprietary connector systems, while Celestica invests in open supply chain and integration services. Their primary battleground lies in serving tech-driven industries requiring reliable hardware solutions. Amphenol’s extensive product portfolio contrasts with Celestica’s service-centric model, defining distinct investment profiles shaped by manufacturing scale versus supply chain agility.
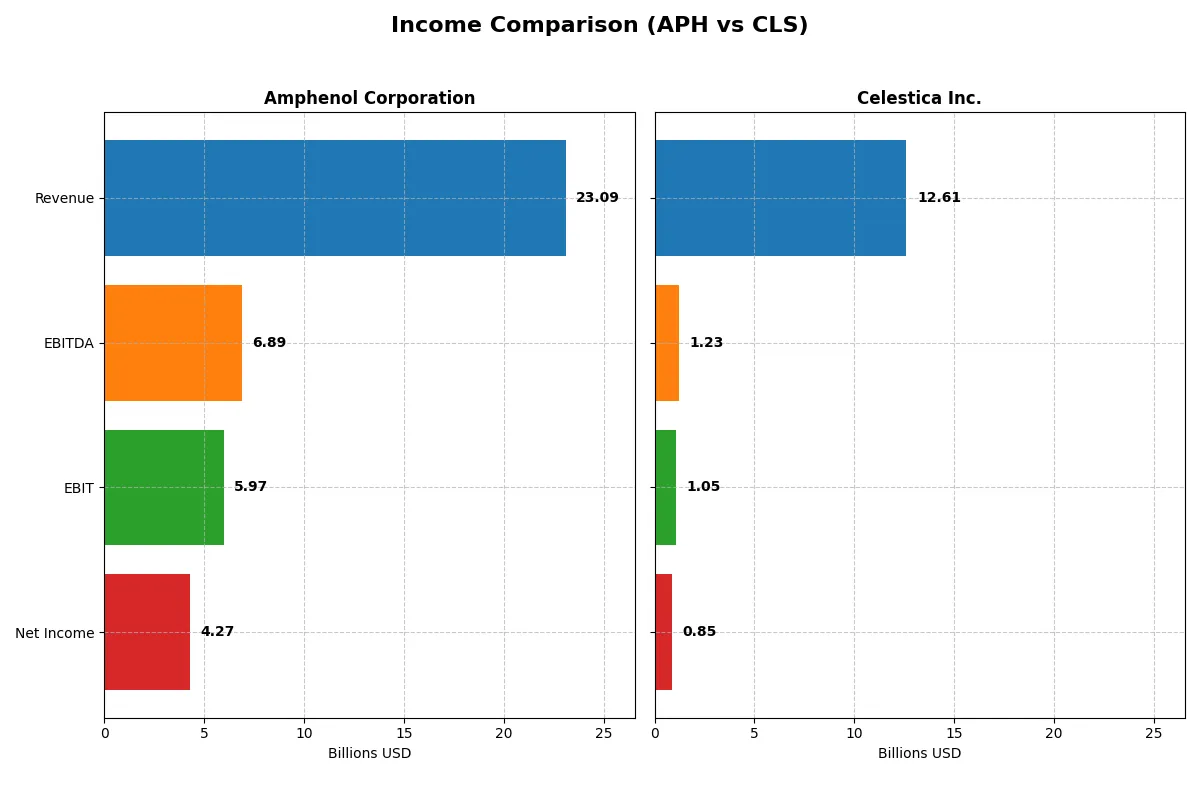
Income Statement Comparison
This data dissects the core profitability and scalability of both corporate engines to reveal who dominates the bottom line:
| Metric | Amphenol Corporation (APH) | Celestica Inc. (CLS) |
|---|---|---|
| Revenue | 23B | 12.6B |
| Cost of Revenue | 14.6B | 11.1B |
| Operating Expenses | 2.55B | 385M |
| Gross Profit | 8.5B | 1.47B |
| EBITDA | 6.9B | 1.23B |
| EBIT | 6.0B | 1.05B |
| Interest Expense | 368M | 54M |
| Net Income | 4.27B | 847M |
| EPS | 3.51 | 7.22 |
| Fiscal Year | 2025 | 2025 |
Income Statement Analysis: The Bottom-Line Duel
This income statement comparison exposes which company runs a more efficient and profitable corporate engine through revenue and margin trends.
Amphenol Corporation Analysis
Amphenol’s revenue surged from 10.9B in 2021 to 23.1B in 2025, doubling over five years. Net income climbed robustly to 4.3B in 2025, supported by a strong gross margin of 36.9% and a net margin near 18.5%. The latest year reflects powerful momentum, with EBIT and EPS growth surpassing 70%, signaling operational efficiency and solid capital allocation.
Celestica Inc. Analysis
Celestica’s revenue grew steadily from 5.6B in 2021 to 12.6B in 2025, more than doubling in five years. Net income expanded impressively to 847M, though margins remain slim with a gross margin of 11.7% and net margin around 6.7%. The 2025 results show strong earnings growth above 90% in EPS, indicating improving profitability but still operating with thinner margins compared to peers.
Margin Strength vs. Growth Scale
Amphenol leads decisively in margin quality and absolute profitability, boasting nearly triple the net income and higher efficiency ratios than Celestica. Celestica impresses with rapid earnings growth and expanding scale but lags on margin depth. For investors prioritizing profitability and margin resilience, Amphenol’s profile stands out as the more fundamentally sound choice.
Financial Ratios Comparison
These vital ratios act as a diagnostic tool to expose the underlying fiscal health, valuation premiums, and capital efficiency of the companies compared below:
| Ratios | Amphenol Corporation (APH) | Celestica Inc. (CLS) |
|---|---|---|
| ROE | 24.8% | 22.6% |
| ROIC | 14.9% | 16.1% |
| P/E | 34.5 | 25.5 |
| P/B | 8.54 | 5.75 |
| Current Ratio | 2.37 | 1.49 |
| Quick Ratio | 1.75 | 0.91 |
| D/E (Debt-to-Equity) | 0.74 | 0.42 |
| Debt-to-Assets | 34.0% | 13.3% |
| Interest Coverage | 15.1 | 11.5 |
| Asset Turnover | 0.71 | 1.61 |
| Fixed Asset Turnover | 7.26 | 14.58 |
| Payout Ratio | 24.6% | 0% |
| Dividend Yield | 0.71% | 0% |
| Fiscal Year | 2024 | 2024 |
Efficiency & Valuation Duel: The Vital Signs
Ratios act as the company’s DNA, exposing hidden risks and operational strengths that drive investment decisions.
Amphenol Corporation
Amphenol delivers strong profitability with a 24.75% ROE and a 15.92% net margin, signaling operational efficiency. However, its valuation appears stretched, with a high P/E of 34.49 and P/B of 8.54. Shareholders receive a modest 0.71% dividend yield, suggesting limited payout while the firm reinvests in growth and innovation.
Celestica Inc.
Celestica shows a solid 22.57% ROE but a weaker 4.44% net margin, indicating lower profitability efficiency. The stock trades at a lower P/E of 25.47 but remains expensive relative to fundamentals. It pays no dividends, likely focusing on reinvestment for growth, supported by favorable debt metrics and strong asset turnover.
Operational Excellence vs. Valuation Stretch
Amphenol offers higher profitability but at a premium valuation, while Celestica balances moderate returns with a more conservative capital structure. Investors seeking operational efficiency might prefer Amphenol, whereas those prioritizing leverage and turnover could lean toward Celestica.
Which one offers the Superior Shareholder Reward?
I observe that Amphenol Corporation (APH) offers a modest dividend yield near 0.85% with a payout ratio around 25%, reflecting a balanced distribution supported by strong free cash flow (FCF) coverage above 75%. APH also executes steady buybacks, reinforcing shareholder value. Conversely, Celestica Inc. (CLS) pays no dividends, focusing on reinvestment and growth, yet its operating cash flow margin is less robust and buyback activity is minimal. While CLS’s asset turnover is high, its lower profitability and no dividends reduce immediate shareholder rewards. I conclude APH’s sustainable dividend plus buybacks deliver a superior total return profile in 2026.
Comparative Score Analysis: The Strategic Profile
The radar chart reveals the fundamental DNA and trade-offs of Amphenol Corporation and Celestica Inc., highlighting their financial strengths and valuation nuances:
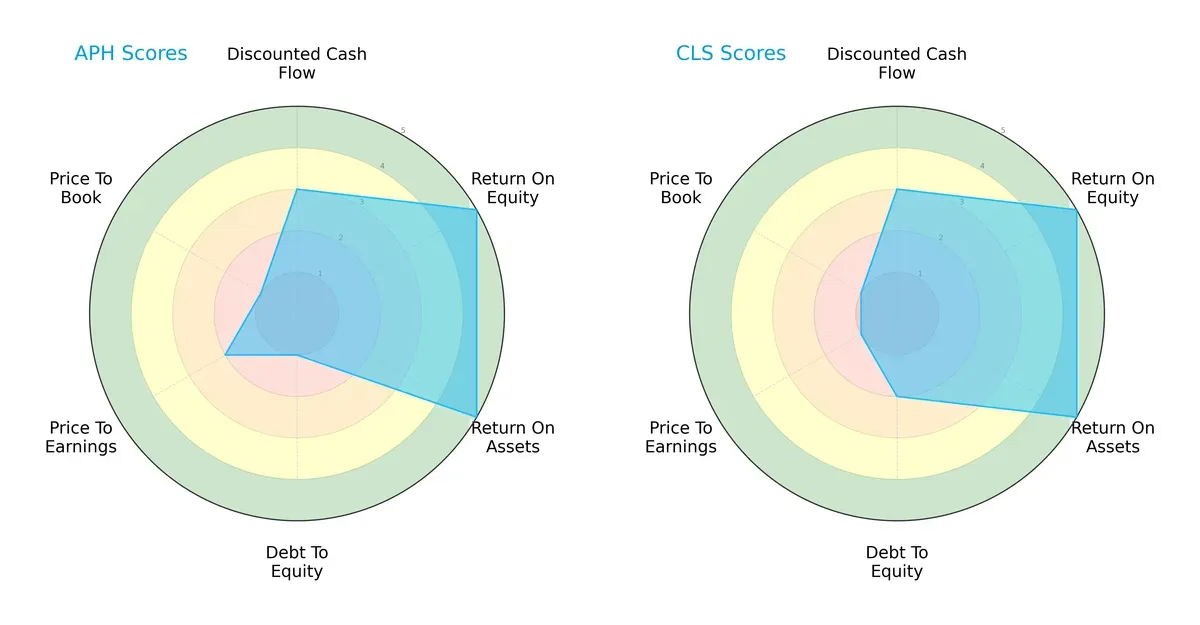
Both companies share equal overall, DCF, ROE, and ROA scores, reflecting similar operational efficiency and cash flow projections. Amphenol’s debt-to-equity score is weaker (1 vs. 2), signaling higher leverage risk. Celestica carries a valuation disadvantage with a poorer P/E score (1 vs. 2), suggesting potential overvaluation or market skepticism. Amphenol shows a less balanced profile, relying on operational returns, while Celestica maintains a more moderate financial risk stance.
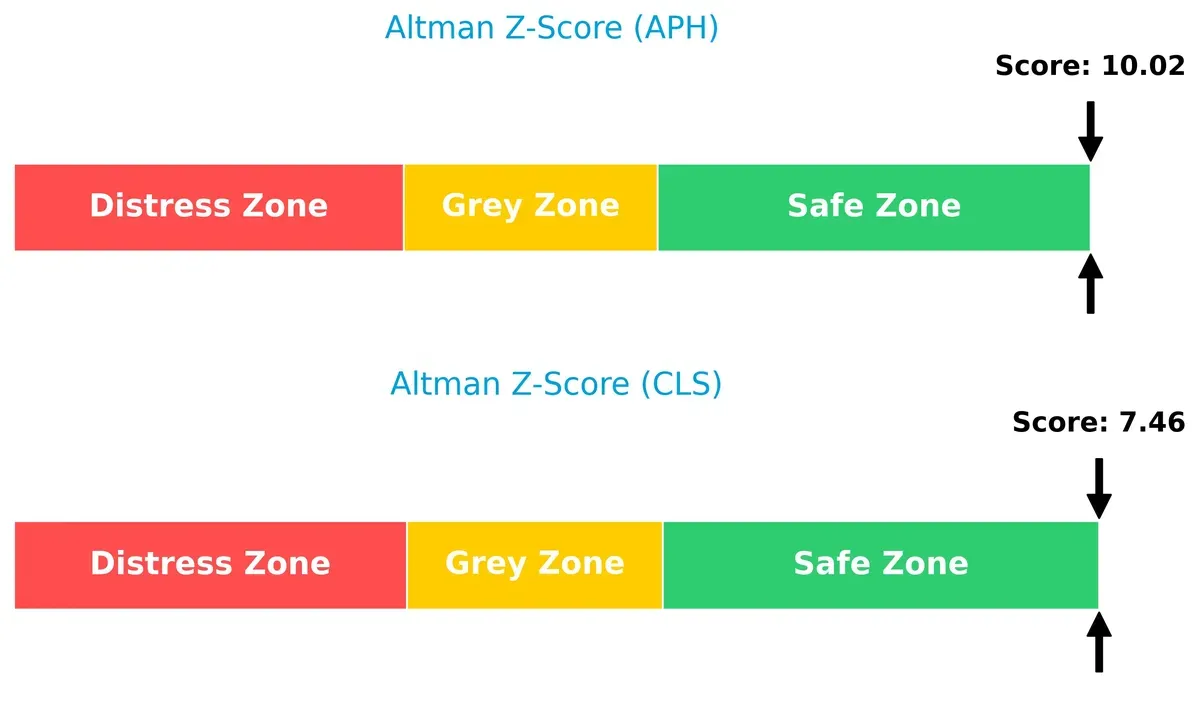
Bankruptcy Risk: Solvency Showdown
Amphenol’s Altman Z-Score of 10.02 significantly outpaces Celestica’s 7.46, placing both safely away from distress but underscoring Amphenol’s superior financial stability and resilience in this cycle:
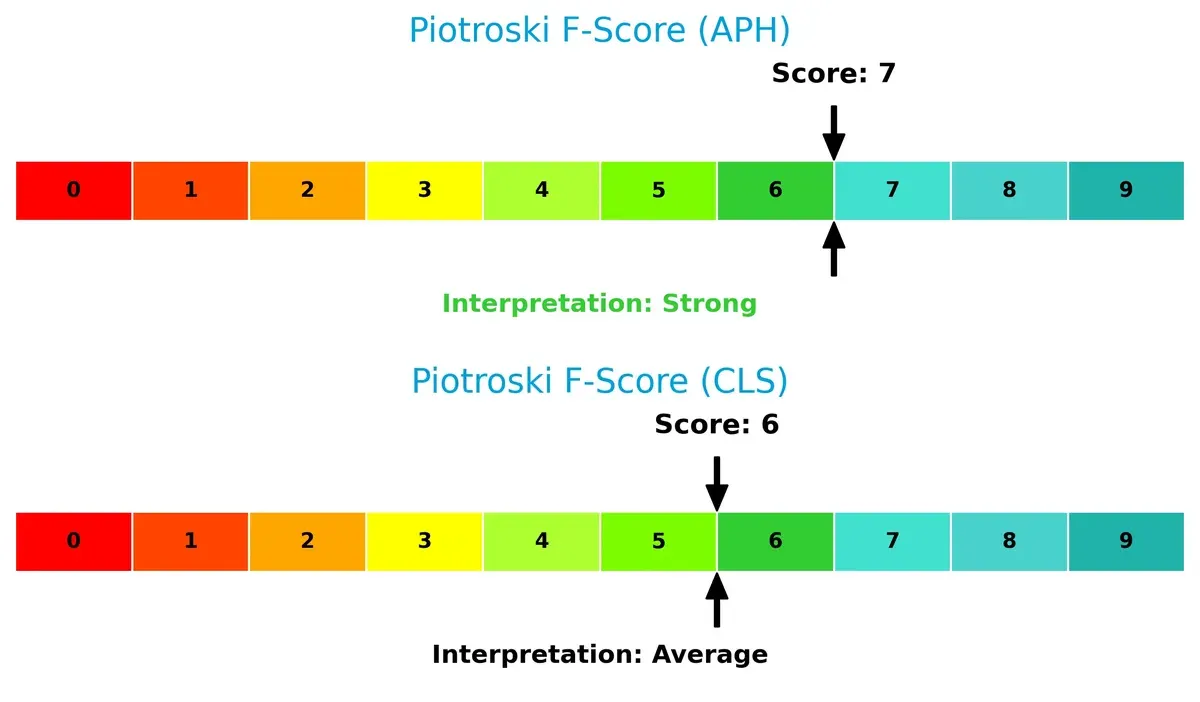
Financial Health: Quality of Operations
Amphenol scores 7 on the Piotroski scale, indicating strong financial health, while Celestica’s 6 suggests average robustness. No immediate red flags appear, but Amphenol’s internal metrics show firmer operational quality:
How are the two companies positioned?
This section dissects the operational DNA of Amphenol and Celestica by comparing revenue distribution and internal strengths and weaknesses. The goal is to confront their economic moats to reveal which model offers the most resilient, sustainable advantage today.
Revenue Segmentation: The Strategic Mix
The following comparison dissects how Amphenol Corporation and Celestica Inc. diversify their income streams and where their primary sector bets lie:
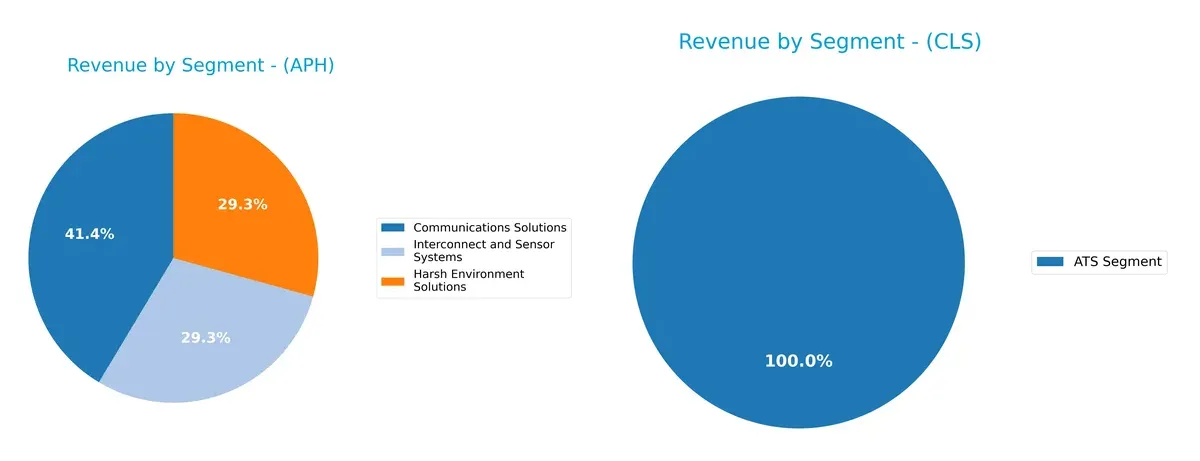
Amphenol dominates with three strong segments: Communications Solutions at $6.38B, and nearly equal Harsh Environment and Interconnect Systems each around $4.5B. This reflects a balanced portfolio reducing concentration risk and leveraging infrastructure dominance. In contrast, Celestica relies solely on its ATS segment at $3.16B, indicating high dependency on a single line and potential vulnerability to sector shifts. Amphenol’s mix pivots on ecosystem lock-in, while Celestica faces concentration risk.
Strengths and Weaknesses Comparison
This table compares the Strengths and Weaknesses of Amphenol Corporation and Celestica Inc.:
Amphenol Corporation Strengths
- Diverse product segments including Communications and Harsh Environment Solutions
- Strong profitability with 15.9% net margin
- Robust ROE at 24.75% and ROIC at 14.9%
- Solid liquidity with 2.37 current ratio and 1.75 quick ratio
- Global revenue spread across US, China, and other foreign locations
- Favorable interest coverage at 16.23 and efficient fixed asset turnover of 7.26
Celestica Inc. Strengths
- Favorable ROE at 22.57% and strong interest coverage at 19.69
- Low debt-to-assets ratio of 13.3% and debt-to-equity at 0.42 indicating conservative leverage
- High asset turnover of 1.61 and fixed asset turnover of 14.58 reflecting operational efficiency
- Single significant revenue segment ATS at $3.16B
- Slightly favorable global ratio evaluation despite limited geographic data
Amphenol Corporation Weaknesses
- High price-to-book of 8.54 and price-to-earnings of 34.49 suggest valuation premium
- Dividend yield low at 0.71%
- Neutral debt-to-equity and debt-to-assets ratios may limit financial flexibility
- Moderate asset turnover of 0.71 signals room for operational improvement
Celestica Inc. Weaknesses
- Low net margin at 4.44% indicates weaker profitability
- Price-to-earnings at 25.47 and price-to-book at 5.75 are unfavorable
- Quick ratio at 0.91 and current ratio 1.49 show weaker short-term liquidity
- No dividend yield
- Unavailable data on ROIC and WACC reduces transparency
Both companies exhibit slightly favorable overall financial profiles but emphasize different strengths. Amphenol’s diversified portfolio and profitability contrast with Celestica’s operational efficiency and conservative leverage. Each faces valuation and liquidity challenges that could influence strategic priorities going forward.
The Moat Duel: Analyzing Competitive Defensibility
A structural moat is the only thing protecting long-term profits from the erosion of competition. Let’s dissect how these two firms defend their turf:
Amphenol Corporation: Intangible Assets and Diversified Market Reach
Amphenol’s moat stems from strong intangible assets and broad industry diversification. It delivers a very favorable ROIC +5.9% above WACC, reflecting efficient capital use and margin stability. New communications and harsh environment connectors could deepen its moat in 2026.
Celestica Inc.: Operational Flexibility and Supply Chain Expertise
Celestica leverages supply chain mastery and operational scale as its moat, distinct from Amphenol’s asset-heavy model. While ROIC data is unavailable, its growing ROIC trend and strong margin expansion signal improving competitive positioning. Expansion into cloud and tech manufacturing offers growth avenues.
Intangible Assets vs. Operational Agility: Who Holds the Deeper Moat?
Amphenol’s proven value creation and margin robustness give it a wider, more durable moat. Celestica’s rising ROIC trend is promising but lacks the clear capital efficiency edge. Amphenol stands better equipped to defend market share amid intensifying competition.
Which stock offers better returns?
The past year saw strong gains for both stocks, with Amphenol showing steady acceleration while Celestica experienced a sharp rise followed by recent weakness.
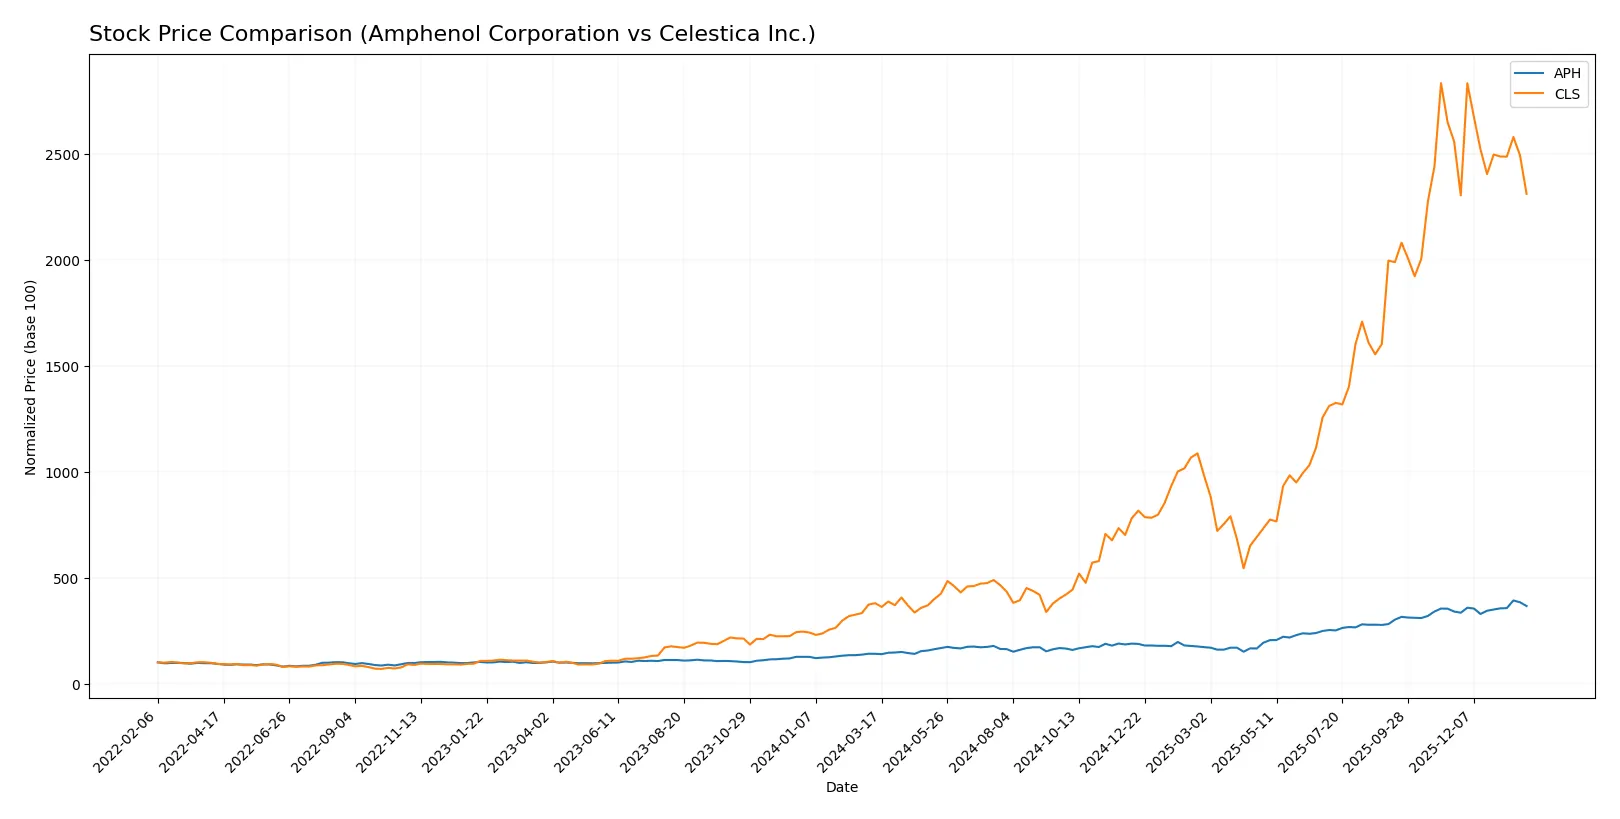
Trend Comparison
Amphenol’s stock rose 161% over the last 12 months, displaying a bullish trend with price acceleration and a solid high of 154.39. Volatility remains moderate at 28.51%.
Celestica gained 510% in the same period, marking a bullish but decelerating trend. Its recent 9.6% decline and high volatility at 92.63% signal increased risk.
Celestica outperformed Amphenol overall but showed recent weakness, while Amphenol maintained steady gains with accelerating momentum.
Target Prices
Analysts present a constructive target consensus for both Amphenol Corporation and Celestica Inc.
| Company | Target Low | Target High | Consensus |
|---|---|---|---|
| Amphenol Corporation | 139 | 210 | 174.13 |
| Celestica Inc. | 300 | 440 | 365.6 |
Amphenol’s consensus target of 174.13 suggests a 21% upside from the current 144.08 price. Celestica’s 365.6 target implies a substantial 30% gain over the current 280.99 price.

Don’t Let Luck Decide Your Entry Point
Optimize your entry points with our advanced ProRealTime indicators. You’ll get efficient buy signals with precise price targets for maximum performance. Start outperforming now!
How do institutions grade them?
Here is a summary of recent institutional grades for Amphenol Corporation and Celestica Inc.:
Amphenol Corporation Grades
This table lists Amphenol Corporation’s latest grades from leading financial institutions.
| Grading Company | Action | New Grade | Date |
|---|---|---|---|
| Citigroup | Maintain | Buy | 2026-01-29 |
| Barclays | Maintain | Overweight | 2026-01-29 |
| JP Morgan | Maintain | Overweight | 2026-01-27 |
| UBS | Maintain | Buy | 2026-01-14 |
| Citigroup | Maintain | Buy | 2026-01-12 |
| Barclays | Upgrade | Overweight | 2026-01-12 |
| Truist Securities | Maintain | Buy | 2025-12-19 |
| Barclays | Maintain | Equal Weight | 2025-11-13 |
| Citigroup | Maintain | Buy | 2025-10-23 |
| Truist Securities | Maintain | Buy | 2025-10-23 |
Celestica Inc. Grades
This table summarizes Celestica Inc.’s recent grades from recognized institutional analysts.
| Grading Company | Action | New Grade | Date |
|---|---|---|---|
| Citigroup | Maintain | Buy | 2026-01-30 |
| Barclays | Maintain | Overweight | 2026-01-30 |
| Goldman Sachs | Maintain | Buy | 2025-12-01 |
| Barclays | Maintain | Overweight | 2025-11-14 |
| Citigroup | Upgrade | Buy | 2025-11-10 |
| Goldman Sachs | Maintain | Buy | 2025-10-29 |
| CIBC | Maintain | Outperform | 2025-10-29 |
| Stifel | Maintain | Buy | 2025-10-29 |
| Barclays | Maintain | Overweight | 2025-10-29 |
| JP Morgan | Maintain | Overweight | 2025-10-29 |
Which company has the best grades?
Amphenol and Celestica both receive predominantly Buy and Overweight ratings from top firms. Celestica shows a broader range of Buy and Outperform grades, suggesting slightly stronger recent institutional confidence. This could influence investor sentiment in favor of Celestica.
Risks specific to each company
The following categories identify critical pressure points and systemic threats facing Amphenol Corporation and Celestica Inc. in the 2026 market environment:
1. Market & Competition
Amphenol Corporation
- Strong market presence with diversified segments in harsh environment and communications; faces intense competition in connector markets.
Celestica Inc.
- Competes in contract manufacturing and supply chain services with exposure to tech cycles; competitive pressure from global EMS providers.
2. Capital Structure & Debt
Amphenol Corporation
- Moderate leverage with debt-to-equity around 0.74; interest coverage strong at 16.23, but debt profile warrants caution.
Celestica Inc.
- Lower leverage at 0.42 debt-to-equity and strong interest coverage at 19.69; balance sheet is more conservatively structured.
3. Stock Volatility
Amphenol Corporation
- Beta at 1.214 indicates moderate stock volatility relative to the market; range volatility up to $167.
Celestica Inc.
- Higher beta of 1.463 suggests greater stock price sensitivity; trading range is wider, increasing volatility risk.
4. Regulatory & Legal
Amphenol Corporation
- Exposure to global regulatory regimes in tech and defense sectors; compliance complexity but historically well-managed.
Celestica Inc.
- Operates in multiple jurisdictions with supply chain regulations; higher compliance risk given diverse manufacturing footprint.
5. Supply Chain & Operations
Amphenol Corporation
- Robust supply chain with vertical integration in connectors; potential disruption risk from global component shortages.
Celestica Inc.
- Supply chain services core to business; operational risks include component sourcing and logistics complexity amid global constraints.
6. ESG & Climate Transition
Amphenol Corporation
- Increasing pressure to meet ESG standards in manufacturing and product lifecycle; moderate risk given technology exposure.
Celestica Inc.
- Faces challenges in energy usage and emissions across manufacturing sites; active initiatives but transition risks remain material.
7. Geopolitical Exposure
Amphenol Corporation
- Significant international sales including China and aerospace sectors; geopolitical tensions could impact key markets.
Celestica Inc.
- Global operations with exposure to North America, Europe, and Asia; geopolitical conflicts could disrupt supply chains and demand.
Which company shows a better risk-adjusted profile?
Amphenol’s key risk is its moderate leverage amid high market competition, while Celestica’s main risk stems from higher stock volatility and supply chain complexity. I see Amphenol offering a better risk-adjusted profile due to its stronger balance sheet safety margins and more diversified product base. Celestica’s elevated beta and operational risks weigh heavier despite conservative debt levels. Notably, Amphenol’s Altman Z-score of 10 vs. Celestica’s 7.5 confirms superior financial resilience for Amphenol.
Final Verdict: Which stock to choose?
Amphenol Corporation’s superpower lies in its durable competitive advantage, consistently generating returns well above its cost of capital. Its robust cash flow and operational efficiency drive impressive growth. A point of vigilance is its relatively high valuation multiples, which could temper upside. It suits aggressive growth portfolios seeking resilient industrial leaders.
Celestica’s strategic moat is its asset-light model and operational agility, supporting strong return on equity with lower leverage than Amphenol. It offers a safer profile amid market volatility but trades at a premium to its earnings growth. This makes it a fit for GARP investors balancing growth potential with moderate risk.
If you prioritize steady value creation with strong operational leverage, Amphenol outshines as the compelling choice due to its proven moat and accelerating growth. However, if you seek a more conservative growth approach with lower debt exposure, Celestica offers better stability despite recent price softness. Both present interesting analytical scenarios depending on your risk tolerance and investment horizon.
Disclaimer: Investment carries a risk of loss of initial capital. The past performance is not a reliable indicator of future results. Be sure to understand risks before making an investment decision.
Go Further
I encourage you to read the complete analyses of Amphenol Corporation and Celestica Inc. to enhance your investment decisions: