Home > Comparison > Healthcare > AMGN vs PFE
The strategic rivalry between Amgen Inc. and Pfizer Inc. shapes the healthcare sector’s evolution. Amgen operates as a focused, innovation-driven biotech leader, while Pfizer stands as a diversified pharmaceutical powerhouse with vast scale. This head-to-head contrasts Amgen’s specialized growth model against Pfizer’s broad portfolio and global reach. This analysis aims to reveal which company’s trajectory delivers the superior risk-adjusted return for a diversified investor navigating healthcare’s complexities.
Table of contents
Companies Overview
Amgen and Pfizer remain titans in the global pharmaceutical market, shaping healthcare innovation and delivery.
Amgen Inc.: Biotech Pioneer with Precision Therapeutics
Amgen dominates as a biotechnology leader, generating revenue through innovative therapies in oncology, inflammation, and cardiovascular fields. Its core products, like Enbrel and Neulasta, drive strong sales. In 2026, Amgen emphasizes targeted biologics and strategic partnerships to expand treatment options and improve patient outcomes globally.
Pfizer Inc.: Pharmaceutical Giant Driving Broad Therapeutics
Pfizer commands a vast pharmaceutical portfolio spanning vaccines, biologics, and small molecules. Its blockbuster brands include Comirnaty and Eliquis. In 2026, Pfizer focuses on expanding immunotherapies and biosimilars while leveraging collaborations to accelerate drug development and diversify its global footprint.
Strategic Collision: Similarities & Divergences
Both companies prioritize innovation but diverge in approach: Amgen builds on a focused biotech platform, while Pfizer leverages a broad pharmaceutical ecosystem. They fiercely compete in oncology and immunology markets, targeting overlapping patient needs. Amgen offers a specialized growth profile; Pfizer delivers scale and diversification, appealing to distinct investor appetites.
Income Statement Comparison
This data dissects the core profitability and scalability of both corporate engines to reveal who dominates the bottom line:
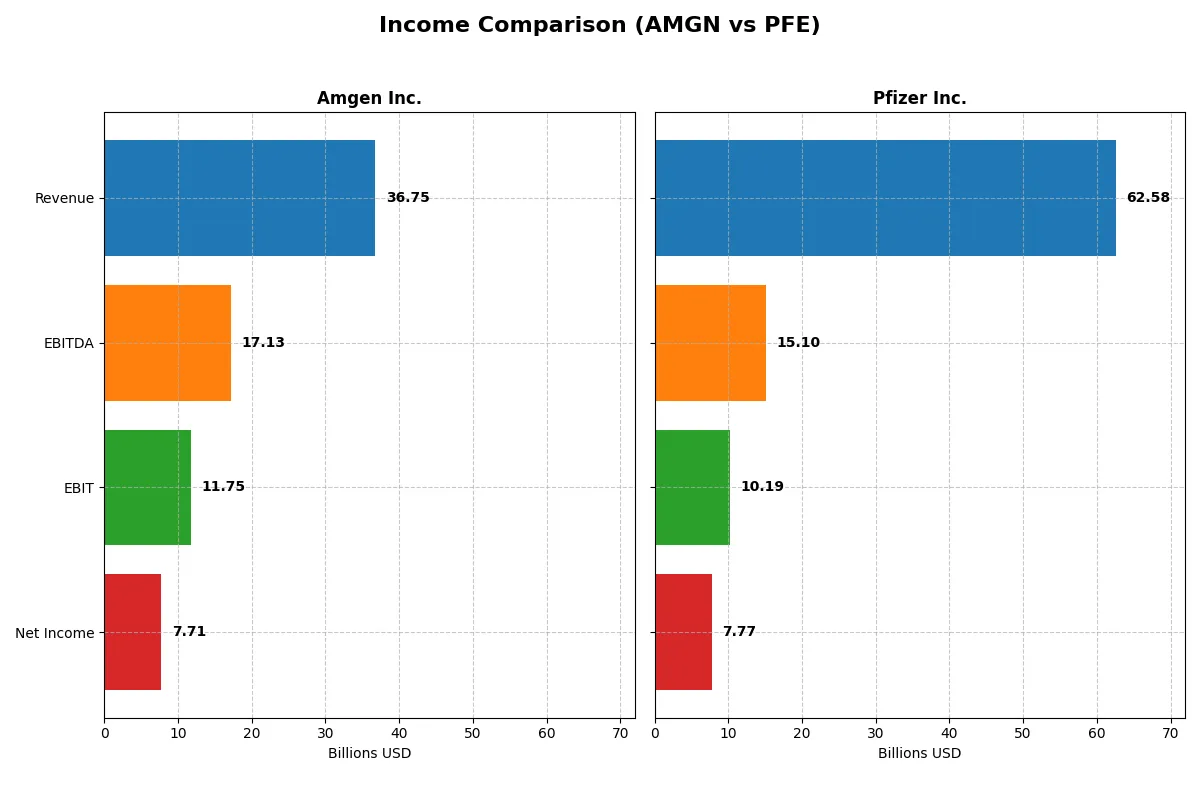
| Metric | Amgen Inc. (AMGN) | Pfizer Inc. (PFE) |
|---|---|---|
| Revenue | 36.8B | 62.6B |
| Cost of Revenue | 6.4B | 18.6B |
| Operating Expenses | 15.4B | 28.6B |
| Gross Profit | 30.3B | 44.0B |
| EBITDA | 17.1B | 15.1B |
| EBIT | 11.8B | 10.2B |
| Interest Expense | 2.8B | 2.7B |
| Net Income | 7.7B | 7.7B |
| EPS | 14.33 | 1.36 |
| Fiscal Year | 2025 | 2025 |
Income Statement Analysis: The Bottom-Line Duel
Comparing income statements reveals which company operates with superior efficiency and sustainable profitability in a competitive market.
Amgen Inc. Analysis
Amgen shows a strong upward trend, with 2025 revenue at $36.75B, up nearly 10% from 2024. Net income surged 88% year-over-year to $7.7B, reflecting robust margin expansion. Its gross margin stands at a healthy 82.5%, and net margin improved to 21%, signaling efficient cost management and accelerating profitability momentum.
Pfizer Inc. Analysis
Pfizer’s 2025 revenue declined slightly to $62.6B, down 1.7% from 2024, while net income slipped 3.5% to $7.7B. Gross margin remains solid at 70.3%, but net margin at 12.4% trails behind Amgen’s. Notably, Pfizer’s EBIT margin dropped 8.3% year-over-year, indicating pressure on operating efficiency and profitability sustainability.
Margin Leadership vs. Scale Resilience
Amgen dominates with superior margin health and double-digit growth in revenue and earnings. Pfizer maintains higher top-line scale but struggles with declining profitability and margin compression. For investors prioritizing earnings quality and growth momentum, Amgen’s leaner, high-margin profile appears more attractive.
Financial Ratios Comparison
These vital ratios act as a diagnostic tool to expose the underlying fiscal health, valuation premiums, and capital efficiency of the companies compared:
| Ratios | Amgen Inc. (AMGN) | Pfizer Inc. (PFE) |
|---|---|---|
| ROE | 89.1% | 8.3% |
| ROIC | 18.4% | — |
| P/E | 22.8 | 18.2 |
| P/B | 20.3 | 1.52 |
| Current Ratio | 1.14 | 0 |
| Quick Ratio | 0.90 | 0 |
| D/E (Debt to Equity) | 6.31 | 0 |
| Debt-to-Assets | 60.3% | 0 |
| Interest Coverage | 5.41 | 5.78 |
| Asset Turnover | 0.41 | 0 |
| Fixed Asset Turnover | 4.64 | 0 |
| Payout Ratio | 66.4% | 126% |
| Dividend Yield | 2.91% | 6.91% |
| Fiscal Year | 2025 | 2025 |
Efficiency & Valuation Duel: The Vital Signs
Financial ratios act as a company’s DNA, exposing hidden risks and operational strengths through key profitability and valuation metrics.
Amgen Inc.
Amgen delivers exceptional profitability, boasting an 89% ROE and a 21% net margin, signaling strong operational efficiency. Its P/E ratio of 22.8 suggests a fairly valued stock, though a high P/B ratio of 20.3 appears stretched. Shareholders benefit from a 2.9% dividend yield, reflecting a balanced approach between income and reinvestment in R&D.
Pfizer Inc.
Pfizer shows moderate profitability with an 8.4% ROE and a 12.4% net margin, indicating operational challenges compared to peers. Its P/E of 18.2 is reasonable, and a low P/B near 1.5 suggests undervaluation. The 6.9% dividend yield rewards investors, but weak ROIC and asset turnover metrics highlight efficiency concerns.
Premium Valuation vs. Operational Safety
Amgen commands a premium valuation justified by superior profitability and capital returns. Pfizer offers safer valuation metrics but struggles with efficiency and returns. Investors seeking growth and strong operational metrics may lean toward Amgen, while income-focused investors might prefer Pfizer’s higher dividend yield.
Which one offers the Superior Shareholder Reward?
I compare Amgen Inc. (AMGN) and Pfizer Inc. (PFE) on dividends, payout ratios, and buybacks. Amgen yields ~2.9% with a payout ratio near 66%, supported by strong free cash flow (~81% coverage). Pfizer offers a higher dividend yield (~6.9%) but a payout ratio over 125%, risking sustainability. Amgen maintains a robust buyback program, enhancing total returns; Pfizer’s buyback data is limited, indicating less aggressive capital return. I find Amgen’s balanced payout and buybacks more sustainable for long-term value. Pfizer’s high yield appears fragile amid elevated payout. For 2026, Amgen offers a superior total shareholder reward profile.
Comparative Score Analysis: The Strategic Profile
The radar chart reveals the fundamental DNA and trade-offs of Amgen Inc. and Pfizer Inc., highlighting their core strengths and vulnerabilities:
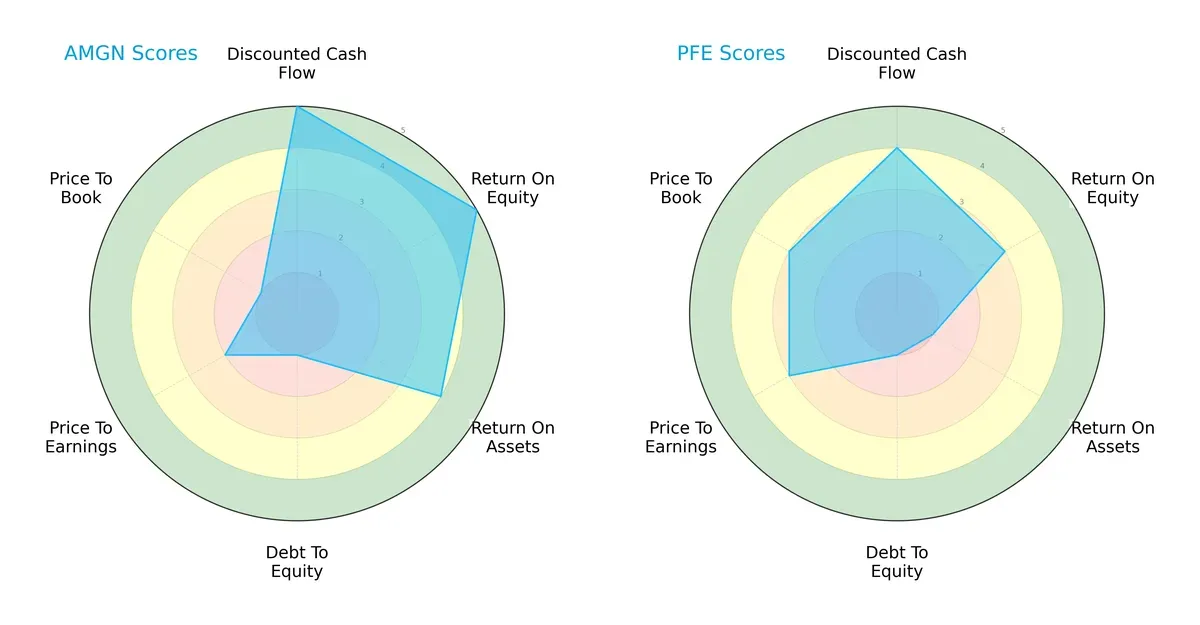
Amgen demonstrates a robust profile with very favorable scores in DCF (5), ROE (5), and ROA (4), signaling efficient capital allocation and asset use. Pfizer shows moderate DCF (4) and ROE (3) but struggles with ROA (1), indicating less asset efficiency. Both firms share a weak debt-to-equity score (1), signaling elevated financial leverage risks. Valuation metrics favor Pfizer moderately (PE 3, PB 3) over Amgen’s more unfavorable scores (PE 2, PB 1). Overall, Amgen presents a more balanced operational and valuation profile, while Pfizer relies on relative valuation strength amid operational challenges.
—
Bankruptcy Risk: Solvency Showdown
Amgen’s Altman Z-Score of 2.32 places it in the grey zone, indicating moderate bankruptcy risk. Pfizer’s score is unavailable, precluding direct comparison.

—
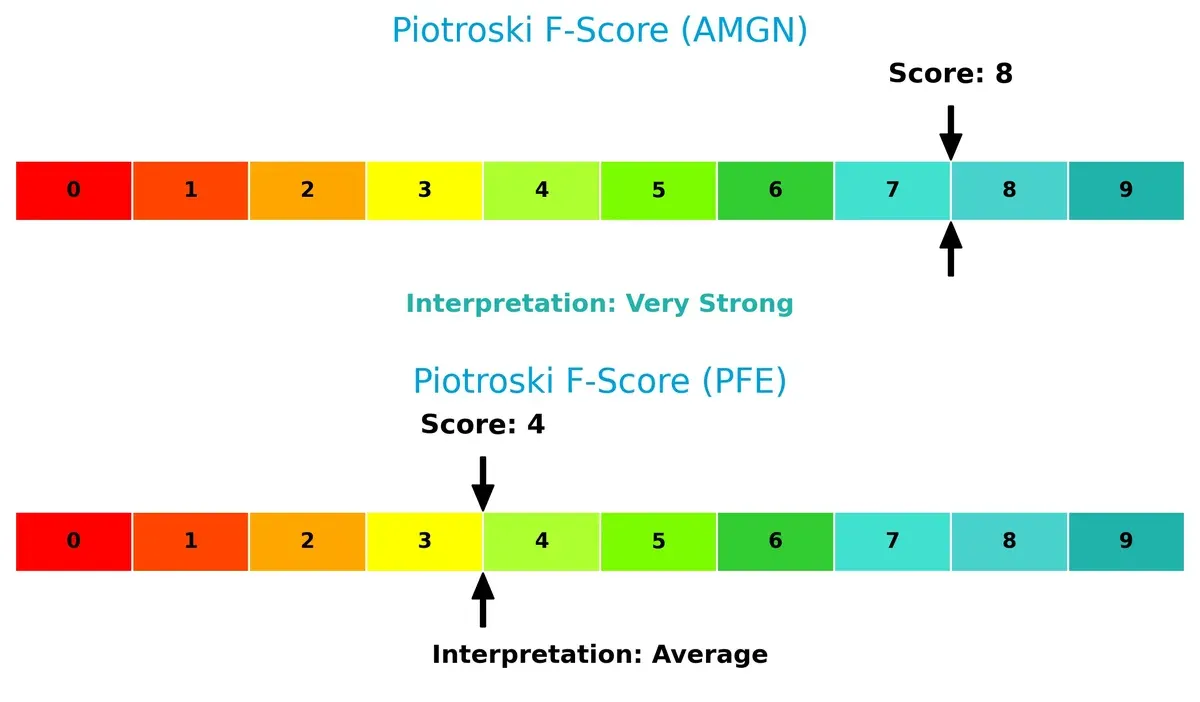
Financial Health: Quality of Operations
Amgen scores an impressive 8 on the Piotroski F-Score, reflecting very strong internal financial health and operational quality. Pfizer’s score of 4 is average, suggesting moderate financial stability with some red flags:
How are the two companies positioned?
This section dissects Amgen’s and Pfizer’s operational DNA by comparing their revenue distribution and internal dynamics, including strengths and weaknesses. The goal is to confront their economic moats and reveal which model offers the most resilient competitive advantage today.
Revenue Segmentation: The Strategic Mix
This visual comparison dissects how Amgen Inc. and Pfizer Inc. diversify their income streams and reveals where their primary sector bets lie:
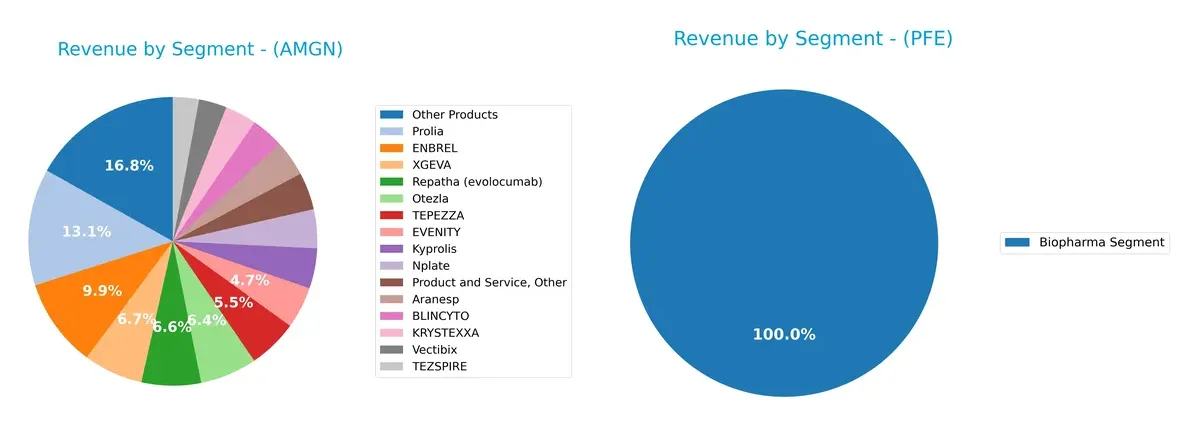
Amgen shows a highly diversified portfolio with revenues spread across 15+ products, like ENBREL at $3.3B and Prolia at $4.4B, anchoring its biotech ecosystem. Pfizer, by contrast, relies heavily on its Biopharma segment, generating $62.4B in 2024, dwarfing other categories. Amgen’s broad product mix reduces concentration risk. Pfizer’s focus on Biopharma signals strong specialization but increases exposure to single-segment volatility.
Strengths and Weaknesses Comparison
This table compares the strengths and weaknesses of Amgen Inc. and Pfizer Inc. based on diversification, profitability, financials, innovation, global presence, and market share:
Amgen Strengths
- Strong profitability with 21% net margin and 89% ROE
- Favorable ROIC vs. WACC at 18.35% vs. 5.7%
- Diversified product portfolio across multiple biologics
- Solid U.S. and growing international revenue streams
- Robust fixed asset turnover at 4.64
- Consistent dividend yield near 3%
Pfizer Strengths
- Large global presence with $62B biopharma revenue
- Favorable WACC at 5.91% supports capital efficiency
- Lower debt levels improve financial flexibility
- Wide geographic diversification including emerging markets
- Neutral P/E valuation at 18.2
- Higher dividend yield at nearly 7% supports income investors
Amgen Weaknesses
- Elevated debt to assets at 60%, raising leverage risk
- Unfavorable PB ratio at 20.34 signals overvaluation
- Neutral liquidity ratios may challenge short-term flexibility
- Low asset turnover at 0.41 limits efficiency
- ROE and ROIC extremely high but warrant scrutiny
- Limited recent innovation revenue disclosed
Pfizer Weaknesses
- Lower profitability with 12.4% net margin and 8.35% ROE
- Zero ROIC suggests poor capital returns
- Unfavorable current and quick ratios indicate liquidity risk
- Weak asset and fixed asset turnover at 0
- Higher proportion of unfavorable financial ratios (43%)
- Dependence on U.S. market for majority of revenues
Overall, Amgen demonstrates superior profitability and capital efficiency but faces leverage and valuation concerns. Pfizer leverages a broader global footprint and lower debt but struggles with profitability and liquidity. These factors shape their strategic financial priorities in 2026.
The Moat Duel: Analyzing Competitive Defensibility
A structural moat protects long-term profits from relentless competition erosion. Without it, sustainable earnings vanish quickly:
Amgen Inc.: Innovation-Driven Intangible Asset Moat
I see Amgen’s moat rooted in proprietary biologics and patents, reflected in a strong 31.98% EBIT margin and growing 12.7% ROIC premium over WACC. Its expanding pipeline in oncology and inflammation deepens this advantage in 2026.
Pfizer Inc.: Scale and Diversification Moat Under Pressure
Pfizer relies on global scale and portfolio breadth, but its declining ROIC and negative 5.9% spread versus WACC signal weakening competitive strength. Recent revenue setbacks challenge its ability to sustain market dominance, though vaccine innovation offers upside.
Innovation Intensity vs. Scale Sustainability
Amgen boasts a wider and deepening moat via superior capital efficiency and margin stability. Pfizer’s scale is significant but undercut by deteriorating returns. Amgen stands better poised to defend and grow market share in this evolving healthcare landscape.
Which stock offers better returns?
Over the past year, Amgen Inc. showed strong gains with accelerating momentum, while Pfizer Inc. faced a declining trend despite recent modest recovery in price.
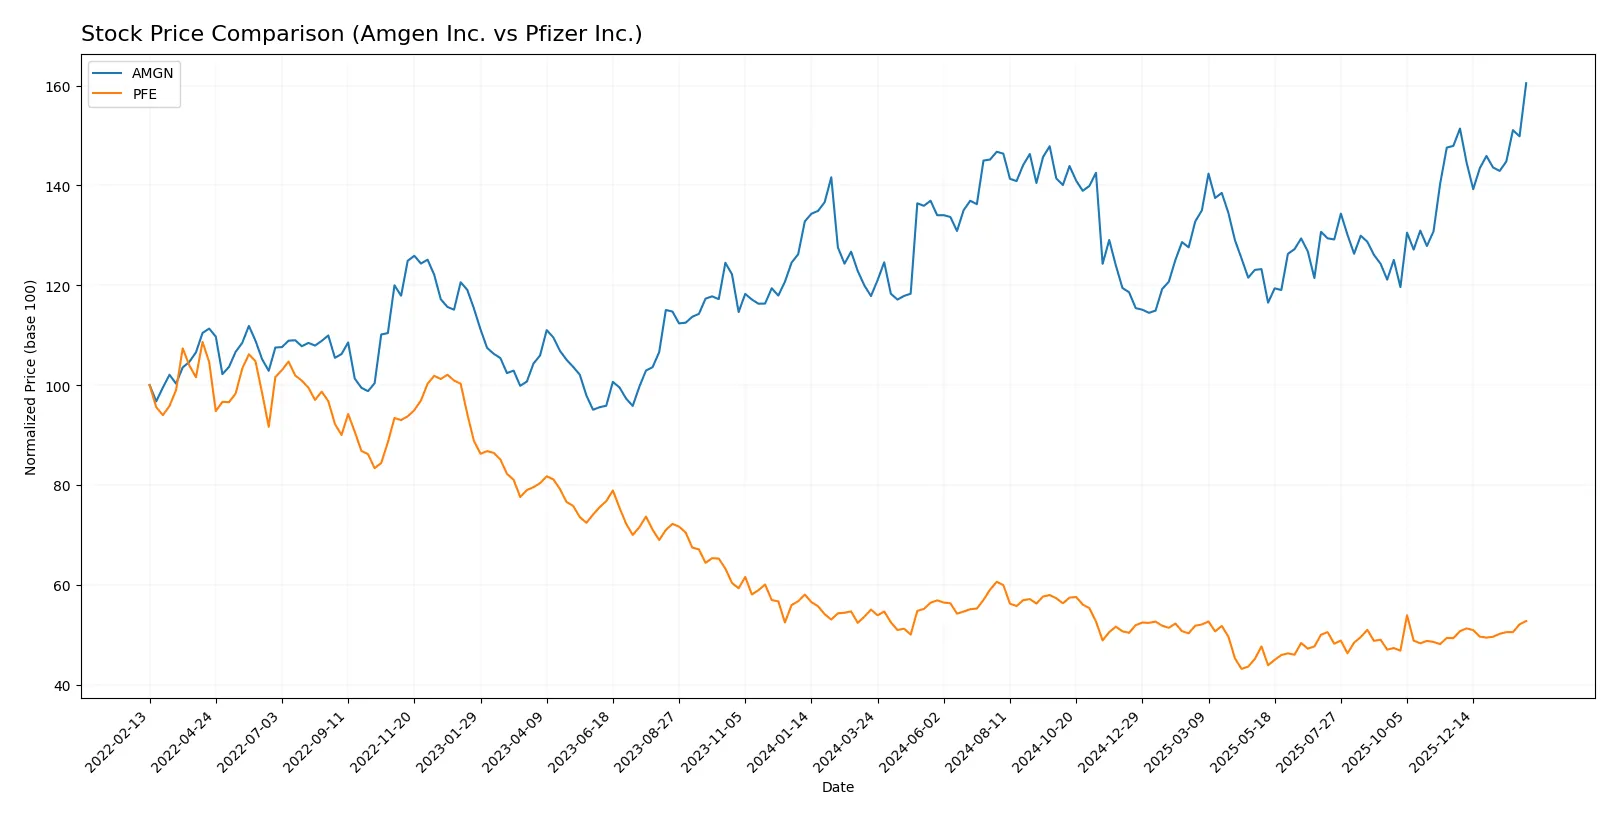
Trend Comparison
Amgen Inc. posted a 36.2% price increase over the past 12 months, signaling a bullish trend with accelerating gains and price ranging between 261.22 and 366.2.
Pfizer Inc. recorded a 4.15% price decline over the same period, reflecting a bearish trend despite recent slight upward movement and low volatility near 30.77 and 21.91.
Amgen’s stock delivered the highest market performance, outperforming Pfizer by over 40 percentage points in annual price change.
Target Prices
Analysts present a mixed but generally positive target consensus for Amgen Inc. and Pfizer Inc.
| Company | Target Low | Target High | Consensus |
|---|---|---|---|
| Amgen Inc. | 309 | 425 | 364.09 |
| Pfizer Inc. | 24 | 35 | 28 |
The target consensus for Amgen sits slightly below its current price of 366.2, indicating moderate upside potential. Pfizer’s target consensus of 28 suggests limited upside from its current 26.78 price, reflecting cautious optimism.

Don’t Let Luck Decide Your Entry Point
Optimize your entry points with our advanced ProRealTime indicators. You’ll get efficient buy signals with precise price targets for maximum performance. Start outperforming now!
How do institutions grade them?
Here are the recent institutional grades and ratings for Amgen Inc. and Pfizer Inc.:
Amgen Inc. Grades
This table shows the latest grades and actions from leading financial institutions on Amgen Inc.
| Grading Company | Action | New Grade | Date |
|---|---|---|---|
| Morgan Stanley | maintain | Equal Weight | 2026-02-04 |
| Leerink Partners | maintain | Outperform | 2026-02-04 |
| Citigroup | maintain | Neutral | 2026-02-04 |
| Cantor Fitzgerald | maintain | Neutral | 2026-02-04 |
| UBS | maintain | Buy | 2026-01-26 |
| Bernstein | downgrade | Market Perform | 2026-01-20 |
| Truist Securities | maintain | Hold | 2026-01-08 |
| Morgan Stanley | maintain | Equal Weight | 2025-12-12 |
| Wells Fargo | maintain | Equal Weight | 2025-12-10 |
| BMO Capital | maintain | Outperform | 2025-12-03 |
Pfizer Inc. Grades
This table summarizes the latest institutional grades and actions on Pfizer Inc.
| Grading Company | Action | New Grade | Date |
|---|---|---|---|
| Cantor Fitzgerald | maintain | Neutral | 2026-02-04 |
| Cantor Fitzgerald | maintain | Neutral | 2026-01-27 |
| Morgan Stanley | maintain | Equal Weight | 2025-12-17 |
| B of A Securities | maintain | Neutral | 2025-12-15 |
| Morgan Stanley | maintain | Equal Weight | 2025-12-12 |
| Guggenheim | maintain | Buy | 2025-11-24 |
| Morgan Stanley | maintain | Equal Weight | 2025-10-10 |
| B of A Securities | maintain | Neutral | 2025-10-03 |
| Morgan Stanley | maintain | Equal Weight | 2025-08-06 |
| B of A Securities | maintain | Neutral | 2025-08-06 |
Which company has the best grades?
Amgen has several Outperform and Buy grades, while Pfizer’s ratings cluster around Neutral and Equal Weight. Amgen’s stronger grades may indicate greater institutional confidence, potentially affecting investor sentiment positively.
Risks specific to each company
The following risk categories identify critical pressure points and systemic threats facing Amgen Inc. and Pfizer Inc. in the 2026 market environment:
1. Market & Competition
Amgen Inc.
- Strong niche in inflammation and oncology with premium pricing power. Faces biosimilar threats impacting growth.
Pfizer Inc.
- Broad portfolio with vaccines and COVID-19 treatments; faces intense competition and patent cliffs.
2. Capital Structure & Debt
Amgen Inc.
- High debt-to-assets ratio (60.3%) increases leverage risk; interest coverage moderate at 4.27x.
Pfizer Inc.
- Debt metrics appear favorable with low debt-to-equity; however, missing current ratio data raises liquidity concerns.
3. Stock Volatility
Amgen Inc.
- Beta at 0.47 suggests low market volatility; stable trading range supports investor confidence.
Pfizer Inc.
- Beta at 0.44 similarly low, but extremely high volume signals potential speculative trading.
4. Regulatory & Legal
Amgen Inc.
- Regulatory risk from drug approvals and patent challenges is moderate but manageable.
Pfizer Inc.
- Pfizer faces ongoing scrutiny due to COVID-19 vaccine mandates and pharmaceutical pricing debates.
5. Supply Chain & Operations
Amgen Inc.
- Global manufacturing presence mitigates supply disruptions but depends on biotech inputs.
Pfizer Inc.
- Complex vaccine production requires tight supply chain control; risks from geopolitical tensions.
6. ESG & Climate Transition
Amgen Inc.
- ESG initiatives in sustainable biotech production; moderate exposure to climate transition risks.
Pfizer Inc.
- Active ESG reporting but challenged by pharmaceutical waste and energy-intensive vaccine manufacturing.
7. Geopolitical Exposure
Amgen Inc.
- Primarily US-focused with international collaborations; moderate geopolitical risk.
Pfizer Inc.
- Significant global footprint with exposure to trade policies, especially in Europe and Asia.
Which company shows a better risk-adjusted profile?
Amgen’s most impactful risk is its elevated debt load, which strains financial flexibility despite strong operational metrics. Pfizer’s key risk lies in opaque liquidity ratios and geopolitical exposure amid global vaccine demand shifts. Amgen’s grey-zone Altman Z-score (2.32) and very strong Piotroski score (8) suggest better financial resilience. Pfizer’s absent Altman Z-score and average Piotroski (4) raise caution. The contrast in capital structure and financial health tips the risk-adjusted profile in Amgen’s favor for 2026 investors.
Final Verdict: Which stock to choose?
Amgen Inc. stands out with its superpower of sustained value creation, driven by a robust and growing ROIC well above its cost of capital. Its aggressive capital allocation fuels profitability and innovation. The point of vigilance lies in its relatively high leverage, which could pressure financial flexibility. It suits investors seeking aggressive growth with a strong moat.
Pfizer Inc. offers a strategic moat rooted in its diversified pharmaceutical portfolio and steady free cash flow generation. It presents a more conservative risk profile compared to Amgen, with lower leverage and a reliable dividend yield. However, its declining profitability metrics and value erosion demand caution. Pfizer fits well in portfolios favoring Growth at a Reasonable Price (GARP) with a defensive tilt.
If you prioritize capital efficiency and long-term value creation, Amgen outshines as the compelling choice due to its sustainable competitive advantage and accelerating growth trajectory. However, if you seek stability and dividend income with moderate growth, Pfizer offers better stability and income potential despite its recent operational challenges. Each scenario aligns with distinct investor risk tolerances and strategic goals.
Disclaimer: Investment carries a risk of loss of initial capital. The past performance is not a reliable indicator of future results. Be sure to understand risks before making an investment decision.
Go Further
I encourage you to read the complete analyses of Amgen Inc. and Pfizer Inc. to enhance your investment decisions: