Home > Comparison > Healthcare > MRK vs AMGN
The strategic rivalry between Merck & Co., Inc. and Amgen Inc. shapes the future of the healthcare sector. Merck operates as a diversified pharmaceutical and animal health powerhouse, while Amgen focuses on innovative human therapeutics with a strong emphasis on biologics. This analysis explores their contrasting operational models and investment profiles to identify which company delivers a superior risk-adjusted return for diversified portfolios. Understanding this duel is key for healthcare investors aiming to balance growth and stability.
Table of contents
Companies Overview
Merck & Co., Inc. and Amgen Inc. stand as titans in the global pharmaceutical arena, shaping healthcare innovation and delivery.
Merck & Co., Inc.: Global Healthcare Powerhouse
Merck dominates as a healthcare company operating worldwide in pharmaceuticals and animal health. Its core revenue derives from human health products, including oncology, immunology, and vaccines. In 2026, Merck sharpened its focus on developing long-acting HIV treatments through key collaborations, reinforcing its leadership in innovative therapeutics.
Amgen Inc.: Biotech Innovator
Amgen excels as a biotechnology firm specializing in human therapeutics across oncology, inflammation, and bone health. It generates revenue through a broad portfolio of specialty drugs like Enbrel and Neulasta. In 2026, Amgen emphasized pipeline expansion and strategic partnerships targeting oncology and autoimmune diseases to bolster its market position.
Strategic Collision: Similarities & Divergences
Both companies pursue innovative drug development but diverge in scale and scope: Merck integrates pharmaceuticals with animal health, while Amgen focuses on biotech specialty drugs. Their primary battleground lies in oncology and immunology markets. Investors face distinct profiles—Merck offers broad diversification, whereas Amgen presents concentrated exposure to biotech innovation and partnerships.
Income Statement Comparison
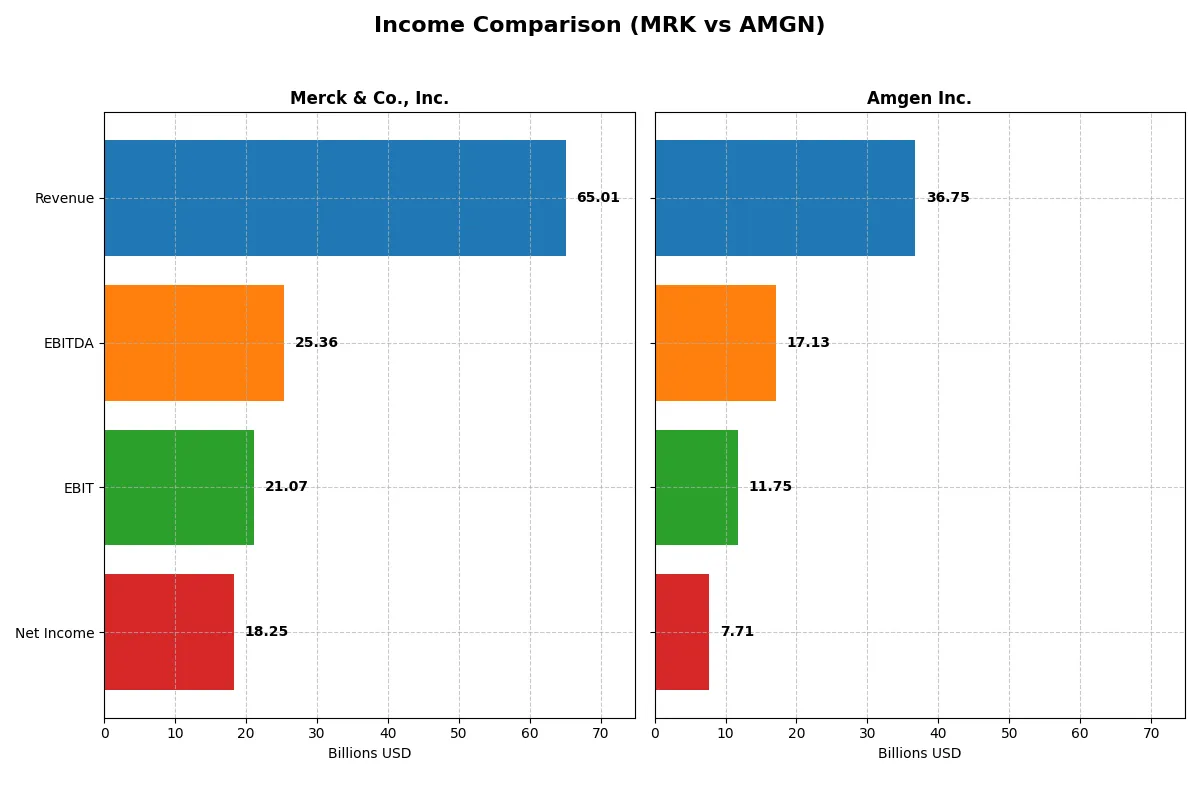
This data dissects the core profitability and scalability of both corporate engines to reveal who dominates the bottom line:
| Metric | Merck & Co., Inc. (MRK) | Amgen Inc. (AMGN) |
|---|---|---|
| Revenue | 65B | 37B |
| Cost of Revenue | 12B | 6.4B |
| Operating Expenses | 26B | 15B |
| Gross Profit | 53B | 30B |
| EBITDA | 25B | 17B |
| EBIT | 21B | 12B |
| Interest Expense | 0 | 2.8B |
| Net Income | 18B | 7.7B |
| EPS | 7.28 | 14.33 |
| Fiscal Year | 2025 | 2025 |
Income Statement Analysis: The Bottom-Line Duel
The income statement comparison reveals how efficiently each company converts revenue into profit, highlighting their operational strength and financial discipline.
Merck & Co., Inc. Analysis
Merck’s revenue climbed steadily from $48.7B in 2021 to $65B in 2025, with net income surging from $13B to $18.25B. Its gross margin remains robust at 81.5%, and net margin improved to 28.1%. Despite a slight dip in EBIT growth recently, Merck shows solid margin expansion and consistent EPS growth, signaling strong operational momentum.
Amgen Inc. Analysis
Amgen’s revenue grew from $26B in 2021 to $36.75B in 2025, with net income rising from $5.9B to $7.7B. It maintains a healthy gross margin of 82.5%, though net margin at 21% trails Merck’s. Amgen posted impressive one-year gains in revenue and EBIT, supported by a remarkable 88% EPS growth, reflecting accelerating profitability despite higher interest costs.
Margin Strength vs. Growth Momentum
Merck leads with superior net margin and consistent profit growth, demonstrating disciplined cost control and operational efficiency. Amgen excels in revenue and earnings momentum, posting rapid growth and strong EPS gains but with a lower net margin. Investors seeking stable margin power may prefer Merck, while those favoring growth momentum might lean toward Amgen’s dynamic expansion.
Financial Ratios Comparison
These vital ratios act as a diagnostic tool to expose the underlying fiscal health, valuation premiums, and capital efficiency of the companies compared below:
| Ratios | Merck & Co., Inc. (MRK) | Amgen Inc. (AMGN) |
|---|---|---|
| ROE | 35.2% | 89.1% |
| ROIC | N/A | 18.4% |
| P/E | 14.5 | 22.8 |
| P/B | 5.1 | 20.3 |
| Current Ratio | 0 (missing) | 1.14 |
| Quick Ratio | 0 (missing) | 0.90 |
| D/E (Debt/Equity) | 0 (missing) | 6.31 |
| Debt-to-Assets | 0 (missing) | 60.3% |
| Interest Coverage | 0 (missing) | 5.41 |
| Asset Turnover | 0 (missing) | 0.41 |
| Fixed Asset Turnover | 0 (missing) | 4.64 |
| Payout ratio | 45.1% | 66.4% |
| Dividend yield | 3.12% | 2.91% |
| Fiscal Year | 2025 | 2025 |
Efficiency & Valuation Duel: The Vital Signs
Financial ratios serve as a company’s DNA, uncovering hidden risks and operational strengths essential for informed investment decisions.
Merck & Co., Inc.
Merck demonstrates robust profitability with a 35.17% ROE and a strong 28.08% net margin, signaling efficient core operations. Its P/E ratio of 14.46 suggests the stock trades at a reasonable valuation. Shareholders benefit from a 3.12% dividend yield, reflecting steady returns alongside reinvestment in R&D, which supports sustained growth.
Amgen Inc.
Amgen boasts an exceptional 89.06% ROE and a solid 20.98% net margin, marking high operational efficiency. However, its P/E of 22.84 indicates a relatively stretched valuation. The company returns value through a 2.91% dividend yield but carries significant debt, which tempers its risk profile despite strong capital returns.
Balanced Strengths vs. Elevated Expectations
Merck offers a more balanced risk-reward profile with favorable profitability and reasonable valuation metrics. Amgen’s impressive returns are offset by higher leverage and stretched valuation. Investors seeking stability may prefer Merck, while those favoring growth with higher risk might consider Amgen’s profile.
Which one offers the Superior Shareholder Reward?
I compare Merck & Co., Inc. (MRK) and Amgen Inc. (AMGN) on dividends and buybacks. MRK yields 3.1% with a 46% payout ratio, supported by strong free cash flow. AMGN yields slightly less at 2.9%, with a higher 66% payout. Both sustain dividends comfortably, but AMGN’s debt leverage and high payout raise risk. MRK’s moderate payout and steady buybacks offer a more balanced, sustainable shareholder return. I favor MRK for superior total return potential in 2026.
Comparative Score Analysis: The Strategic Profile
The radar chart reveals the fundamental DNA and trade-offs of Merck & Co., Inc. and Amgen Inc., highlighting their financial strengths and valuation nuances:
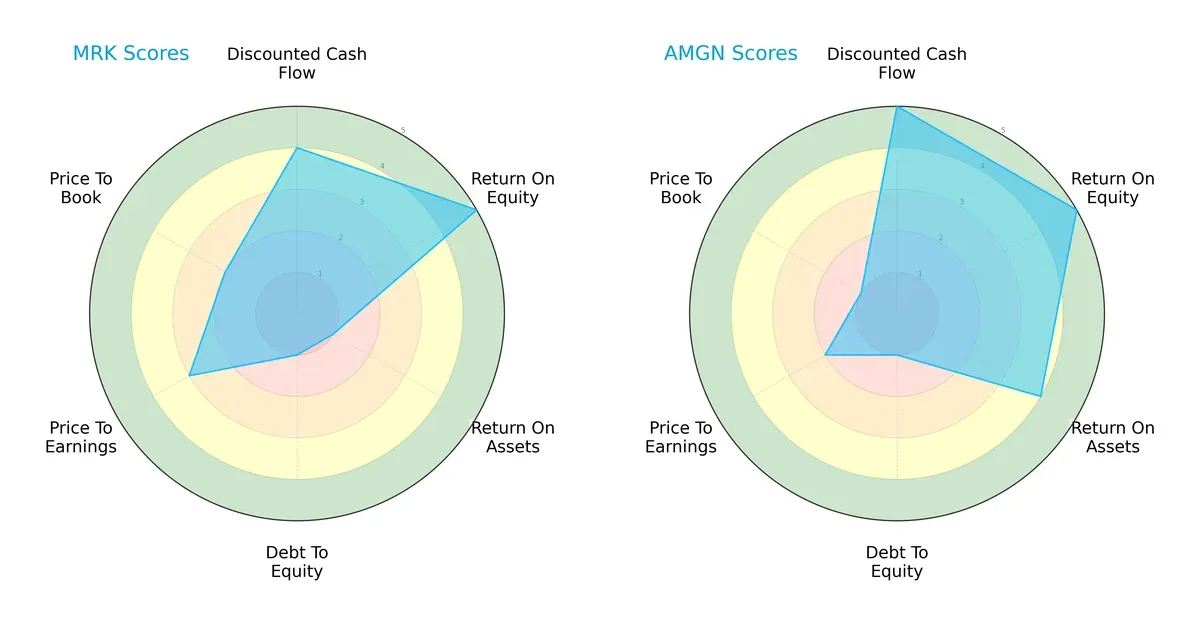
Amgen leads with a stronger DCF (5 vs. 4) and ROA (4 vs. 1), indicating superior asset efficiency and growth prospects. Both tie on ROE (5), reflecting equal shareholder returns. Merck scores poorly on Debt/Equity (1) and ROA, signaling balance sheet and operational challenges. Amgen’s profile is more balanced but leans on asset productivity, while Merck relies on equity returns with weaker leverage control.
Financial Health: Quality of Operations
Amgen’s Piotroski F-Score of 8 outperforms Merck’s 6, signaling stronger operational fundamentals and fewer financial red flags:
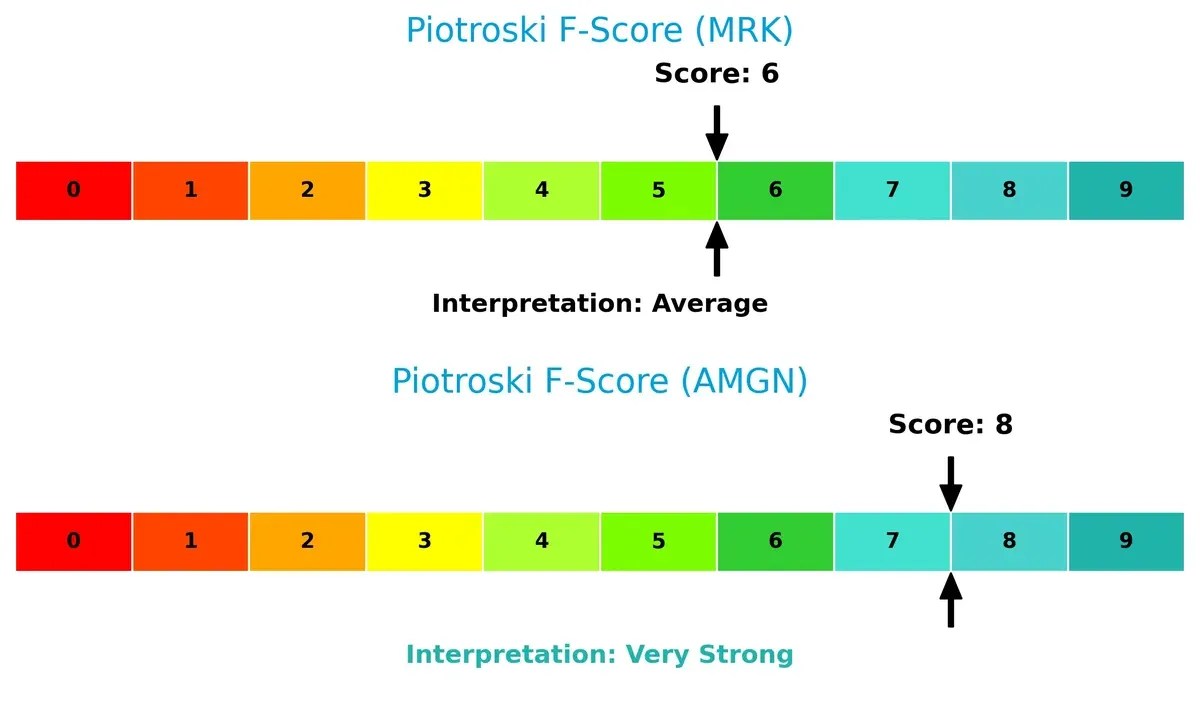
Amgen demonstrates robust profitability, liquidity, and efficiency metrics. Merck’s average score suggests moderate financial health but potential vulnerabilities in internal controls or asset management.
Bankruptcy Risk: Solvency Showdown
Merck lacks an Altman Z-Score, preventing direct solvency comparison. Amgen’s 2.32 places it in the grey zone, implying moderate bankruptcy risk under current market conditions:

This score warrants caution, as Amgen is neither in a safe zone nor distress, highlighting the need for vigilant risk monitoring in volatile cycles.
How are the two companies positioned?
This section dissects the operational DNA of Merck and Amgen by comparing their revenue distribution and internal dynamics. The goal is to confront their economic moats to identify which model offers the most resilient and sustainable competitive advantage today.
Revenue Segmentation: The Strategic Mix
This comparison dissects how Merck & Co., Inc. and Amgen Inc. diversify income and reveal where their primary sector bets lie:
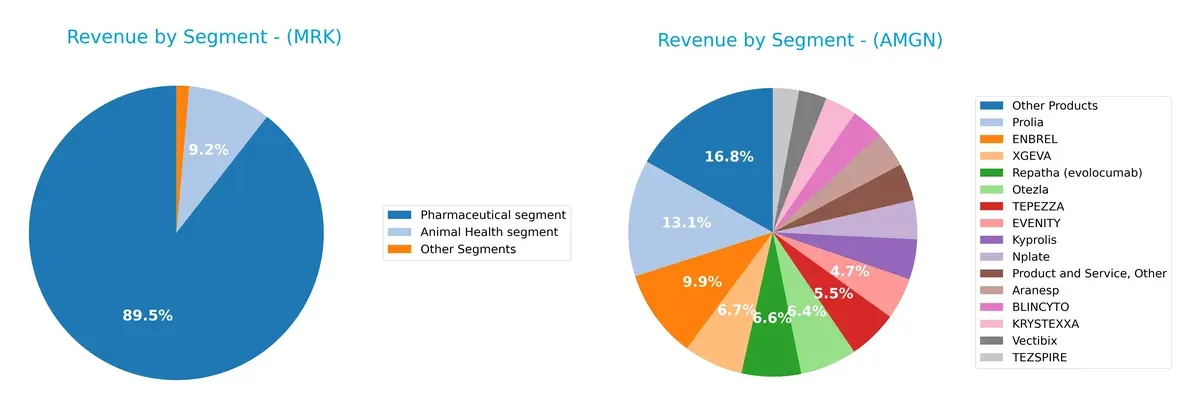
Merck anchors revenue in its Pharmaceutical segment, generating $57.4B in 2024, dwarfing its Animal Health ($5.9B) and Other Segments ($0.9B). Amgen’s revenue spreads across many products, with no single segment exceeding $4.4B. This diversification reduces concentration risk for Amgen, while Merck’s focus signals strong pharmaceutical ecosystem dominance but higher dependency on one sector.
Strengths and Weaknesses Comparison
This table compares the Strengths and Weaknesses of Merck & Co., Inc. and Amgen Inc.:
Merck & Co., Inc. Strengths
- Diverse revenue streams from Pharmaceutical (57B) and Animal Health (5.9B) segments
- Favorable net margin (28.08%) and ROE (35.17%)
- Strong dividend yield (3.12%)
- Favorable WACC (5.23%) and low debt metrics
- Significant global presence with 32B US and 20B international sales
Amgen Inc. Strengths
- Broad product portfolio with multiple top-selling drugs generating billions
- High ROE (89.06%) and favorable ROIC (18.35%)
- Favorable fixed asset turnover (4.64)
- Solid dividend yield (2.91%)
- Large US market share (24B) complemented by substantial Non-US sales (9.6B)
Merck & Co., Inc. Weaknesses
- Unfavorable ROIC (0%) and asset turnover ratios
- Low liquidity indicated by zero current and quick ratios
- High PB ratio (5.08) signals potential overvaluation
- Heavy reliance on Pharmaceutical segment limits diversification
Amgen Inc. Weaknesses
- High debt levels with unfavorable debt-to-assets ratio (60.28%) and D/E (6.31)
- Neutral current and quick ratios suggest liquidity constraints
- Unfavorable PB ratio (20.34) and asset turnover (0.41)
- Moderate interest coverage ratio (4.27) limits financial flexibility
Both companies show robust profitability but face liquidity and valuation challenges. Merck’s weaknesses in asset efficiency contrast with Amgen’s high leverage, shaping distinct capital allocation and risk profiles.
The Moat Duel: Analyzing Competitive Defensibility
A structural moat is the only reliable shield protecting long-term profits from relentless competitive erosion:
Merck & Co., Inc. (MRK): Innovation-Dependent Intangible Assets
Merck’s moat stems from strong intangible assets and R&D-driven drug pipelines. Yet, declining ROIC signals eroding capital efficiency. New vaccines and therapies in 2026 face intensified competition risks.
Amgen Inc. (AMGN): High-ROIC Biotech Efficiency
Amgen leverages proprietary biologics with a robust, growing ROIC above WACC, unlike Merck. Its expanding product portfolio and strategic collaborations strengthen its durable competitive advantage.
Capital Efficiency vs. Innovation Scale: The Moat Showdown
Amgen’s growing ROIC and value creation give it a wider, deeper moat than Merck’s deteriorating capital returns. Amgen stands better poised to defend market share amid rising biotech competition.
Which stock offers better returns?
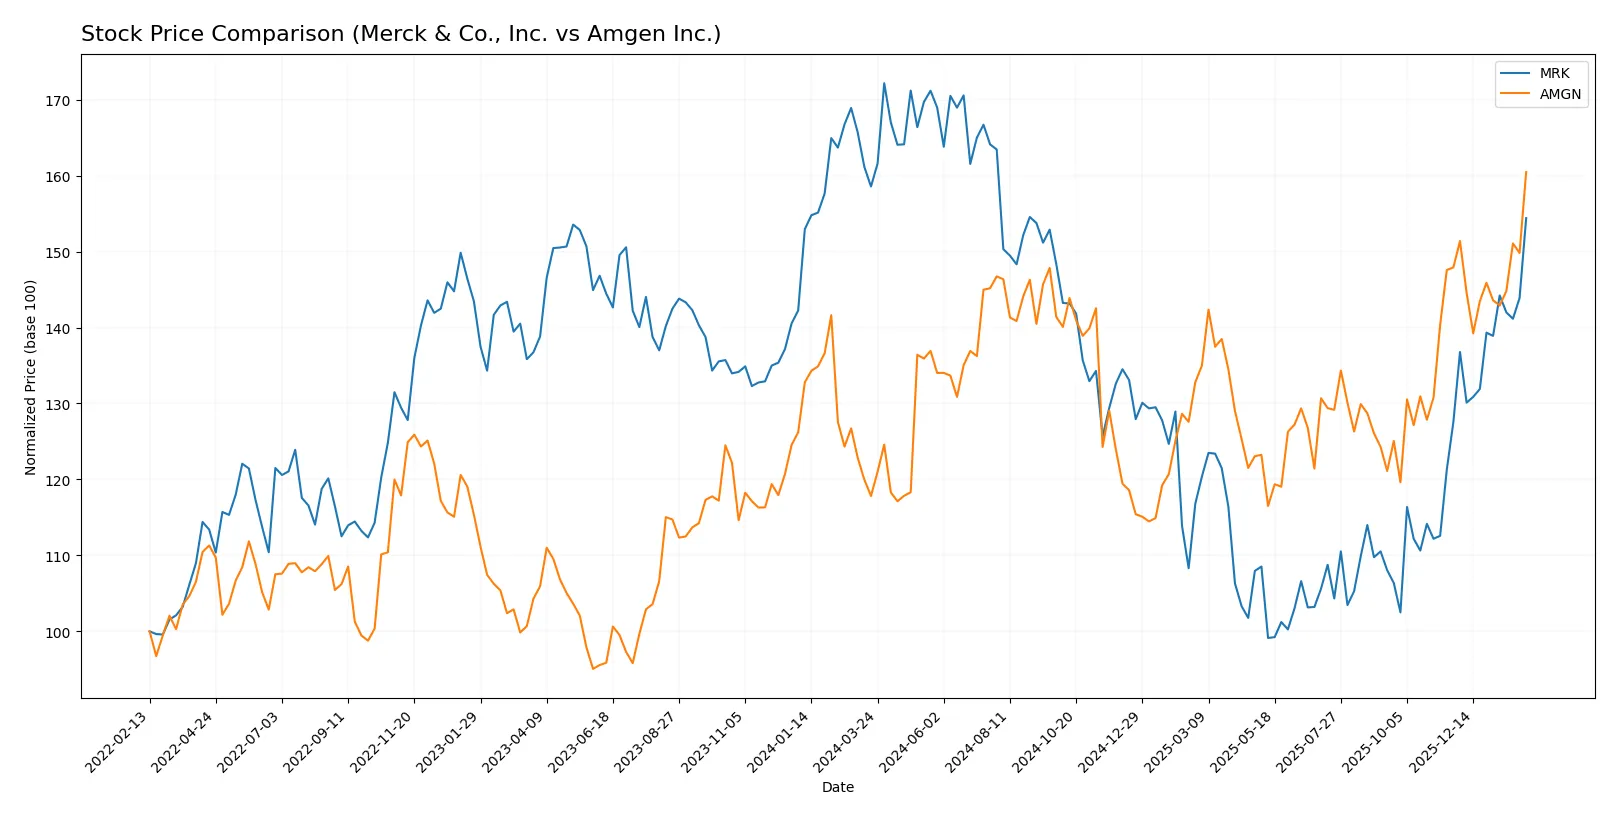
Over the past 12 months, both Merck & Co., Inc. and Amgen Inc. exhibited notable price movements, with Amgen showing strong overall gains and Merck demonstrating recent accelerated recovery after a longer bearish phase.
Trend Comparison
Merck’s stock declined by 2.63% over the last year, marking a bearish trend with accelerating downward momentum. The price ranged widely between 75.97 and 131.95, showing high volatility (std deviation 17.44).
Amgen’s stock rose 36.2% over the same period, reflecting a bullish trend with accelerating gains. The price fluctuated between 261.22 and 366.2, supported by elevated volatility (std deviation 23.79).
Comparing both, Amgen delivered significantly higher market performance with sustained bullish momentum, while Merck showed a bearish trend overall but recent price acceleration.
Target Prices
Analysts present a bullish consensus for both Merck & Co., Inc. and Amgen Inc., signaling potential upside from current prices.
| Company | Target Low | Target High | Consensus |
|---|---|---|---|
| Merck & Co., Inc. | 90 | 136 | 119.91 |
| Amgen Inc. | 309 | 425 | 364.09 |
Merck’s consensus target price of $119.91 slightly exceeds its current $118.34 share price, suggesting moderate upside. Amgen’s target consensus at $364.09 aligns closely with its current $366.20 price, indicating a balanced risk-reward profile.

Don’t Let Luck Decide Your Entry Point
Optimize your entry points with our advanced ProRealTime indicators. You’ll get efficient buy signals with precise price targets for maximum performance. Start outperforming now!
How do institutions grade them?
Here is a summary of the latest institutional grades for Merck & Co., Inc. and Amgen Inc.:
Merck & Co., Inc. Grades
The table below shows recent grade updates from key grading firms for Merck & Co., Inc.:
| Grading Company | Action | New Grade | Date |
|---|---|---|---|
| Wells Fargo | Maintain | Overweight | 2026-02-04 |
| Citigroup | Maintain | Neutral | 2026-02-04 |
| Cantor Fitzgerald | Maintain | Neutral | 2026-02-04 |
| TD Cowen | Maintain | Hold | 2026-01-20 |
| Wolfe Research | Upgrade | Outperform | 2026-01-08 |
| UBS | Maintain | Buy | 2026-01-07 |
| BMO Capital | Upgrade | Outperform | 2025-12-18 |
| B of A Securities | Maintain | Buy | 2025-12-15 |
Amgen Inc. Grades
The table below outlines recent grades for Amgen Inc. from recognized institutions:
| Grading Company | Action | New Grade | Date |
|---|---|---|---|
| Morgan Stanley | Maintain | Equal Weight | 2026-02-04 |
| Leerink Partners | Maintain | Outperform | 2026-02-04 |
| Citigroup | Maintain | Neutral | 2026-02-04 |
| Cantor Fitzgerald | Maintain | Neutral | 2026-02-04 |
| UBS | Maintain | Buy | 2026-01-26 |
| Bernstein | Downgrade | Market Perform | 2026-01-20 |
| Truist Securities | Maintain | Hold | 2026-01-08 |
| BMO Capital | Maintain | Outperform | 2025-12-03 |
Which company has the best grades?
Merck & Co., Inc. consistently receives higher ratings, including multiple “Outperform” and “Buy” grades. Amgen’s grades are mixed, with downgrades and more “Neutral” or “Equal Weight” ratings. This disparity may influence investor perception of relative growth and risk.
Risks specific to each company
The following categories identify the critical pressure points and systemic threats facing both firms in the 2026 market environment:
1. Market & Competition
Merck & Co., Inc.
- Operates in broad pharmaceutical segments with strong collaborations, but faces intense competition in oncology and vaccines.
Amgen Inc.
- Focused on inflammation and oncology with numerous R&D partnerships, competing in specialized biologics markets.
2. Capital Structure & Debt
Merck & Co., Inc.
- Exhibits a very low debt-to-equity ratio and excellent interest coverage, indicating strong financial stability.
Amgen Inc.
- Carries higher leverage with debt-to-assets over 60%, posing financial risk despite moderate interest coverage.
3. Stock Volatility
Merck & Co., Inc.
- Low beta of 0.296 suggests defensive stock behavior and lower market volatility.
Amgen Inc.
- Slightly higher beta at 0.472, indicating greater sensitivity to market swings.
4. Regulatory & Legal
Merck & Co., Inc.
- Faces regulatory scrutiny typical of large pharma, especially in oncology and vaccines.
Amgen Inc.
- Regulatory risk heightened by focus on novel biologics and complex clinical trial pathways.
5. Supply Chain & Operations
Merck & Co., Inc.
- Global operations with diversified supply chains reduce risk but require robust management.
Amgen Inc.
- Smaller workforce and concentrated operations may increase vulnerability to supply disruptions.
6. ESG & Climate Transition
Merck & Co., Inc.
- Advanced ESG initiatives aligned with industry best practices, supporting sustainable growth.
Amgen Inc.
- Strong ESG focus but higher exposure to climate transition risks due to supply chain concentration.
7. Geopolitical Exposure
Merck & Co., Inc.
- Global footprint spreads geopolitical risk but exposes it to trade tensions and regulatory changes.
Amgen Inc.
- US-centric operations limit geopolitical risk but reduce diversification benefits.
Which company shows a better risk-adjusted profile?
Merck’s low debt and defensive stock beta create a sturdier risk profile. Amgen’s high leverage and moderate volatility raise financial risk despite strong profitability. Merck’s robust capital structure and stable cash flow outweigh Amgen’s operational and debt concerns. The key risk for Merck lies in regulatory pressures, while Amgen’s debt load is the primary vulnerability. Notably, Amgen’s debt-to-assets ratio above 60% justifies caution despite its growth potential.
Final Verdict: Which stock to choose?
Merck & Co., Inc. (MRK) excels as a cash-generating powerhouse with a solid net margin and strong return on equity. Its main point of vigilance is a declining return on invested capital, signaling potential challenges in sustaining long-term value creation. MRK fits best in portfolios targeting steady income and moderate growth.
Amgen Inc. (AMGN) boasts a strategic moat through its efficient capital allocation and growing ROIC well above its cost of capital. Its safety profile is somewhat compromised by higher leverage compared to MRK but offset by robust earnings growth and a very strong Piotroski score. AMGN suits growth-at-a-reasonable-price (GARP) investors seeking expanding profitability.
If you prioritize consistent cash generation and dividend income, MRK is the compelling choice due to its stable margins and favorable income statement. However, if you seek growth backed by a sustainable competitive advantage and improving returns, AMGN offers better stability in value creation and commands a premium for its superior capital efficiency.
Disclaimer: Investment carries a risk of loss of initial capital. The past performance is not a reliable indicator of future results. Be sure to understand risks before making an investment decision.
Go Further
I encourage you to read the complete analyses of Merck & Co., Inc. and Amgen Inc. to enhance your investment decisions: