Home > Comparison > Healthcare > JNJ vs AMGN
The strategic rivalry between Johnson & Johnson and Amgen Inc. shapes the future of the healthcare sector. Johnson & Johnson operates as a diversified healthcare giant with strong MedTech and Innovative Medicine segments. Amgen Inc. focuses on biologics and specialty pharmaceuticals with a leaner operational model. This head-to-head pits broad-based innovation against targeted therapeutic expertise. This analysis aims to identify which trajectory offers superior risk-adjusted returns for diversified investors.
Table of contents
Companies Overview
Johnson & Johnson and Amgen Inc. dominate the healthcare sector with distinct approaches to drug manufacturing and innovation.
Johnson & Johnson: Healthcare Conglomerate with Focused Innovation
Johnson & Johnson leads as a diversified healthcare giant with a $586B market cap. It generates revenue primarily from its Innovative Medicine and MedTech segments after spinning off Consumer Health in 2023. The company’s 2026 strategy centers on advancing prescription drugs for complex diseases and expanding cutting-edge medical devices, reinforcing its competitive edge in hospital and professional healthcare markets.
Amgen Inc.: Biotech Powerhouse Driving Therapeutics
Amgen is a biotechnology leader with a $199B market cap, specializing in human therapeutics across inflammation, oncology, and bone health. It earns revenue through a robust portfolio including Enbrel, Neulasta, and Repatha. In 2026, Amgen emphasizes strategic collaborations and pipeline development for autoimmune and cancer treatments, aiming to enhance its scientific innovation and market penetration in specialty care.
Strategic Collision: Similarities & Divergences
Both companies excel in drug manufacturing but differ in scope and scale—Johnson & Johnson operates a broad healthcare ecosystem, while Amgen focuses on specialized biopharmaceutical innovation. The primary battleground is prescription pharmaceuticals for chronic and complex diseases. Their investment profiles diverge: Johnson & Johnson offers stability through diversification, whereas Amgen presents growth potential via focused biotech advancements.
Income Statement Comparison
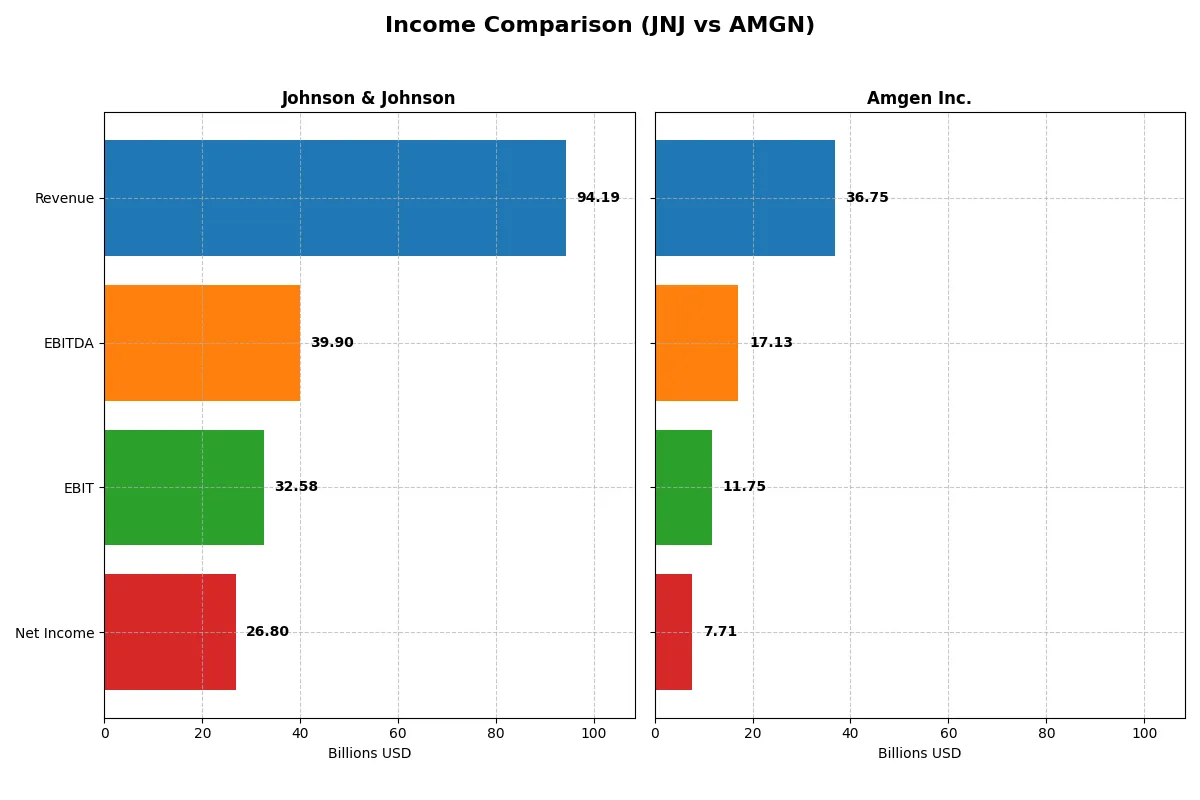
This data dissects the core profitability and scalability of both corporate engines to reveal who dominates the bottom line:
| Metric | Johnson & Johnson (JNJ) | Amgen Inc. (AMGN) |
|---|---|---|
| Revenue | 94.2B | 36.8B |
| Cost of Revenue | 25.6B | 6.4B |
| Operating Expenses | 42.96B | 15.44B |
| Gross Profit | 68.6B | 30.3B |
| EBITDA | 39.9B | 17.1B |
| EBIT | 32.6B | 11.8B |
| Interest Expense | 0.97B | 2.76B |
| Net Income | 26.8B | 7.71B |
| EPS | 11.03 | 14.33 |
| Fiscal Year | 2025 | 2025 |
Income Statement Analysis: The Bottom-Line Duel
This income statement comparison reveals how efficiently Johnson & Johnson and Amgen power their businesses through revenue and profit dynamics.
Johnson & Johnson Analysis
Johnson & Johnson’s revenue grew steadily, reaching $94.2B in 2025, with net income surging to $26.8B. Its gross margin remains robust at 72.8%, reflecting strong cost control. Net margin expanded favorably to 28.5%, driven by an 87% EBIT growth, signaling impressive operational momentum and disciplined expense management.
Amgen Inc. Analysis
Amgen’s revenue rose to $36.8B in 2025, with net income climbing to $7.7B. The company boasts an even higher gross margin of 82.5%, but a lower net margin of 21.0%. Despite a solid 51% EBIT growth, its interest expense ratio at 7.5% weighs on profitability, indicating capital structure pressure and room for efficiency gains.
Margin Dominance vs. Revenue Muscle
Johnson & Johnson leverages scale with superior net margin and EBIT growth, highlighting operational excellence. Amgen delivers higher gross margin but faces challenges in net margin due to interest costs. For investors prioritizing bottom-line strength and margin resilience, Johnson & Johnson’s profile currently stands out as the more attractive choice.
Financial Ratios Comparison
These vital ratios act as a diagnostic tool to expose underlying fiscal health, valuation premiums, and capital efficiency for Johnson & Johnson and Amgen Inc.:
| Ratios | Johnson & Johnson (JNJ) | Amgen Inc. (AMGN) |
|---|---|---|
| ROE | 32.9% | 89.1% |
| ROIC | 13.7% | 18.4% |
| P/E | 18.8 | 22.8 |
| P/B | 6.18 | 20.3 |
| Current Ratio | 1.03 | 1.14 |
| Quick Ratio | 0.77 | 0.90 |
| D/E (Debt-to-Equity) | 0.59 | 6.31 |
| Debt-to-Assets | 24.1% | 60.3% |
| Interest Coverage | 26.4 | 5.41 |
| Asset Turnover | 0.47 | 0.41 |
| Fixed Asset Turnover | 4.07 | 4.64 |
| Payout ratio | 46.2% | 66.4% |
| Dividend yield | 2.46% | 2.91% |
| Fiscal Year | 2025 | 2025 |
Efficiency & Valuation Duel: The Vital Signs
Ratios act as a company’s DNA, uncovering hidden risks and operational excellence that shape investment decisions with clarity and precision.
Johnson & Johnson
Johnson & Johnson displays strong profitability with a 33% ROE and a robust 28.5% net margin, signaling operational efficiency. Its P/E ratio of 18.8 suggests a fairly valued stock, though a high P/B ratio flags some premium pricing. The company rewards shareholders with a 2.46% dividend yield, reflecting stable income and capital discipline.
Amgen Inc.
Amgen’s profitability impresses with an extraordinary 89% ROE and a solid 21% net margin, demonstrating high capital efficiency. Its P/E ratio at 22.8 is neutral but paired with a steep P/B of 20.3 and elevated leverage, it feels stretched. The 2.91% dividend yield complements a strategy balancing returns amid higher debt levels.
Premium Valuation vs. Operational Safety
Johnson & Johnson offers a balanced risk profile with efficient returns and moderate valuation. Amgen delivers superior ROE but carries significant leverage and valuation premiums. Investors seeking operational safety may prefer Johnson & Johnson, while those favoring aggressive growth might lean toward Amgen’s high-return profile.
Which one offers the Superior Shareholder Reward?
I compare Johnson & Johnson (JNJ) and Amgen Inc. (AMGN) on dividends and buybacks for 2025. JNJ yields 2.46% with a 46% payout ratio, covering dividends 1.43x with FCF, reflecting a balanced, sustainable model. AMGN yields 2.91% but pays out 66% of net income and carries high debt, risking sustainability. JNJ’s moderate buybacks and strong cash flow contrast with AMGN’s aggressive leverage and buybacks. I see JNJ’s shareholder reward as superior for 2026 due to its prudent capital allocation and sustainable distributions.
Comparative Score Analysis: The Strategic Profile
The radar chart reveals the fundamental DNA and trade-offs of Johnson & Johnson and Amgen Inc., highlighting their distinct financial strengths and vulnerabilities:
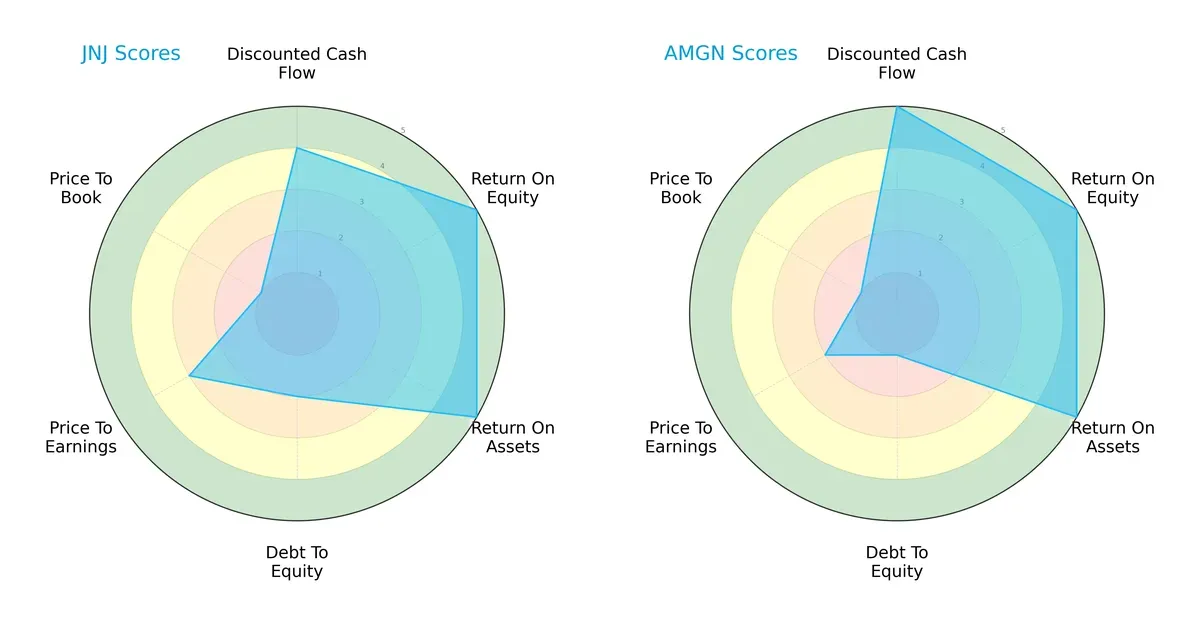
Johnson & Johnson displays a more balanced profile with solid DCF (4), ROE (5), and ROA (5) scores but struggles with higher debt risk (Debt/Equity 2) and weak valuation metrics (P/B 1). Amgen leverages a strong DCF advantage (5) and equally robust profitability scores but carries even higher leverage risk (Debt/Equity 1) and less attractive valuation (P/E 2). JNJ’s diversified strength contrasts with AMGN’s reliance on cash flow efficiency.
Bankruptcy Risk: Solvency Showdown
Johnson & Johnson’s Altman Z-Score of 5.18 places it safely above distress, while Amgen’s 2.34 signals moderate risk. This gap implies:
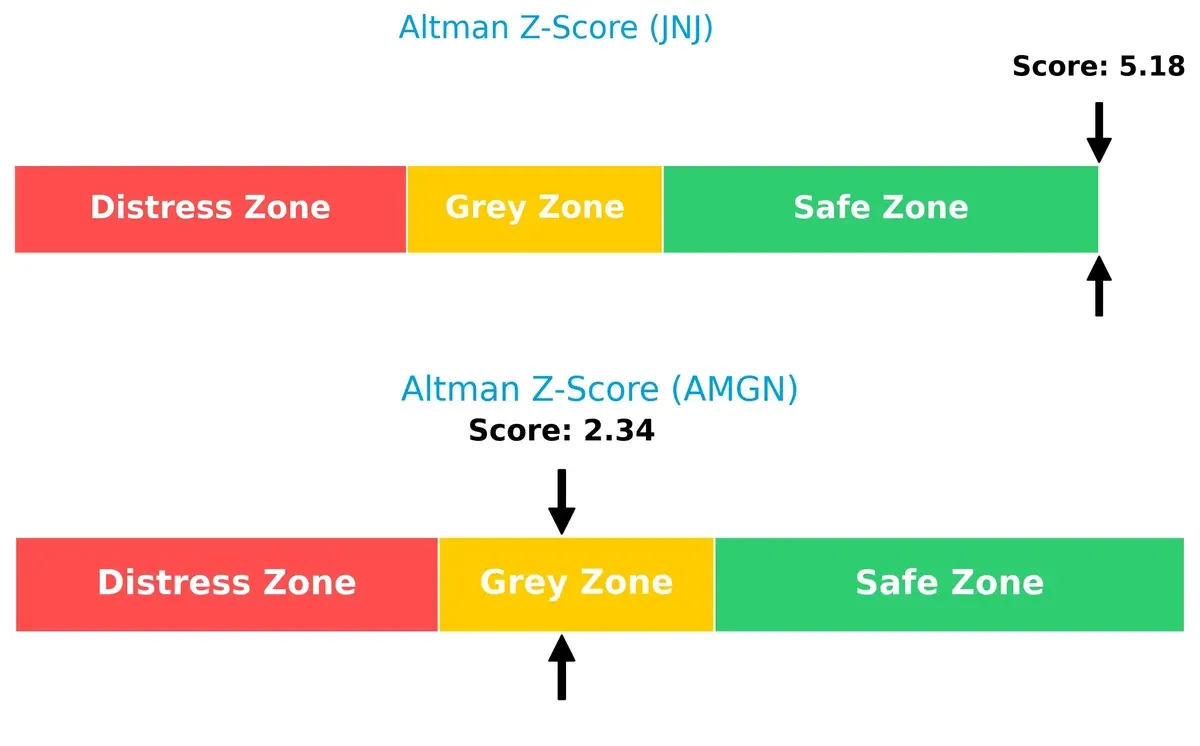
JNJ is well-positioned to weather economic downturns, whereas AMGN faces a grey zone risk, warranting caution for long-term survival amid market volatility.
Financial Health: Quality of Operations
Amgen’s Piotroski score of 8 indicates very strong operational health and internal controls. Johnson & Johnson’s score of 4 suggests average financial quality, with potential red flags:
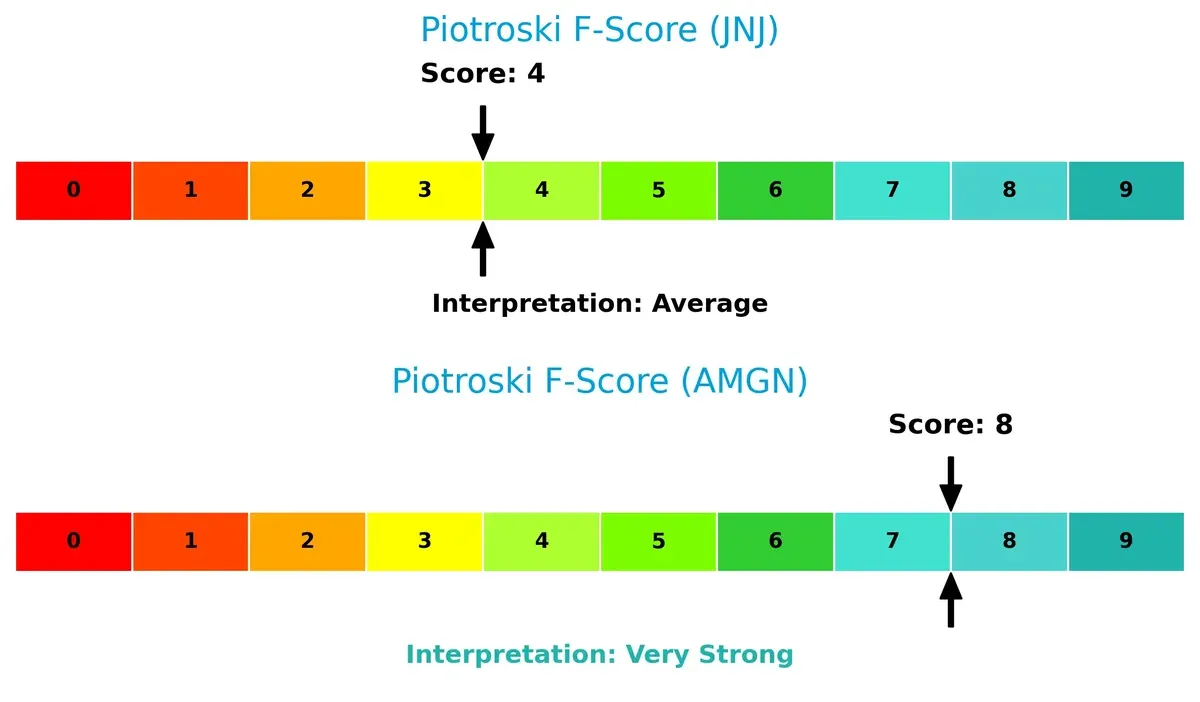
AMGN’s superior internal metrics reflect greater efficiency and profitability sustainability. JNJ’s middling score hints at areas needing improvement to match Amgen’s operational rigor.
How are the two companies positioned?
This section dissects JNJ and AMGN’s operational DNA by comparing their revenue distribution and internal dynamics. The goal is to confront their economic moats to identify which model offers the most resilient, sustainable competitive advantage today.
Revenue Segmentation: The Strategic Mix
This visual comparison dissects how Johnson & Johnson and Amgen Inc. diversify their income streams and where their primary sector bets lie:
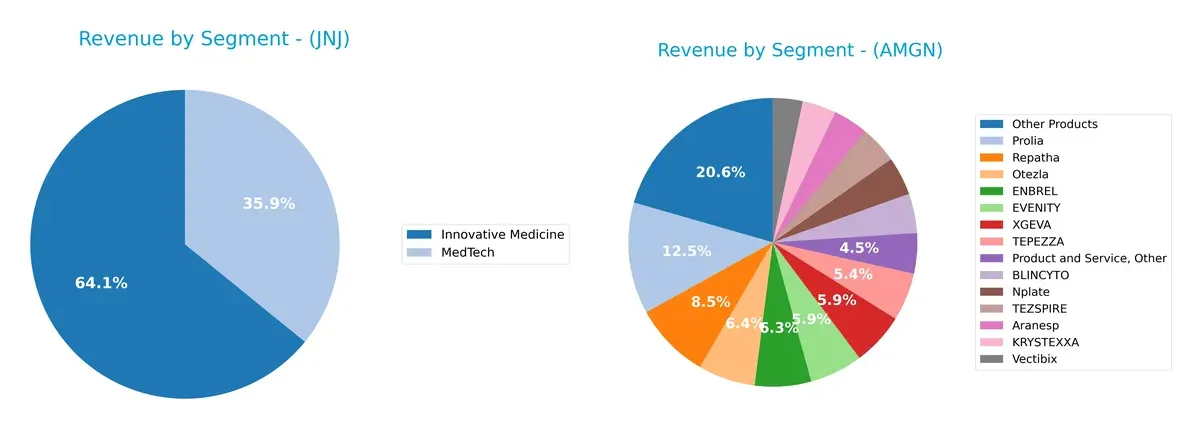
Johnson & Johnson anchors revenue in two broad segments: Innovative Medicine at $60.4B and MedTech at $33.8B for 2025, showing a balanced, diversified portfolio. Amgen Inc. relies on multiple specialized products, with Prolia at $4.4B and Other Products at $7.3B dominating, but no single segment dwarfs others as much as JNJ’s top lines. JNJ’s broad ecosystem reduces concentration risk; Amgen’s product-heavy mix pivots on biotech innovation and market exclusivity.
Strengths and Weaknesses Comparison
This table compares the Strengths and Weaknesses of Johnson & Johnson and Amgen Inc.:
Johnson & Johnson Strengths
- Diversified revenue streams across innovative medicine, MedTech, and consumer segments
- Strong profitability with 28.46% net margin and 32.87% ROE
- Favorable capital efficiency with 13.71% ROIC below 5.1% WACC
- Solid global presence with $53.8B US and $36.1B international revenue
- Consistent dividend yield at 2.46%
- Favorable debt metrics with 24.06% debt-to-assets
Amgen Inc. Strengths
- High profitability with 20.98% net margin and exceptional 89.06% ROE
- ROIC of 18.35% well above 5.53% WACC indicates strong capital allocation
- Focused product portfolio with leading biologics like Prolia and Enbrel
- Higher dividend yield at 2.91%
- Favorable fixed asset turnover at 4.64
Johnson & Johnson Weaknesses
- Quick ratio at 0.77 signals potential short-term liquidity risk
- Elevated price-to-book ratio at 6.18 compared to sector norms
- Asset turnover of 0.47 below ideal efficiency standards
- Moderate leverage with 0.59 debt-to-equity, though manageable
Amgen Inc. Weaknesses
- High leverage with 6.31 debt-to-equity and 60.28% debt-to-assets raises financial risk
- Interest coverage at 4.27 is borderline for debt servicing
- Price-to-book ratio of 20.34 appears stretched
- Asset turnover lagging at 0.41
Johnson & Johnson’s broad diversification and solid balance sheet contrast with Amgen’s concentrated biologics focus and higher leverage. Each company’s strengths and weaknesses suggest distinct strategic priorities between robust financial health versus aggressive growth and capital deployment.
The Moat Duel: Analyzing Competitive Defensibility
A structural moat is the only shield protecting long-term profits from relentless competition’s erosion. Let’s dissect how Johnson & Johnson and Amgen defend their turf:
Johnson & Johnson: Diversified Innovation and Scale Moat
JNJ’s moat stems from its broad innovation pipeline and global scale, delivering stable margins and a high ROIC above WACC by 8.6%. Despite a slight ROIC decline, new medtech advances and oncology drugs could reinforce its position in 2026.
Amgen Inc.: Focused Biotech Excellence Moat
AMGN leverages specialized biotechnology with a stronger ROIC premium of 12.8% over WACC and a growing profitability trend. Its deep specialization contrasts with JNJ’s diversification, positioning Amgen for expanding oncology and autoimmune markets in 2026.
Moat Strength Faceoff: Scale and Innovation vs. Focused Biotech Edge
Amgen’s wider and deeper moat benefits from rising ROIC and biotech specialization, while Johnson & Johnson’s scale and innovation breadth sustain value but show margin pressure. Amgen appears better equipped to defend and grow market share amid intensifying biotech competition.
Which stock offers better returns?
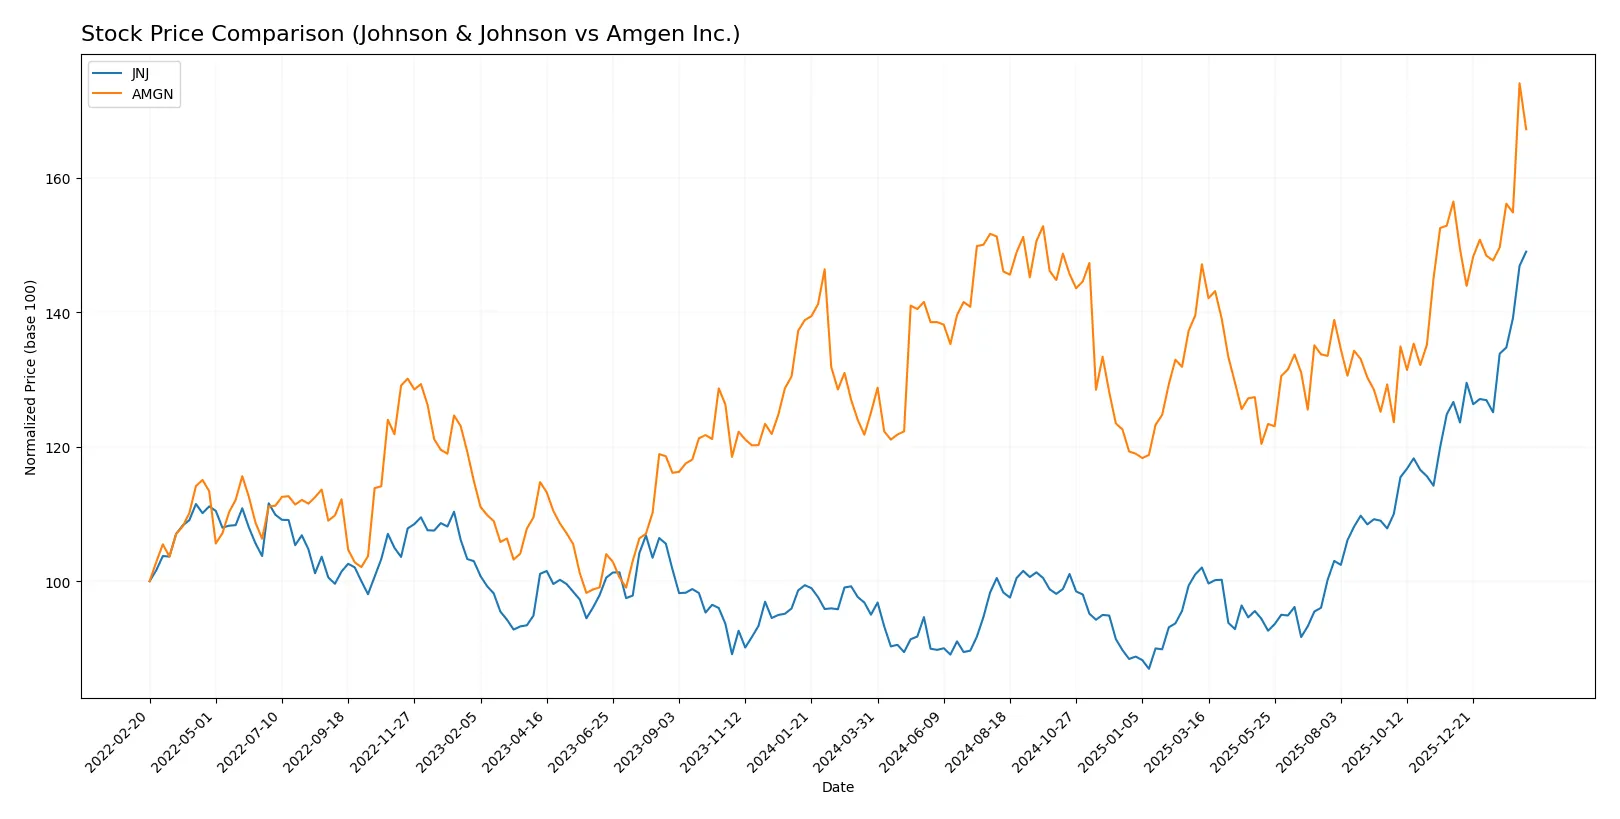
Over the past 12 months, both Johnson & Johnson and Amgen Inc. showed strong upward price momentum, with JNJ exhibiting sharper gains and a clear acceleration in trend.
Trend Comparison
Johnson & Johnson’s stock rose 56.83% over the past year, marking a bullish trend with accelerating momentum and a high volatility of 22.57%. The price ranged from 142.06 to 243.45, confirming strong market interest.
Amgen Inc.’s stock gained 33.68% in the same period, also bullish with acceleration but higher volatility at 24.99%. Its price fluctuated between 261.22 and 384.32, demonstrating significant but more tempered gains.
JNJ outperformed AMGN by a wide margin, delivering superior market returns and stronger trend acceleration over the past year.
Target Prices
Analyst consensus shows measured optimism for both Johnson & Johnson and Amgen Inc.
| Company | Target Low | Target High | Consensus |
|---|---|---|---|
| Johnson & Johnson | 190 | 265 | 229.33 |
| Amgen Inc. | 295 | 425 | 358.33 |
Analysts expect Johnson & Johnson’s stock to trade slightly below its current price of $243.45. Amgen’s consensus target is just below its current $369.19, signaling moderate upside potential.

Don’t Let Luck Decide Your Entry Point
Optimize your entry points with our advanced ProRealTime indicators. You’ll get efficient buy signals with precise price targets for maximum performance. Start outperforming now!
How do institutions grade them?
Here is a comparison of the recent grades assigned to Johnson & Johnson and Amgen Inc. by major grading companies:
Johnson & Johnson Grades
The table below shows recent grades from reputable grading companies for Johnson & Johnson:
| Grading Company | Action | New Grade | Date |
|---|---|---|---|
| RBC Capital | maintain | Outperform | 2026-02-03 |
| Morgan Stanley | upgrade | Overweight | 2026-01-28 |
| Freedom Capital Markets | maintain | Hold | 2026-01-27 |
| Guggenheim | maintain | Buy | 2026-01-23 |
| Citigroup | maintain | Buy | 2026-01-22 |
| Wells Fargo | maintain | Overweight | 2026-01-22 |
| TD Cowen | maintain | Buy | 2026-01-22 |
| Morgan Stanley | maintain | Equal Weight | 2026-01-22 |
| Stifel | maintain | Hold | 2026-01-22 |
| B of A Securities | maintain | Neutral | 2026-01-22 |
Amgen Inc. Grades
Below are the latest grades from recognized grading companies for Amgen Inc.:
| Grading Company | Action | New Grade | Date |
|---|---|---|---|
| Argus Research | maintain | Buy | 2026-02-06 |
| Guggenheim | maintain | Neutral | 2026-02-06 |
| Morgan Stanley | maintain | Equal Weight | 2026-02-04 |
| Leerink Partners | maintain | Outperform | 2026-02-04 |
| Citigroup | maintain | Neutral | 2026-02-04 |
| Cantor Fitzgerald | maintain | Neutral | 2026-02-04 |
| UBS | maintain | Buy | 2026-01-26 |
| Bernstein | downgrade | Market Perform | 2026-01-20 |
| Truist Securities | maintain | Hold | 2026-01-08 |
| Morgan Stanley | maintain | Equal Weight | 2025-12-12 |
Which company has the best grades?
Johnson & Johnson generally holds stronger grades, including several “Buy” and “Outperform” ratings with upgrades, while Amgen shows mixed ratings with downgrades. Investors may view Johnson & Johnson as having a firmer consensus for positive outlooks.
Risks specific to each company
The following categories identify the critical pressure points and systemic threats facing both Johnson & Johnson and Amgen Inc. in the 2026 market environment:
1. Market & Competition
Johnson & Johnson
- Diversified MedTech and Innovative Medicine segments drive growth despite intense pharma competition.
Amgen Inc.
- Focused therapeutic areas face rising biosimilar and novel therapy competition, pressuring market share.
2. Capital Structure & Debt
Johnson & Johnson
- Moderate leverage with debt-to-assets at 24% and strong interest coverage of 33.5x supports financial flexibility.
Amgen Inc.
- High leverage with debt-to-assets over 60% and modest interest coverage of 4.3x increases financial risk.
3. Stock Volatility
Johnson & Johnson
- Low beta of 0.35 reflects defensive stock profile with limited downside volatility.
Amgen Inc.
- Higher beta of 0.47 indicates more sensitivity to market swings and elevated volatility risk.
4. Regulatory & Legal
Johnson & Johnson
- Exposure to healthcare regulations globally; recent consumer health spin-off reduces legacy legal liabilities.
Amgen Inc.
- Faces regulatory scrutiny on biosimilars and novel biologics approval processes, adding approval uncertainty.
5. Supply Chain & Operations
Johnson & Johnson
- Large, global operations benefit from scale but face supply chain complexity and costs.
Amgen Inc.
- Smaller footprint eases supply chain control but increases vulnerability to single-source disruptions.
6. ESG & Climate Transition
Johnson & Johnson
- ESG initiatives robust but legacy manufacturing impacts require ongoing mitigation efforts.
Amgen Inc.
- Strong focus on sustainable biomanufacturing, yet transition risks remain in energy-intensive processes.
7. Geopolitical Exposure
Johnson & Johnson
- Global presence exposes firm to trade tensions and currency risks but diversified markets reduce impact.
Amgen Inc.
- Concentrated US and Europe exposure increases sensitivity to regional policy shifts and trade barriers.
Which company shows a better risk-adjusted profile?
Johnson & Johnson’s most impactful risk is its complex global supply chain amid inflationary pressures. Amgen’s critical risk is its high leverage, which constrains financial flexibility. JNJ’s low beta and strong interest coverage underpin a superior risk-adjusted profile. Amgen’s debt-to-assets at 60% and weaker interest coverage raise caution. The Altman Z-Score confirms JNJ’s safer financial position (5.18 vs 2.34), reinforcing my preference for JNJ when managing portfolio risk in 2026.
Final Verdict: Which stock to choose?
Johnson & Johnson’s superpower lies in its robust value creation and steady profitability, underpinned by a strong economic moat despite a slightly declining ROIC trend. Its balance sheet and operational efficiency fit well with investors seeking stable income and moderate growth, particularly in dividend-focused or conservative portfolios. The key point of vigilance is its somewhat stretched price-to-book ratio, signaling caution on valuation.
Amgen Inc. boasts a powerful moat fueled by its accelerating ROIC and exceptional return on equity, demonstrating strong capital efficiency and growth potential. Its strategic advantage in biopharma innovation supports higher earnings growth despite leverage concerns. Relative to Johnson & Johnson, Amgen offers a more dynamic growth profile but with elevated financial risk, aligning it with investors pursuing GARP strategies who can tolerate volatility for superior long-term returns.
If you prioritize steady value creation and defensive income, Johnson & Johnson is the compelling choice due to its consistent profitability and safer balance sheet. However, if you seek aggressive growth backed by expanding capital returns and can weather higher leverage, Amgen outshines with a superior growth trajectory and stronger moat momentum, though it commands a premium risk profile.
Disclaimer: Investment carries a risk of loss of initial capital. The past performance is not a reliable indicator of future results. Be sure to understand risks before making an investment decision.
Go Further
I encourage you to read the complete analyses of Johnson & Johnson and Amgen Inc. to enhance your investment decisions: