Home > Comparison > Healthcare > AMGN vs ISRG
The strategic rivalry between Amgen Inc. and Intuitive Surgical, Inc. shapes the healthcare sector’s innovation landscape. Amgen is a drug manufacturer focused on therapeutic biologics across multiple disease areas. Intuitive Surgical pioneers minimally invasive surgical instruments and robotic systems. This analysis explores their contrasting operational models and competitive moats to determine which company offers a superior risk-adjusted return for diversified portfolios in 2026.
Table of contents
Companies Overview
Amgen and Intuitive Surgical stand as pivotal innovators in healthcare, shaping therapeutics and surgical technology.
Amgen Inc.: Biotech Giant Powering Therapeutics
Amgen is a global biopharmaceutical leader focused on human therapeutics. It generates revenue chiefly through patented drugs addressing inflammation, oncology, and bone health. In 2026, Amgen emphasizes strategic alliances and R&D collaborations to expand its pipeline and maintain its competitive edge in specialty medicines.
Intuitive Surgical, Inc.: Pioneer in Minimally Invasive Surgery
Intuitive Surgical dominates the minimally invasive surgical systems market with its flagship da Vinci platform. Its revenue stems from equipment sales, instruments, and integrated digital services enhancing surgical outcomes. The 2026 strategy centers on broadening diagnostic tools and strengthening hospital partnerships to deepen market penetration.
Strategic Collision: Similarities & Divergences
Both firms innovate within healthcare but diverge in approach: Amgen drives value through drug development and alliances, while Intuitive focuses on surgical technology and service integration. Their primary battleground is improving patient outcomes via advanced therapies versus cutting-edge surgical tools. Each offers distinct investment profiles—Amgen’s stable biotech moat contrasts with Intuitive’s growth-driven tech platform.
Income Statement Comparison
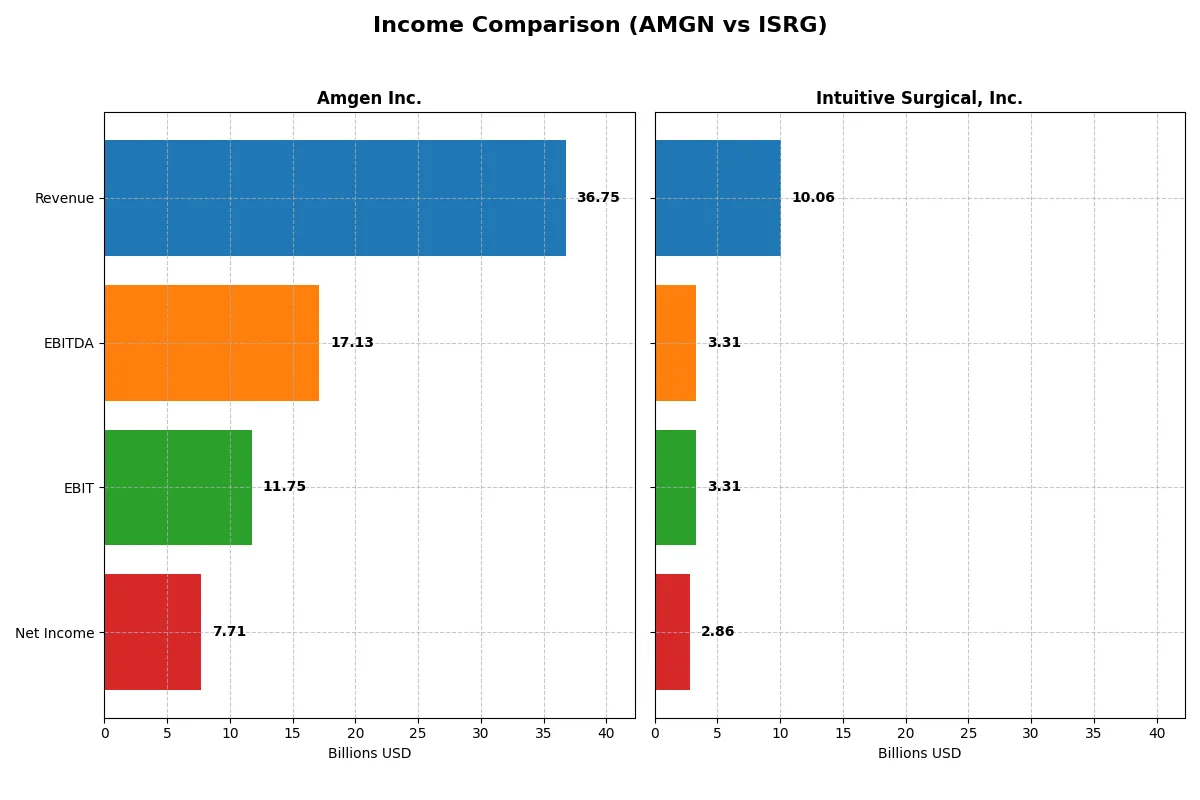
This data dissects the core profitability and scalability of both corporate engines to reveal who dominates the bottom line:
| Metric | Amgen Inc. (AMGN) | Intuitive Surgical, Inc. (ISRG) |
|---|---|---|
| Revenue | 36.8B | 10.1B |
| Cost of Revenue | 6.4B | 3.4B |
| Operating Expenses | 15.4B | 3.7B |
| Gross Profit | 30.3B | 6.7B |
| EBITDA | 17.1B | 3.3B |
| EBIT | 11.8B | 3.3B |
| Interest Expense | 2.8B | 0 |
| Net Income | 7.7B | 2.9B |
| EPS | 14.33 | 8.00 |
| Fiscal Year | 2025 | 2025 |
Income Statement Analysis: The Bottom-Line Duel
This income statement comparison uncovers the true efficiency and growth momentum powering each company’s financial engine through 2025.
Amgen Inc. Analysis
Amgen’s revenue climbed steadily from 26.0B in 2021 to 36.7B in 2025, reflecting a 41% growth over five years. Net income surged from 5.9B to 7.7B, boosted by a strong 21% net margin in 2025. Gross margin remains robust above 82%, while EBIT margin rose sharply to 32%. The latest year shows remarkable profit acceleration, driven by expanding operational efficiency despite slightly unfavorable opex growth relative to revenue.
Intuitive Surgical, Inc. Analysis
Intuitive Surgical’s revenue expanded impressively from 5.7B in 2021 to 10.1B in 2025, a 76% gain. Net income more than doubled, reaching 2.9B, supported by a superior 28% net margin in 2025. Gross margin holds steady at 66%, and EBIT margin improved to nearly 33%. The company demonstrated strong top-line momentum and controlled operating expenses efficiently, sustaining margin expansion alongside rapid revenue growth.
Margin Power vs. Revenue Scale
Amgen delivers higher margins with a larger absolute profit base, while Intuitive Surgical excels in revenue growth and margin improvement from a smaller scale. Amgen’s 7.7B net income outpaces Intuitive’s 2.9B, showcasing stronger cash generation. For investors, Amgen offers steady profitability at scale; Intuitive presents a high-growth, margin-expanding profile with a leaner cost structure.
Financial Ratios Comparison
These vital ratios act as a diagnostic tool to expose the underlying fiscal health, valuation premiums, and capital efficiency of the companies compared below:
| Ratios | Amgen Inc. (AMGN) | Intuitive Surgical, Inc. (ISRG) |
|---|---|---|
| ROE | 89.1% | N/A |
| ROIC | 18.4% | N/A |
| P/E | 22.8 | 70.8 |
| P/B | 20.3 | N/A |
| Current Ratio | 1.14 | 0 |
| Quick Ratio | 0.90 | 0 |
| D/E (Debt/Equity) | 6.31 | 0 |
| Debt-to-Assets | 60.3% | 0 |
| Interest Coverage | 5.41 | 0 |
| Asset Turnover | 0.41 | 0 |
| Fixed Asset Turnover | 4.64 | 0 |
| Payout Ratio | 66.4% | 0 |
| Dividend Yield | 2.91% | 0 |
| Fiscal Year | 2025 | 2025 |
Efficiency & Valuation Duel: The Vital Signs
Financial ratios act as a company’s DNA, exposing hidden risks and revealing operational strengths crucial for investors’ decisions.
Amgen Inc.
Amgen shows robust profitability with an 89% ROE and a strong 21% net margin, signaling operational excellence. Its P/E ratio at 22.8 is fairly valued, but a high P/B ratio at 20.3 suggests some overvaluation. Amgen rewards shareholders with a 2.9% dividend yield, reflecting steady cash returns alongside reinvestment in R&D.
Intuitive Surgical, Inc.
Intuitive Surgical boasts an impressive 28% net margin but reports zero ROE and ROIC, indicating possible accounting or reporting anomalies. Its P/E ratio at 70.8 marks the stock as expensive, while a zero debt load supports a clean balance sheet. The absence of dividends points to reinvestment in growth and innovation, typical for high-tech firms.
Premium Valuation vs. Operational Safety
Amgen balances strong returns on equity and capital with reasonable valuation metrics, offering operational safety. Intuitive Surgical’s high margin comes with valuation stretch and missing profitability metrics, raising caution. Amgen suits investors prioritizing stable income and risk control; Intuitive fits those chasing growth with tolerance for volatility.
Which one offers the Superior Shareholder Reward?
I observe Amgen Inc. (AMGN) delivers consistent dividends with a 2.9% yield and a sustainable payout ratio near 66%. It supports returns with steady buybacks, fueled by strong free cash flow coverage above 80%. Conversely, Intuitive Surgical, Inc. (ISRG) pays no dividends but reinvests heavily in R&D and growth, reflected in a sky-high P/E of 71x and an aggressive multiple expansion. ISRG lacks buybacks, indicating total return relies solely on capital appreciation. Historically in biotech, dividends plus buybacks like Amgen’s offer more balanced, lower-risk shareholder rewards. I favor Amgen for superior, sustainable total returns in 2026.
Comparative Score Analysis: The Strategic Profile
The radar chart reveals the fundamental DNA and strategic trade-offs between Amgen Inc. and Intuitive Surgical, Inc.:
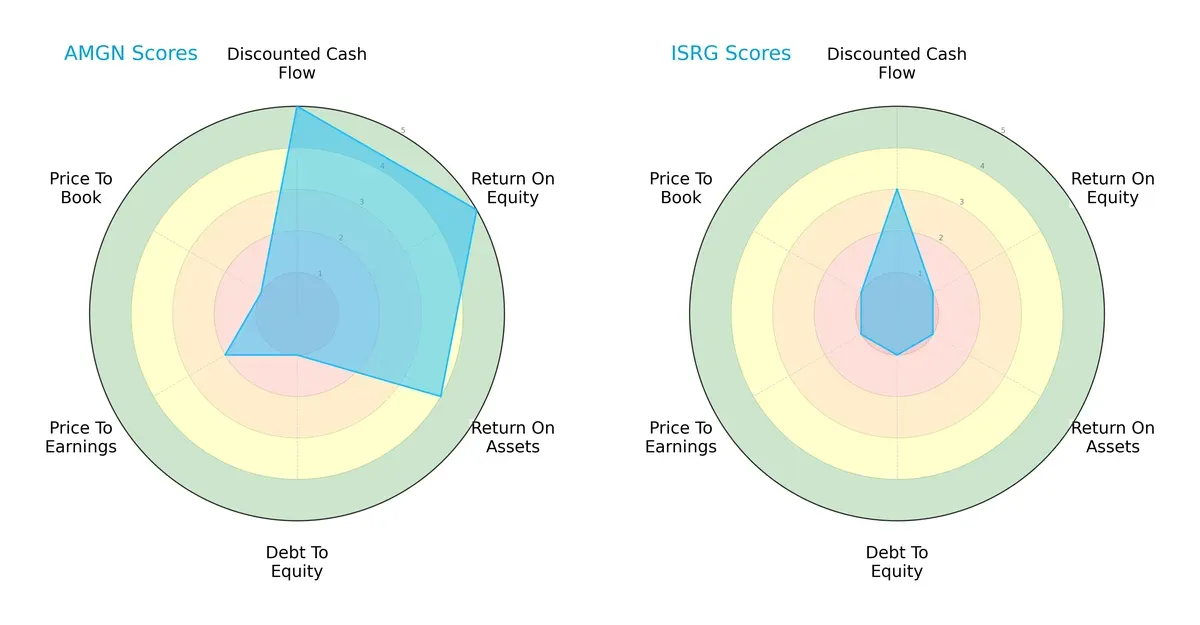
Amgen boasts a balanced profile with very favorable DCF and ROE scores (5 each) and a favorable ROA (4). However, it carries a significant weakness in debt-to-equity (1) and valuation metrics (PE 2, PB 1). Intuitive Surgical struggles across most metrics, scoring very unfavorably in ROE, ROA, and valuation, relying mainly on moderate DCF strength (3). Amgen’s diversified strengths outweigh Intuitive Surgical’s narrow edge.
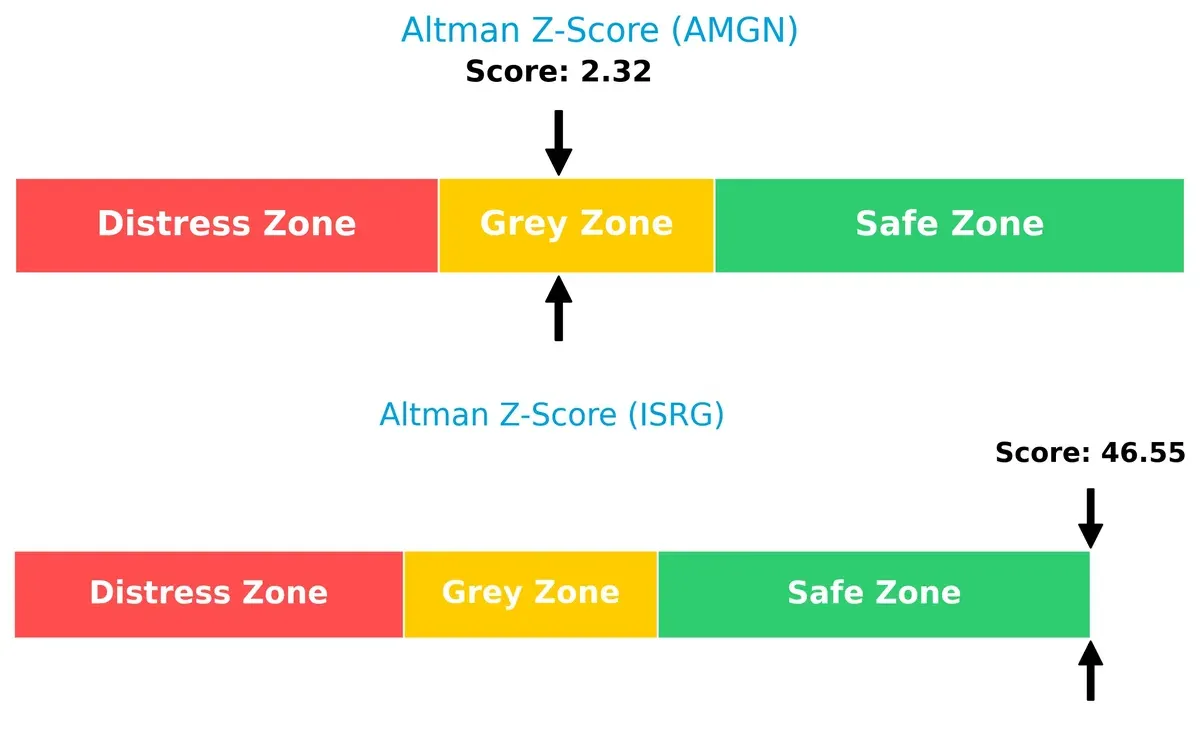
Bankruptcy Risk: Solvency Showdown
Amgen’s Altman Z-Score of 2.32 places it in the grey zone, signaling moderate bankruptcy risk. Intuitive Surgical’s 46.55 score firmly situates it in the safe zone, implying robust long-term survival prospects:
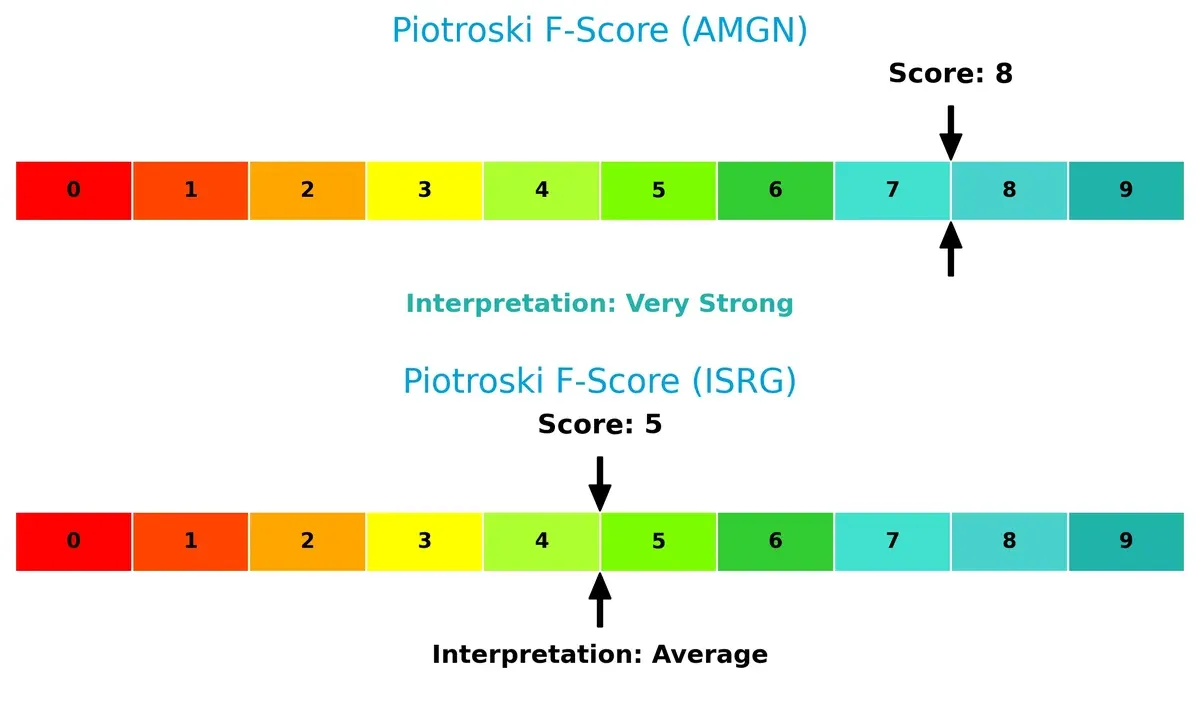
Financial Health: Quality of Operations
Amgen leads with a very strong Piotroski F-Score of 8, indicating high financial health and operational quality. Intuitive Surgical’s average score of 5 reveals moderate financial strength and potential internal red flags:
How are the two companies positioned?
This section dissects Amgen and Intuitive Surgical’s operational DNA by comparing their revenue distribution and internal strengths and weaknesses. The goal is to confront their economic moats and identify which model offers the most resilient competitive advantage in today’s healthcare market.
Revenue Segmentation: The Strategic Mix
This visual comparison dissects how Amgen Inc. and Intuitive Surgical, Inc. diversify their income streams and reveals their primary sector bets:
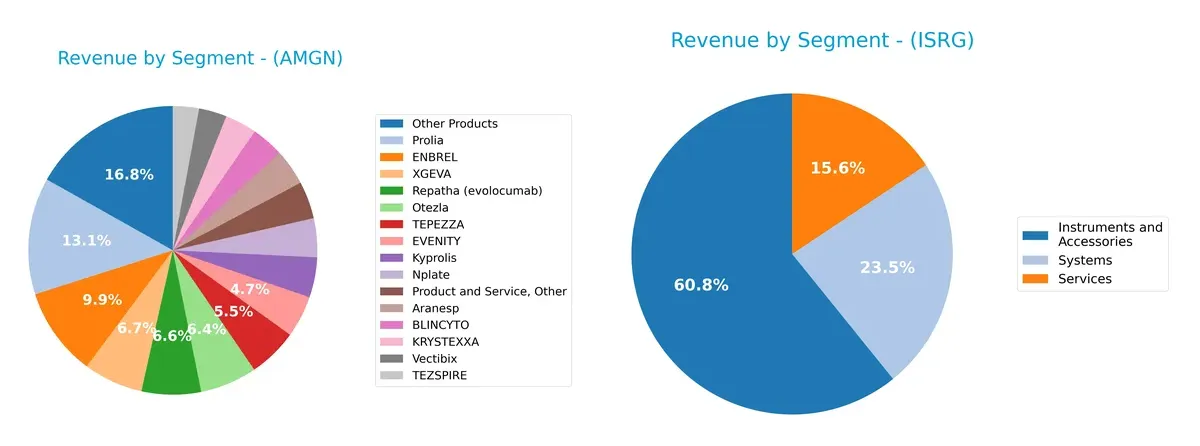
Amgen displays a highly diversified portfolio, with no single segment dominating; its largest product, ENBREL, generates $3.3B, dwarfed by $5.6B in Other Products. In contrast, Intuitive Surgical leans heavily on Instruments and Accessories, anchoring $5.1B of $8.9B total revenue in 2024. Amgen’s spread reduces concentration risk, while Intuitive’s focus signals strong ecosystem lock-in but greater vulnerability to market shifts in its core surgical robotics segment.
Strengths and Weaknesses Comparison
This table compares the strengths and weaknesses of Amgen Inc. and Intuitive Surgical, Inc.:
Amgen Strengths
- Diverse product portfolio with multiple billion-dollar drugs
- Strong profitability with 21% net margin
- High ROE at 89% indicating efficient equity use
- Positive ROIC of 18%, well above WACC
- Global presence with $9.6B Non-US revenue
- Stable dividend yield at 2.9%
Intuitive Surgical Strengths
- High net margin of 28% showing strong profitability
- Zero debt and favorable debt ratios indicate low financial risk
- Infinite interest coverage suggests strong ability to meet interest expenses
- Favorable price-to-book ratio implies undervaluation
- Clear focus on systems and instruments in surgical robotics
Amgen Weaknesses
- High debt-to-assets ratio at 60% signals leverage risk
- Unfavorable asset turnover of 0.41 reflects lower asset efficiency
- Elevated price-to-book ratio at 20.3 may imply overvaluation
- Neutral current and quick ratios suggest limited liquidity cushion
- Mixed ratio results with 29% unfavorable metrics
Intuitive Surgical Weaknesses
- ROE and ROIC at zero indicate lack of return efficiency
- Unfavorable valuation with PE ratio at 70.8 signals high expectations
- Zero current and quick ratios mark liquidity concerns
- No dividend yield reduces income appeal
- Limited product diversification with focus on surgical systems
Amgen’s broad product base and strong returns contrast with Intuitive’s focused innovation but higher valuation and liquidity risks. Each company’s financial profile suggests different strategic priorities in managing growth and capital structure.
The Moat Duel: Analyzing Competitive Defensibility
A structural moat is the only shield protecting long-term profits from relentless competition erosion. Here’s how Amgen and Intuitive Surgical stack up:
Amgen Inc.: Intangible Assets Driving Durable Value
Amgen’s moat stems from powerful intangible assets—patented biologics and deep R&D pipelines. This delivers a strong, growing ROIC above WACC by 12.7%, reflecting efficient capital use and stable margins. Expansion into new therapeutic areas in 2026 should deepen this advantage.
Intuitive Surgical, Inc.: Innovative Technology Facing ROIC Pressure
Intuitive’s moat relies on its proprietary surgical systems and network effects in minimally invasive care. Unlike Amgen, its ROIC trend has declined sharply, signaling pressure on returns. However, new diagnostics platforms offer potential for market disruption if executed well.
Moat Sustainability: Patented Biologics vs. Surgical Innovation
Amgen holds the deeper moat with a very favorable ROIC trajectory and strong value creation. Intuitive’s declining ROIC trend raises caution about its moat durability. Amgen is better positioned to defend its market share through innovation and capital efficiency.
Which stock offers better returns?
Over the past 12 months, Amgen Inc. and Intuitive Surgical, Inc. showed distinct price trajectories, with Amgen accelerating its gains while Intuitive Surgical faced recent declines.
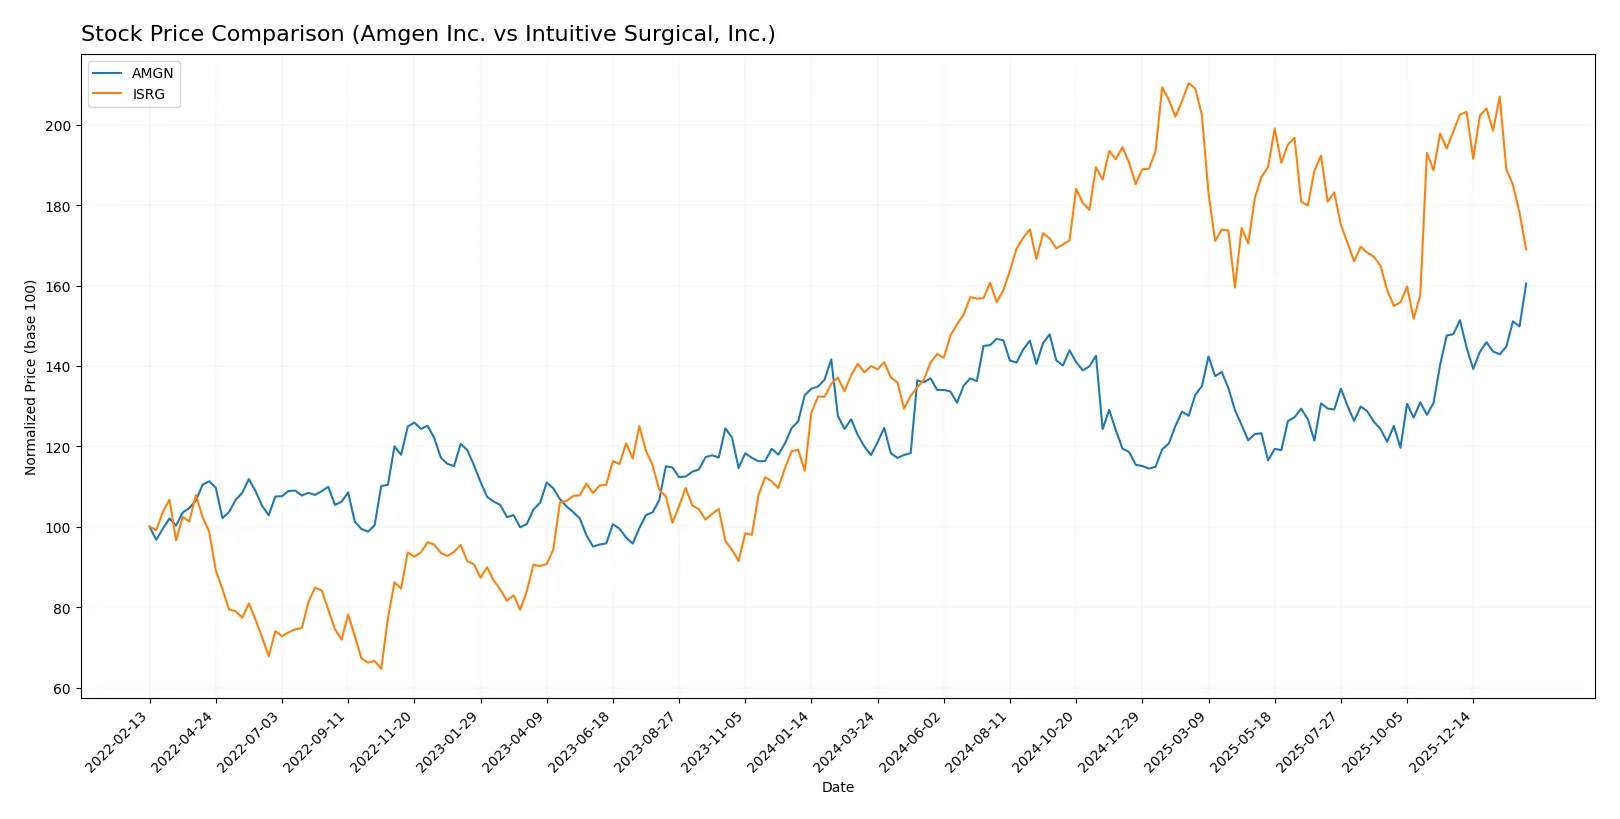
Trend Comparison
Amgen’s stock price rose 36.2% over the past year, showing a bullish trend with accelerating momentum and a high of 366.2. Volatility is moderate with a 23.79 standard deviation.
Intuitive Surgical’s stock increased 20.75% overall, marking a bullish but decelerating trend. Recent months reversed with a -14.8% drop and high volatility at 58.86 standard deviation.
Amgen outperformed Intuitive Surgical in market returns, delivering stronger overall growth and sustained buyer dominance during the analyzed period.
Target Prices
Analysts present a solid consensus for both Amgen Inc. and Intuitive Surgical, Inc., reflecting confidence in their growth prospects.
| Company | Target Low | Target High | Consensus |
|---|---|---|---|
| Amgen Inc. | 309 | 425 | 364.09 |
| Intuitive Surgical, Inc. | 550 | 750 | 641.25 |
Amgen’s consensus target of 364.09 aligns closely with its current price of 366.2, indicating a fairly valued stock. Intuitive Surgical’s target at 641.25 suggests significant upside from its current price of 478.49, highlighting strong analyst optimism.

Don’t Let Luck Decide Your Entry Point
Optimize your entry points with our advanced ProRealTime indicators. You’ll get efficient buy signals with precise price targets for maximum performance. Start outperforming now!
How do institutions grade them?
This section compares the latest institutional grades for Amgen Inc. and Intuitive Surgical, Inc.:
Amgen Inc. Grades
The table below shows recent grades from reputable institutions for Amgen Inc.:
| Grading Company | Action | New Grade | Date |
|---|---|---|---|
| Morgan Stanley | Maintain | Equal Weight | 2026-02-04 |
| Leerink Partners | Maintain | Outperform | 2026-02-04 |
| Citigroup | Maintain | Neutral | 2026-02-04 |
| Cantor Fitzgerald | Maintain | Neutral | 2026-02-04 |
| UBS | Maintain | Buy | 2026-01-26 |
| Bernstein | Downgrade | Market Perform | 2026-01-20 |
| Truist Securities | Maintain | Hold | 2026-01-08 |
| Morgan Stanley | Maintain | Equal Weight | 2025-12-12 |
| Wells Fargo | Maintain | Equal Weight | 2025-12-10 |
| BMO Capital | Maintain | Outperform | 2025-12-03 |
Intuitive Surgical, Inc. Grades
Below are the recent institutional grades for Intuitive Surgical, Inc.:
| Grading Company | Action | New Grade | Date |
|---|---|---|---|
| Freedom Capital Markets | Upgrade | Buy | 2026-01-27 |
| Barclays | Maintain | Overweight | 2026-01-26 |
| BTIG | Maintain | Buy | 2026-01-23 |
| Bernstein | Maintain | Outperform | 2026-01-23 |
| Citigroup | Maintain | Neutral | 2026-01-23 |
| Evercore ISI Group | Maintain | In Line | 2026-01-23 |
| Piper Sandler | Maintain | Overweight | 2026-01-23 |
| Bernstein | Maintain | Outperform | 2026-01-09 |
| BTIG | Maintain | Buy | 2026-01-07 |
| Barclays | Maintain | Overweight | 2026-01-07 |
Which company has the best grades?
Intuitive Surgical holds a stronger consensus of Buy, Outperform, and Overweight ratings. Amgen’s grades cluster around Neutral, Equal Weight, and Hold, with fewer Buy ratings. Investors may interpret Intuitive Surgical’s superior grades as a signal of greater confidence from analysts.
Risks specific to each company
In 2026’s complex market environment, these categories highlight critical pressure points and systemic threats facing both Amgen Inc. and Intuitive Surgical, Inc.:
1. Market & Competition
Amgen Inc.
- Faces intense drug industry competition with pressure on pricing and innovation.
Intuitive Surgical, Inc.
- Leads in surgical robotics but competes with emerging technologies and new entrants.
2. Capital Structure & Debt
Amgen Inc.
- High debt-to-assets ratio (60%) and weak debt-to-equity score increase financial risk.
Intuitive Surgical, Inc.
- Virtually no debt, indicating strong balance sheet and low financial leverage risk.
3. Stock Volatility
Amgen Inc.
- Low beta (0.47) suggests less stock volatility and defensive characteristics.
Intuitive Surgical, Inc.
- High beta (1.66) indicates greater stock volatility and sensitivity to market swings.
4. Regulatory & Legal
Amgen Inc.
- Subject to stringent drug approval and patent expiration risks.
Intuitive Surgical, Inc.
- Faces regulatory scrutiny on new robotic systems and device approvals globally.
5. Supply Chain & Operations
Amgen Inc.
- Complex global supply chain vulnerable to disruptions in pharmaceutical ingredients.
Intuitive Surgical, Inc.
- Relies on specialized manufacturing and global distribution of surgical systems.
6. ESG & Climate Transition
Amgen Inc.
- ESG initiatives underway but energy-intensive biotech operations pose challenges.
Intuitive Surgical, Inc.
- Focuses on sustainability with digital and minimally invasive surgery reducing environmental impact.
7. Geopolitical Exposure
Amgen Inc.
- Global sales expose it to trade tensions and regulatory differences.
Intuitive Surgical, Inc.
- International sales and manufacturing make it sensitive to geopolitical risks and tariffs.
Which company shows a better risk-adjusted profile?
Amgen’s most impactful risk lies in its heavy leverage and associated financial risk. Intuitive Surgical’s key risk is its high stock volatility and reliance on regulatory approvals. Despite leverage concerns, Amgen offers a more balanced risk profile due to lower market sensitivity and stronger profitability metrics. Intuitive Surgical’s elevated beta and valuation multiples heighten investment risk amid uncertain regulatory environment. The contrast in financial stability and market volatility defines their divergent risk-adjusted profiles.
Final Verdict: Which stock to choose?
Amgen Inc. wields the superpower of a robust, sustainable economic moat, delivering strong returns on invested capital well above its cost of capital. Its disciplined capital allocation fuels steady growth and reliable cash generation. A point of vigilance remains its relatively high debt load, which could pressure flexibility. It suits portfolios seeking stable, long-term growth with moderate risk tolerance.
Intuitive Surgical, Inc. benefits from a strategic moat built on innovative surgical robotics technology and recurring revenue streams. It offers a cleaner balance sheet with minimal debt, enhancing its safety profile compared to Amgen. However, its premium valuation and recent weakening profitability metrics call for caution. This stock fits well in growth-oriented portfolios willing to pay for market leadership and innovation.
If you prioritize enduring value creation and a proven track record of efficient capital use, Amgen is the compelling choice due to its superior moat and financial discipline. However, if you seek exposure to cutting-edge technology with lower leverage and are comfortable with higher valuation risk, Intuitive Surgical offers better stability in innovation-driven growth. Both present distinct analytical scenarios tailored to specific investor profiles.
Disclaimer: Investment carries a risk of loss of initial capital. The past performance is not a reliable indicator of future results. Be sure to understand risks before making an investment decision.
Go Further
I encourage you to read the complete analyses of Amgen Inc. and Intuitive Surgical, Inc. to enhance your investment decisions: