Home > Comparison > Healthcare > AMGN vs GILD
The strategic rivalry between Amgen Inc. and Gilead Sciences, Inc. shapes the competitive landscape of the healthcare sector. Amgen operates as a diversified biopharmaceutical powerhouse with a broad therapeutic portfolio, while Gilead focuses intensively on antiviral and cell therapy innovations. This analysis contrasts their distinct operational models and growth strategies to identify which company offers the superior risk-adjusted return for a diversified portfolio.
Table of contents
Companies Overview
Amgen Inc. and Gilead Sciences, Inc. are key players shaping the global biopharmaceutical landscape.
Amgen Inc.: Pioneer in Human Therapeutics
Amgen leads as a biotech innovator focused on inflammation, oncology, and cardiovascular diseases. It generates revenue by discovering, developing, and marketing human therapeutics like Enbrel and Neulasta. In 2026, its strategic focus centers on expanding collaborations to advance treatments for autoimmune and cancer disorders, leveraging partnerships with global pharma leaders.
Gilead Sciences, Inc.: Specialist in Antiviral Therapies
Gilead commands the antiviral market with a stronghold in HIV and liver disease treatments. It profits by commercializing medicines like Biktarvy and Veklury across major international markets. The company’s 2026 strategy emphasizes broadening its oncology and cell therapy pipeline through alliances with innovative biotech firms and pharma giants.
Strategic Collision: Similarities & Divergences
Both companies prioritize drug innovation but diverge in therapeutic focus—Amgen targets chronic diseases, Gilead specializes in antivirals and cell therapies. Their primary battleground is the evolving biotech innovation race, competing on pipeline strength and partnerships. Amgen offers a diversified, collaboration-driven profile, while Gilead’s investment appeal hinges on its niche antiviral dominance and emerging oncology ventures.
Income Statement Comparison
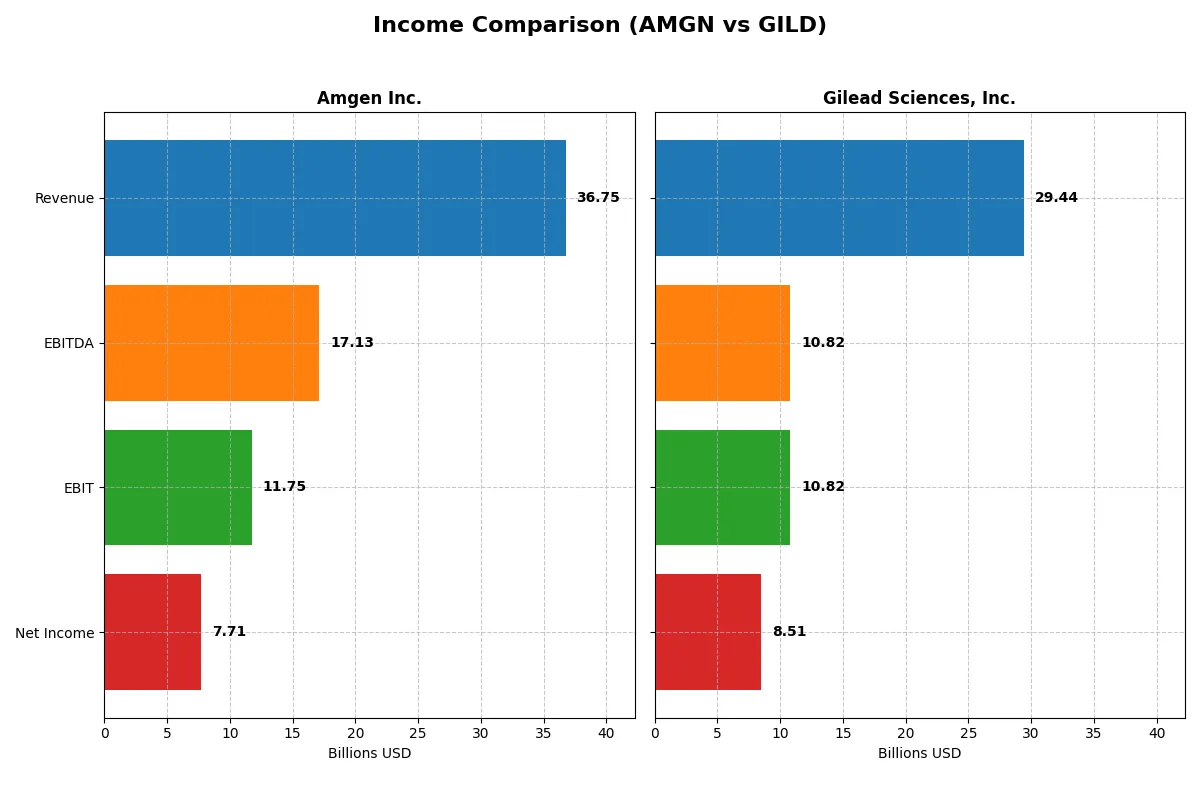
The following data dissects the core profitability and scalability of both corporate engines to reveal who dominates the bottom line:
| Metric | Amgen Inc. (AMGN) | Gilead Sciences, Inc. (GILD) |
|---|---|---|
| Revenue | 36.8B | 29.4B |
| Cost of Revenue | 6.4B | 3.9B |
| Operating Expenses | 15.4B | 13.7B |
| Gross Profit | 30.3B | 25.5B |
| EBITDA | 17.1B | 10.8B |
| EBIT | 11.8B | 10.8B |
| Interest Expense | 2.8B | 1.0B |
| Net Income | 7.7B | 8.5B |
| EPS | 14.33 | 6.84 |
| Fiscal Year | 2025 | 2025 |
Income Statement Analysis: The Bottom-Line Duel
This income statement comparison reveals which company operates with superior efficiency and delivers stronger financial momentum.
Amgen Inc. Analysis
Amgen’s revenue rose steadily from $26.0B in 2021 to $36.8B in 2025, with net income increasing from $5.9B to $7.7B. Its gross margin remains robust at 82.5%, while net margin stands at a healthy 21.0%. The 2025 surge in gross profit (+47%) and net income (+71%) signals improving operational efficiency and earnings momentum.
Gilead Sciences, Inc. Analysis
Gilead’s revenue expanded modestly from $27.3B in 2021 to $29.4B in 2025, while net income grew from $6.2B to $8.5B. The firm maintains a stronger gross margin of 86.7% and a net margin near 28.9%. Gilead’s explosive EBIT growth (+549%) and net margin expansion (+1631%) in 2025 reflect exceptional profitability gains despite slower top-line growth.
Margin Strength vs. Earnings Momentum
Gilead commands superior margins and a higher net margin, demonstrating greater profitability per dollar of sales. However, Amgen shows stronger revenue growth and gross profit momentum. Fundamentally, Gilead leads on margin quality and net income growth, making it attractive for investors prioritizing profitability and margin expansion.
Financial Ratios Comparison
These vital ratios act as a diagnostic tool to expose the underlying fiscal health, valuation premiums, and capital efficiency of the companies compared below:
| Ratios | Amgen Inc. (AMGN) | Gilead Sciences, Inc. (GILD) |
|---|---|---|
| ROE | 89.1% | 0% |
| ROIC | 18.4% | 0% |
| P/E | 22.8 | 17.9 |
| P/B | 20.3 | 0 |
| Current Ratio | 1.14 | 0 |
| Quick Ratio | 0.90 | 0 |
| D/E (Debt-to-Equity) | 6.31 | 0 |
| Debt-to-Assets | 60.3% | 0 |
| Interest Coverage | 5.41 | 11.54 |
| Asset Turnover | 0.41 | 0 |
| Fixed Asset Turnover | 4.64 | 0 |
| Payout Ratio | 66.4% | 46.2% |
| Dividend Yield | 2.91% | 2.57% |
| Fiscal Year | 2025 | 2025 |
Efficiency & Valuation Duel: The Vital Signs
Ratios act as the company’s DNA, revealing hidden risks and operational excellence critical for informed investment decisions.
Amgen Inc.
Amgen shows strong profitability with an 89% ROE and an 18.35% ROIC, well above its 5.53% WACC, signaling efficient capital use. The stock’s P/E of 22.84 suggests a neutral valuation, but a high P/B at 20.34 flags overvaluation risks. Amgen returns value via a 2.91% dividend yield, supporting income investors.
Gilead Sciences, Inc.
Gilead’s 28.9% net margin is impressive, yet it reports zero ROE and ROIC, indicating weak capital profitability. The P/E ratio of 17.94 looks reasonable, and a favorable zero debt ratio boosts its financial safety. Gilead offers a 2.57% dividend yield, maintaining shareholder returns despite operational concerns.
Balanced Strength vs. Operational Uncertainty
Amgen balances strong returns with a modest premium valuation but carries leverage risks. Gilead’s valuation and debt profile appear safer, yet lackluster profitability undermines appeal. Investors prioritizing capital efficiency may favor Amgen, while those seeking financial conservatism might lean toward Gilead.
Which one offers the Superior Shareholder Reward?
I see Amgen pays a higher dividend yield (~2.9%-3.4%) with payout ratios around 64%-118%, indicating aggressive distributions. Gilead’s yield hovers near 2.6%-3.9% with more conservative payout ratios (~46%-81%). Amgen also delivers stronger buyback intensity, boosting total returns but with elevated leverage (debt/equity >6). Gilead’s moderate dividend and consistent buybacks reflect a balanced capital allocation with healthier coverage ratios and lower financial risk. For 2026, I favor Gilead’s sustainable model that better preserves long-term value while still rewarding shareholders.
Comparative Score Analysis: The Strategic Profile
The radar chart reveals the fundamental DNA and trade-offs of Amgen Inc. and Gilead Sciences, Inc., highlighting their core financial strengths and valuation nuances:
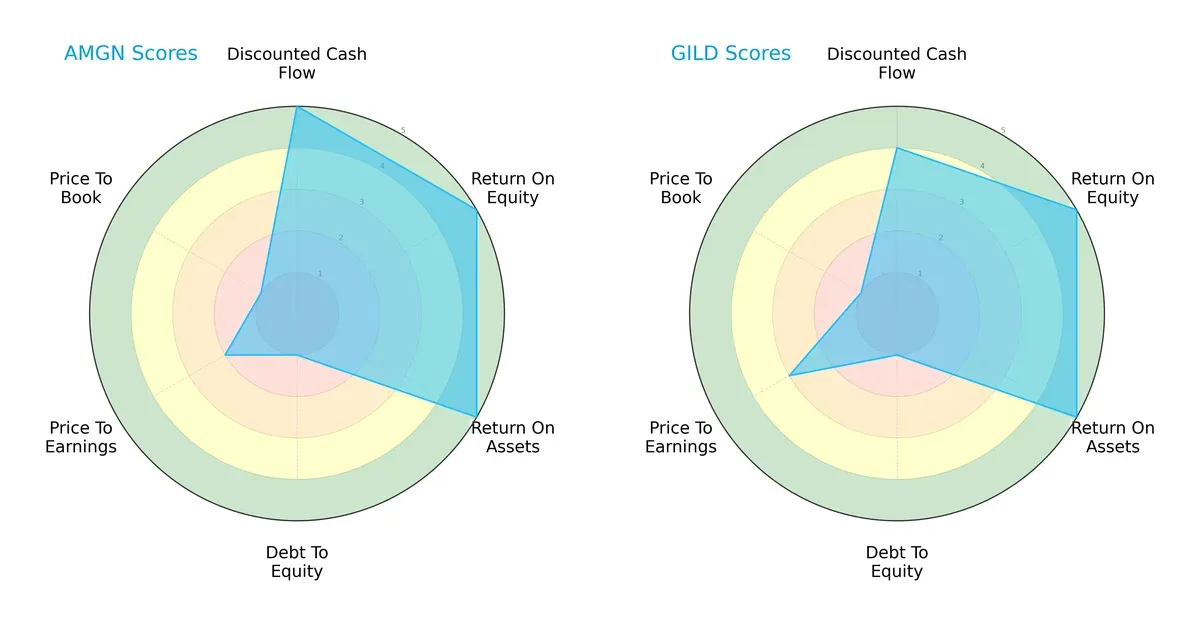
Amgen leads with superior DCF (5 vs. 4), signaling stronger future cash flow potential. Both firms share peak efficiency scores in ROE and ROA (5 each). However, both struggle with debt management (score 1), reflecting elevated leverage risk. Gilead edges slightly in valuation (P/E score 3 vs. 2), suggesting it may be less overvalued than Amgen. Overall, Amgen’s profile tilts toward operational excellence, while Gilead shows a more balanced valuation approach.
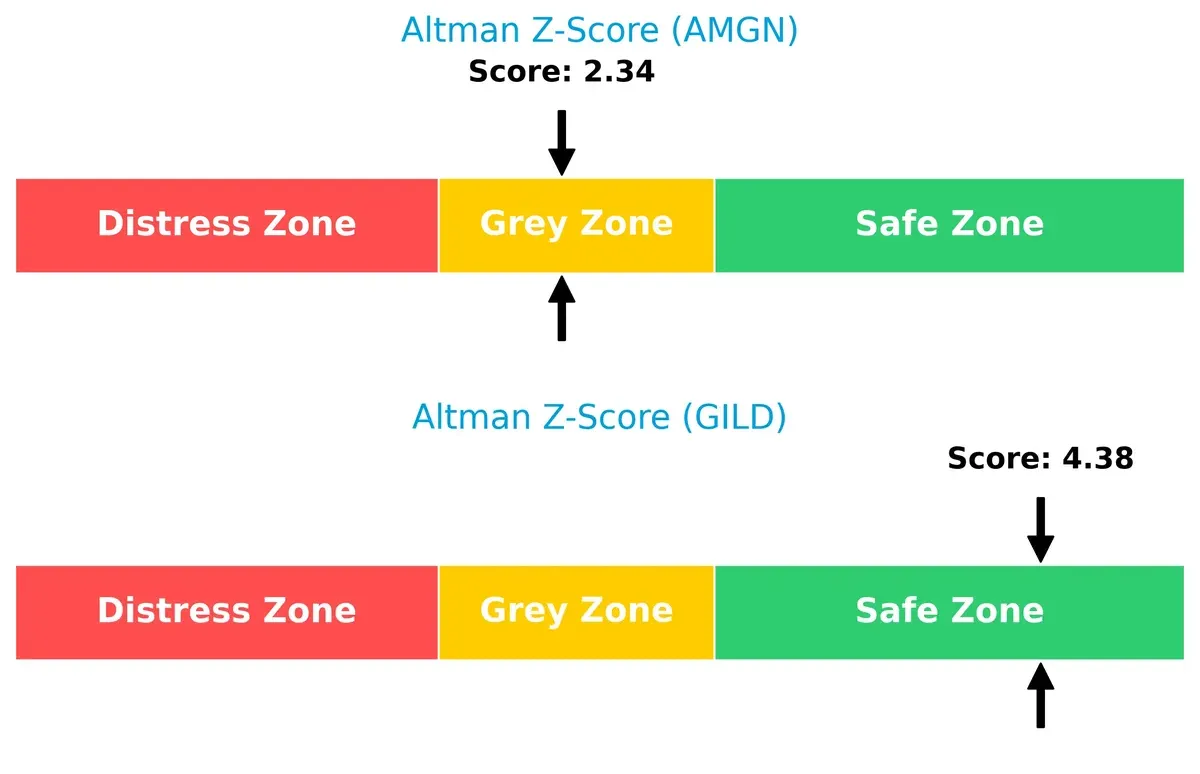
Bankruptcy Risk: Solvency Showdown
Amgen’s Altman Z-Score stands at 2.34 (grey zone), while Gilead scores a safer 4.38 (safe zone), indicating a stronger buffer against bankruptcy risk for Gilead in this cycle:
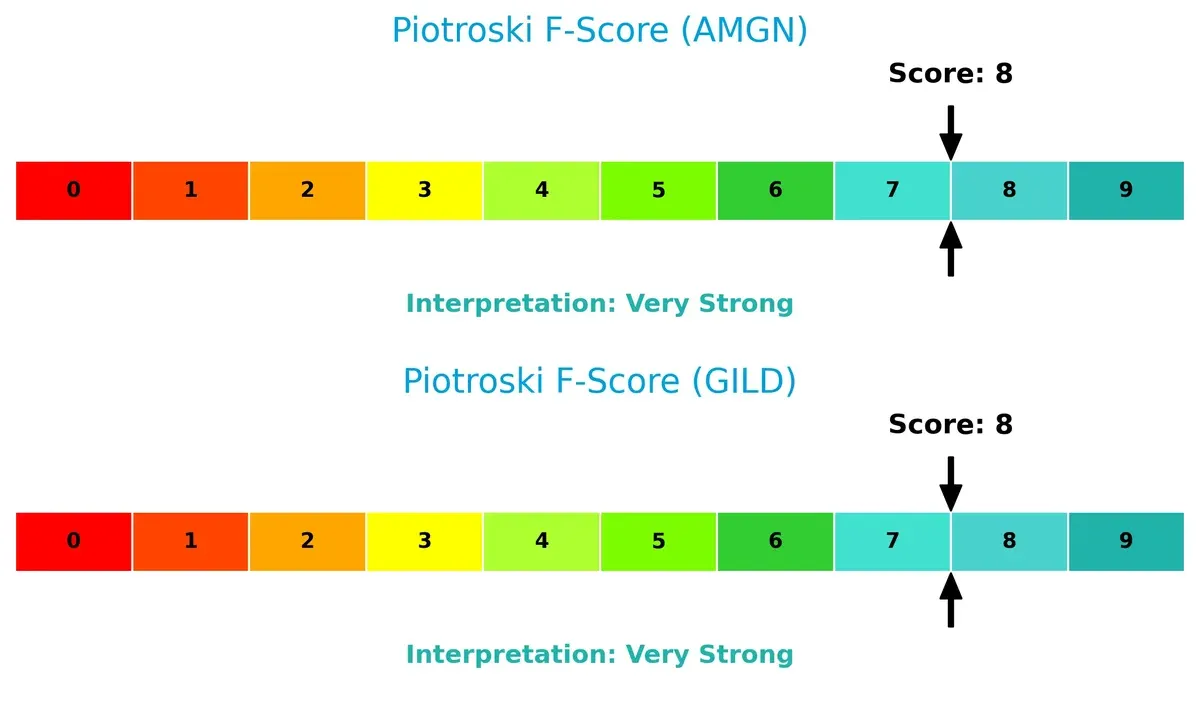
Financial Health: Quality of Operations
Both companies post strong Piotroski F-Scores of 8, reflecting robust internal financial health and operational quality. Neither shows red flags, affirming solid fundamentals on both sides:
How are the two companies positioned?
This section dissects Amgen and Gilead’s operational DNA by comparing their revenue distribution and internal strengths and weaknesses. The goal is to confront their economic moats and identify which business model delivers the most resilient, sustainable competitive edge today.
Revenue Segmentation: The Strategic Mix
This visual comparison dissects how Amgen Inc. and Gilead Sciences diversify their income streams and reveals their primary sector bets for 2024–2025:
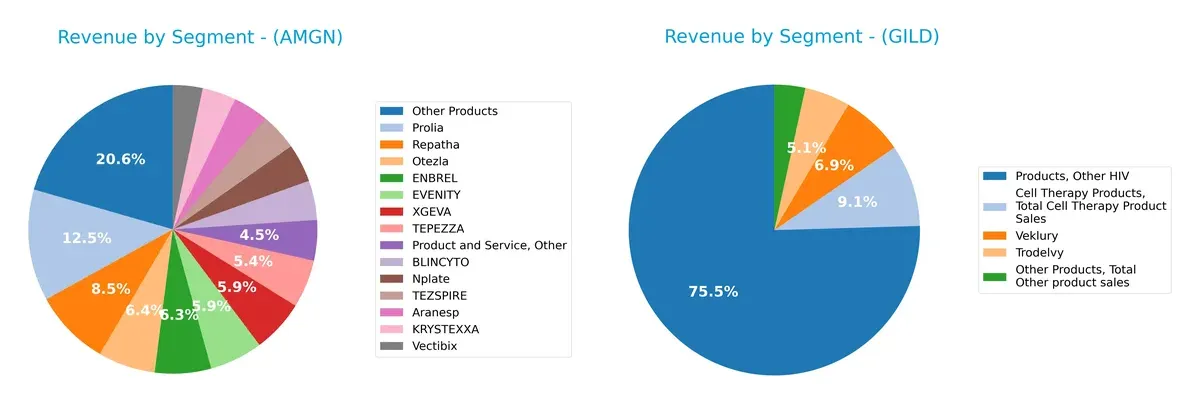
Amgen displays a broadly diversified portfolio, with top products like Prolia at $4.4B and Otezla at $2.3B, alongside many $1B+ contributors. Gilead leans heavily on “Other HIV” products, generating $19.6B in 2024, dwarfing its other segments. Amgen’s spread reduces concentration risk, while Gilead’s reliance on a dominant segment signals potential vulnerability but also reflects deep ecosystem lock-in in antiviral therapies.
Strengths and Weaknesses Comparison
This table compares the Strengths and Weaknesses of Amgen Inc. and Gilead Sciences, Inc.:
Amgen Inc. Strengths
- Diverse product portfolio with multiple top-selling drugs
- Strong profitability with 20.98% net margin and 89.06% ROE
- Favorable fixed asset turnover and 2.91% dividend yield
- Significant US and Non-US revenue balance
Gilead Sciences, Inc. Strengths
- High net margin of 28.9% and favorable debt metrics
- Strong interest coverage at 10.57 and appealing dividend yield of 2.57%
- Large revenue base in antiviral products and cell therapy
- Broad geographic presence across US, Europe, and other international markets
Amgen Inc. Weaknesses
- High debt-to-assets ratio at 60.28%, unfavorable leverage
- Low asset turnover and unfavorable price-to-book ratio
- Neutral liquidity ratios signal some short-term risk
Gilead Sciences, Inc. Weaknesses
- Zero ROE and ROIC indicate poor capital efficiency
- Unavailable WACC data limits cost of capital assessment
- Poor liquidity ratios and asset turnover measures
Both companies show strong profitability but differ in capital efficiency and leverage profiles. Amgen’s diversified portfolio contrasts with Gilead’s antiviral focus, affecting their strategic risk exposure.
The Moat Duel: Analyzing Competitive Defensibility
A structural moat is the only thing protecting long-term profits from relentless competition and margin erosion. Let’s dissect the competitive moats of Amgen and Gilead:
Amgen Inc.: Innovation-Driven Intangible Assets
Amgen’s moat stems from patented biologics and R&D prowess, reflected in its high ROIC exceeding WACC by 12.8%. Its margin stability and 34% ROIC growth signal durable value creation. Pipeline advances in oncology and inflammation could deepen this advantage in 2026.
Gilead Sciences, Inc.: Cost-Effective Portfolio and Market Niche
Gilead leverages a cost advantage in antiviral therapies, delivering favorable gross and EBIT margins. However, its declining ROIC trend raises concerns. Recent breakthroughs in cell therapy might offset this risk and open new markets by 2026.
Innovation Moat vs. Cost Leadership: Who Holds the Fortress?
Amgen’s wide and expanding economic moat outclasses Gilead’s cost-driven niche with deteriorating ROIC. Amgen stands better equipped to defend market share amid intensifying biopharma competition.
Which stock offers better returns?
Over the past year, both Amgen Inc. and Gilead Sciences, Inc. have shown strong price appreciation, with notable acceleration and rising buyer dominance in recent months.
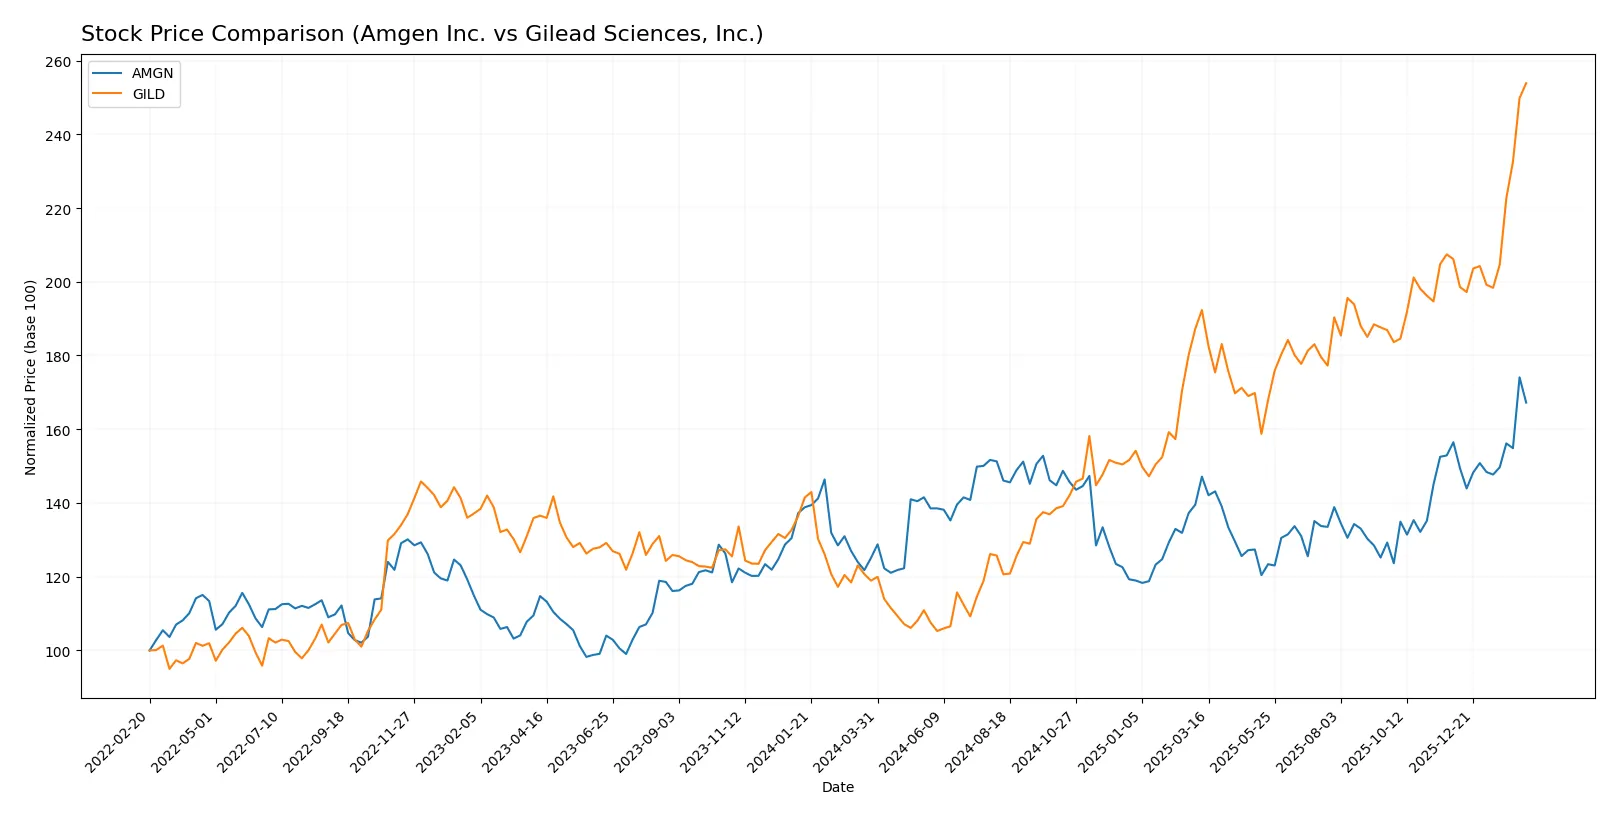
Trend Comparison
Amgen Inc. has posted a 33.68% price increase over the last 12 months, reflecting a bullish trend with accelerating momentum and significant volatility (std dev 24.99). The stock peaked at 384.32 and bottomed at 261.22.
Gilead Sciences, Inc. delivered a 113.44% gain over the same period, also bullish with acceleration. Volatility is slightly lower (std dev 21.42). The stock hit a high of 154.98 and a low of 64.27.
Gilead’s performance clearly outpaces Amgen’s, delivering more than triple the price appreciation and stronger buyer dominance in volume trends.
Target Prices
Analysts present a balanced target price consensus for Amgen Inc. and Gilead Sciences, reflecting cautious optimism.
| Company | Target Low | Target High | Consensus |
|---|---|---|---|
| Amgen Inc. | 295 | 425 | 358.33 |
| Gilead Sciences, Inc. | 105 | 177 | 154.2 |
The consensus targets suggest moderate upside potential for Amgen, slightly below its current price of 369.19. Gilead’s consensus aligns closely with its current price of 154.98, indicating a relatively fair valuation by analysts.

Don’t Let Luck Decide Your Entry Point
Optimize your entry points with our advanced ProRealTime indicators. You’ll get efficient buy signals with precise price targets for maximum performance. Start outperforming now!
How do institutions grade them?
Amgen Inc. Grades
The following table summarizes recent institutional grades for Amgen Inc.:
| Grading Company | Action | New Grade | Date |
|---|---|---|---|
| Argus Research | Maintain | Buy | 2026-02-06 |
| Guggenheim | Maintain | Neutral | 2026-02-06 |
| Morgan Stanley | Maintain | Equal Weight | 2026-02-04 |
| Leerink Partners | Maintain | Outperform | 2026-02-04 |
| Citigroup | Maintain | Neutral | 2026-02-04 |
| Cantor Fitzgerald | Maintain | Neutral | 2026-02-04 |
| UBS | Maintain | Buy | 2026-01-26 |
| Bernstein | Downgrade | Market Perform | 2026-01-20 |
| Truist Securities | Maintain | Hold | 2026-01-08 |
| Morgan Stanley | Maintain | Equal Weight | 2025-12-12 |
Gilead Sciences, Inc. Grades
The following table summarizes recent institutional grades for Gilead Sciences, Inc.:
| Grading Company | Action | New Grade | Date |
|---|---|---|---|
| RBC Capital | Maintain | Sector Perform | 2026-02-11 |
| Needham | Maintain | Buy | 2026-02-11 |
| Wells Fargo | Maintain | Overweight | 2026-02-11 |
| Truist Securities | Maintain | Buy | 2026-02-11 |
| Cantor Fitzgerald | Maintain | Overweight | 2026-02-11 |
| Scotiabank | Maintain | Sector Outperform | 2026-02-11 |
| Truist Securities | Maintain | Buy | 2026-01-27 |
| Citigroup | Maintain | Buy | 2026-01-27 |
| UBS | Maintain | Buy | 2026-01-26 |
| Morgan Stanley | Maintain | Overweight | 2026-01-13 |
Which company has the best grades?
Gilead Sciences holds a stronger consensus with multiple Buy and Overweight ratings. Amgen shows a mix of Neutral, Hold, and Buy grades, with one recent downgrade. Investors may view Gilead’s grades as reflecting higher confidence and positive momentum.
Risks specific to each company
The following categories identify the critical pressure points and systemic threats facing both firms in the 2026 market environment:
1. Market & Competition
Amgen Inc.
- Faces intense competition in oncology and inflammation segments with pressure on innovation cycles.
Gilead Sciences, Inc.
- Competes in crowded HIV and antiviral markets, requiring continual pipeline innovation to maintain leadership.
2. Capital Structure & Debt
Amgen Inc.
- High debt levels with debt-to-assets at 60.3% pose financial risk despite adequate interest coverage.
Gilead Sciences, Inc.
- Low reported debt metrics indicate conservative leverage, supporting financial stability and flexibility.
3. Stock Volatility
Amgen Inc.
- Beta at 0.47 signals below-market volatility, offering relative defensive stock behavior.
Gilead Sciences, Inc.
- Even lower beta of 0.39 suggests Gilead is less sensitive to market swings, appealing to risk-averse investors.
4. Regulatory & Legal
Amgen Inc.
- Subject to evolving FDA regulations and patent expirations impacting revenue streams.
Gilead Sciences, Inc.
- Faces ongoing scrutiny on pricing and patent challenges, especially in antiviral drug categories.
5. Supply Chain & Operations
Amgen Inc.
- Complex biologics manufacturing requires robust supply chain; disruption risks remain high.
Gilead Sciences, Inc.
- Biopharmaceutical supply chain exposed to raw material sourcing and manufacturing scale-up challenges.
6. ESG & Climate Transition
Amgen Inc.
- Increasing pressure to reduce carbon footprint and enhance sustainability in operations.
Gilead Sciences, Inc.
- Actively addressing ESG concerns but faces challenges in meeting investor expectations on climate targets.
7. Geopolitical Exposure
Amgen Inc.
- Global operations vulnerable to trade tensions and regulatory shifts in key markets.
Gilead Sciences, Inc.
- Significant international revenue exposes Gilead to geopolitical risks, especially in Europe and Asia.
Which company shows a better risk-adjusted profile?
Amgen’s largest risk lies in its elevated debt burden, raising financial vulnerability despite strong operational metrics. Gilead’s most impactful risk is the pressure on innovation and regulatory hurdles in its core antiviral markets. Gilead’s safer debt profile and lower volatility offer a more favorable risk-adjusted stance in 2026. Notably, Amgen’s 60% debt-to-assets ratio contrasts sharply with Gilead’s minimal leverage, underscoring my concern over Amgen’s balance sheet risk.
Final Verdict: Which stock to choose?
Amgen Inc. shines with its robust capital efficiency and a proven ability to generate returns well above its cost of capital. Its superpower lies in sustainable value creation driven by strong operational execution and innovation. A point of vigilance is its elevated leverage, which might pressure financial flexibility. It suits portfolios targeting aggressive growth with a tolerance for some financial risk.
Gilead Sciences, Inc. boasts a strategic moat grounded in high net margins and a resilient cash flow model. Its lower leverage and superior interest coverage provide a safety cushion compared to Amgen. Gilead fits well in Growth at a Reasonable Price (GARP) portfolios seeking steady income with moderate volatility.
If you prioritize durable economic moats and high return on invested capital, Amgen is the compelling choice due to its consistent value creation and operational strength. However, if you seek better financial stability and a defensive growth profile, Gilead offers superior risk management and margin resilience. Each stock appeals to distinct investor avatars tuned to different risk-return preferences.
Disclaimer: Investment carries a risk of loss of initial capital. The past performance is not a reliable indicator of future results. Be sure to understand risks before making an investment decision.
Go Further
I encourage you to read the complete analyses of Amgen Inc. and Gilead Sciences, Inc. to enhance your investment decisions: