Home > Comparison > Healthcare > AMGN vs BMY
The strategic rivalry between Amgen Inc. and Bristol-Myers Squibb Company shapes the healthcare sector’s evolution. Amgen operates as a biologics-focused innovator in drug manufacturing, while Bristol-Myers Squibb blends biopharma innovation with broad therapeutic reach. This head-to-head pits Amgen’s precision-driven growth against Bristol-Myers’ diversified pipeline. This analysis will reveal which trajectory offers superior risk-adjusted returns for a diversified portfolio navigating healthcare’s complex landscape.

Table of contents
Companies Overview
Amgen Inc. and Bristol-Myers Squibb Company stand as titans in the global drug manufacturing industry.
Amgen Inc.: Biotech Pioneer with a Focus on Therapeutics
Amgen dominates the biotechnology sector by discovering and delivering human therapeutics worldwide. Its core revenue stems from treatments in inflammation, oncology, and cardiovascular disease. In 2026, Amgen’s strategic focus remains on expanding its portfolio through collaborations and advancing therapies for autoimmune and cancer-related conditions.
Bristol-Myers Squibb Company: Comprehensive Biopharma Innovator
Bristol-Myers Squibb leads with a broad biopharmaceutical product lineup targeting hematology, oncology, and immunology. Its revenue engine relies heavily on immuno-oncology and cardiovascular drugs. The company’s 2026 strategy emphasizes innovation in immunotherapy and expanding access through partnerships and global marketing.
Strategic Collision: Similarities & Divergences
Both companies prioritize oncology and immunology but differ in business models: Amgen leverages focused biologics and collaborations while Bristol-Myers Squibb operates a diversified pharma portfolio. Their primary battleground is cancer treatment innovation and market penetration. Investors face distinct profiles—Amgen’s biotechnology-driven growth contrasts with Bristol-Myers Squibb’s broad-spectrum, established market presence.
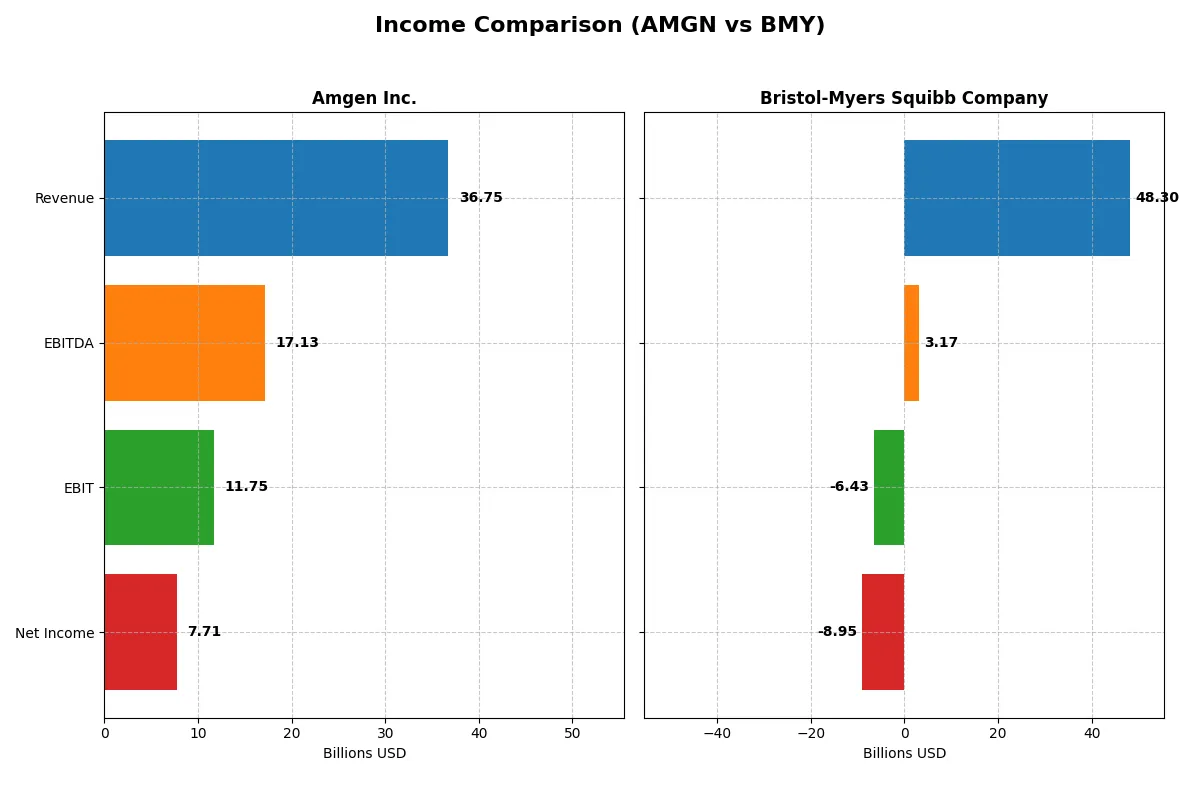
Income Statement Comparison
The following data dissects the core profitability and scalability of both corporate engines to reveal who dominates the bottom line:
| Metric | Amgen Inc. (AMGN) | Bristol-Myers Squibb Company (BMY) |
|---|---|---|
| Revenue | 36.8B | 48.3B |
| Cost of Revenue | 6.4B | 20.9B |
| Operating Expenses | 15.4B | 17.8B |
| Gross Profit | 30.3B | 27.4B |
| EBITDA | 17.1B | 3.2B |
| EBIT | 11.8B | -6.4B |
| Interest Expense | 2.8B | 1.9B |
| Net Income | 7.7B | -8.9B |
| EPS | 14.33 | -4.41 |
| Fiscal Year | 2025 | 2024 |
Income Statement Analysis: The Bottom-Line Duel
This income statement comparison reveals which company runs a more efficient and profitable corporate engine in their latest fiscal years.
Amgen Inc. Analysis
Amgen’s revenue increased steadily from $26.0B in 2021 to $36.8B in 2025, with net income rising from $5.9B to $7.7B. Its gross margin stays robust above 80%, while net margin improved to nearly 21%. The 2025 surge in gross profit and EBIT by over 40% shows strong operational momentum and efficient cost control despite rising operating expenses.
Bristol-Myers Squibb Company Analysis
Bristol-Myers Squibb’s revenue grew modestly from $42.5B in 2020 to $48.3B in 2024, but net income swung from a $9.0B loss in 2020 to an $8.0B loss in 2024. Its gross margin remains healthy at 57%, yet EBIT and net margins turned negative in 2024, signaling profitability challenges. The sharp EBIT decline in 2024 reflects cost pressures and one-off expenses undermining earnings.
Margin Strength vs. Profitability Challenges
Amgen clearly outperforms Bristol-Myers Squibb on both revenue growth and profitability metrics, boasting superior gross and net margins with strong net income momentum. Bristol-Myers struggles with negative net income and EBIT despite stable revenue, highlighting operational inefficiencies. For investors prioritizing margin power and earnings quality, Amgen presents a more attractive financial profile.
Financial Ratios Comparison
These vital ratios act as a diagnostic tool to expose underlying fiscal health, valuation premiums, and capital efficiency for a clear side-by-side company evaluation:
| Ratios | Amgen Inc. (AMGN) | Bristol-Myers Squibb (BMY) |
|---|---|---|
| ROE | 89.1% | -54.8% |
| ROIC | 18.4% | 13.6% |
| P/E | 22.8 | -12.8 |
| P/B | 20.3 | 7.0 |
| Current Ratio | 1.14 | 1.25 |
| Quick Ratio | 0.90 | 1.15 |
| D/E | 6.31 | 3.13 |
| Debt-to-Assets | 60.3% | 55.3% |
| Interest Coverage | 5.41 | 4.96 |
| Asset Turnover | 0.41 | 0.52 |
| Fixed Asset Turnover | 4.64 | 5.78 |
| Payout Ratio | 66.4% | -54.3% |
| Dividend Yield | 2.91% | 4.24% |
| Fiscal Year | 2025 | 2024 |
Efficiency & Valuation Duel: The Vital Signs
Financial ratios serve as a company’s DNA, unveiling hidden risks and revealing operational strengths critical for investment decisions.
Amgen Inc.
Amgen demonstrates robust profitability with an 89% ROE and a strong 21% net margin, signaling efficient capital use. Its P/E of 22.8 suggests a fairly valued stock, while a high P/B of 20.3 flags potential overvaluation. The 2.9% dividend yield rewards shareholders, reflecting a balanced return strategy amid solid R&D investment.
Bristol-Myers Squibb Company
Bristol-Myers Squibb suffers from a negative ROE of -54.8% and a net margin of -18.5%, indicating operational challenges. However, its low P/E at -12.8 is distorted by losses, complicating valuation. A 4.2% dividend yield provides income stability despite financial stress, while its capital allocation favors sustaining operations over aggressive growth.
Valuation Resilience vs. Profitability Stability
Amgen offers superior profitability and disciplined valuation, balancing risk with consistent shareholder returns. Bristol-Myers Squibb’s weaker earnings and higher financial risk offset its attractive dividend yield. Investors prioritizing operational efficiency may prefer Amgen; those seeking income amid volatility might consider Bristol-Myers Squibb’s profile.
Which one offers the Superior Shareholder Reward?
Amgen (AMGN) pays a 2.9% dividend yield with a payout ratio around 66%, supported by robust free cash flow of $15/share. It pairs this with significant buybacks, enhancing shareholder returns sustainably. Bristol-Myers Squibb (BMY) delivers a higher 4.2% yield but suffers negative net margins and a volatile payout ratio, raising sustainability concerns. BMY’s modest buybacks complement dividends, but weak earnings and high leverage risk long-term growth. I find Amgen’s balanced dividend and aggressive buyback strategy offers a superior total return profile in 2026.
Comparative Score Analysis: The Strategic Profile
The radar chart reveals the fundamental DNA and trade-offs of Amgen Inc. and Bristol-Myers Squibb Company, highlighting their core financial strengths and weaknesses:
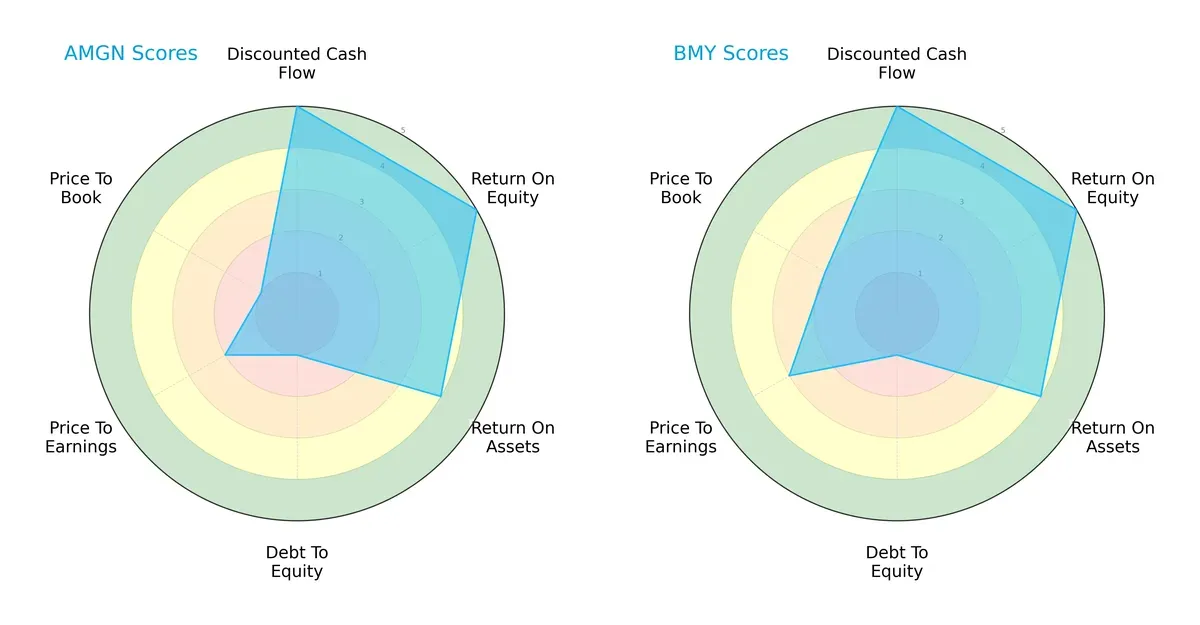
Both firms excel in Discounted Cash Flow and Return on Equity, scoring 5 each, reflecting strong cash generation and efficient equity use. They share favorable Return on Assets at 4, indicating effective asset utilization. Both carry very unfavorable Debt-to-Equity scores of 1, signaling high leverage risks. Bristol-Myers Squibb edges Amgen with better valuation metrics, scoring 3 vs. 2 in P/E and 2 vs. 1 in P/B, suggesting it is relatively less overvalued. Overall, Bristol-Myers Squibb presents a more balanced profile, while Amgen relies heavily on operational efficiency but struggles with valuation and leverage.
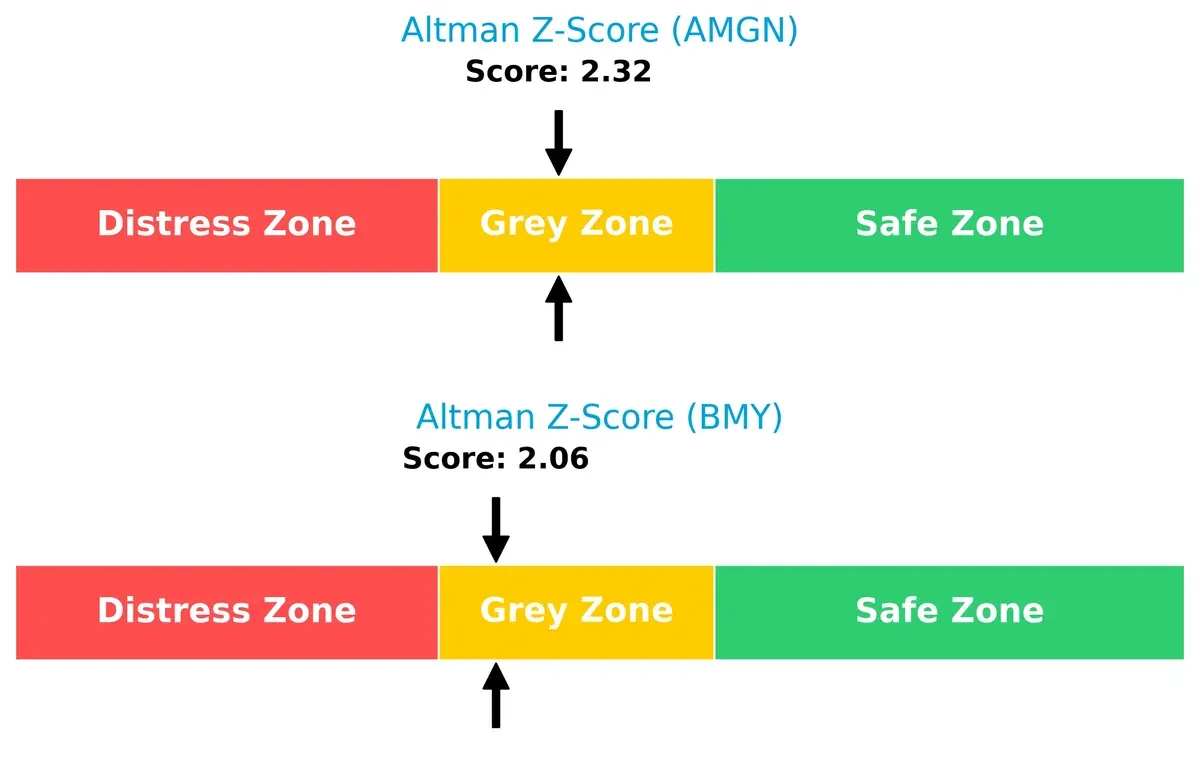
Bankruptcy Risk: Solvency Showdown
Amgen’s Altman Z-Score of 2.32 slightly surpasses Bristol-Myers Squibb’s 2.06, placing both firms in the grey zone: moderate bankruptcy risk in this cycle:
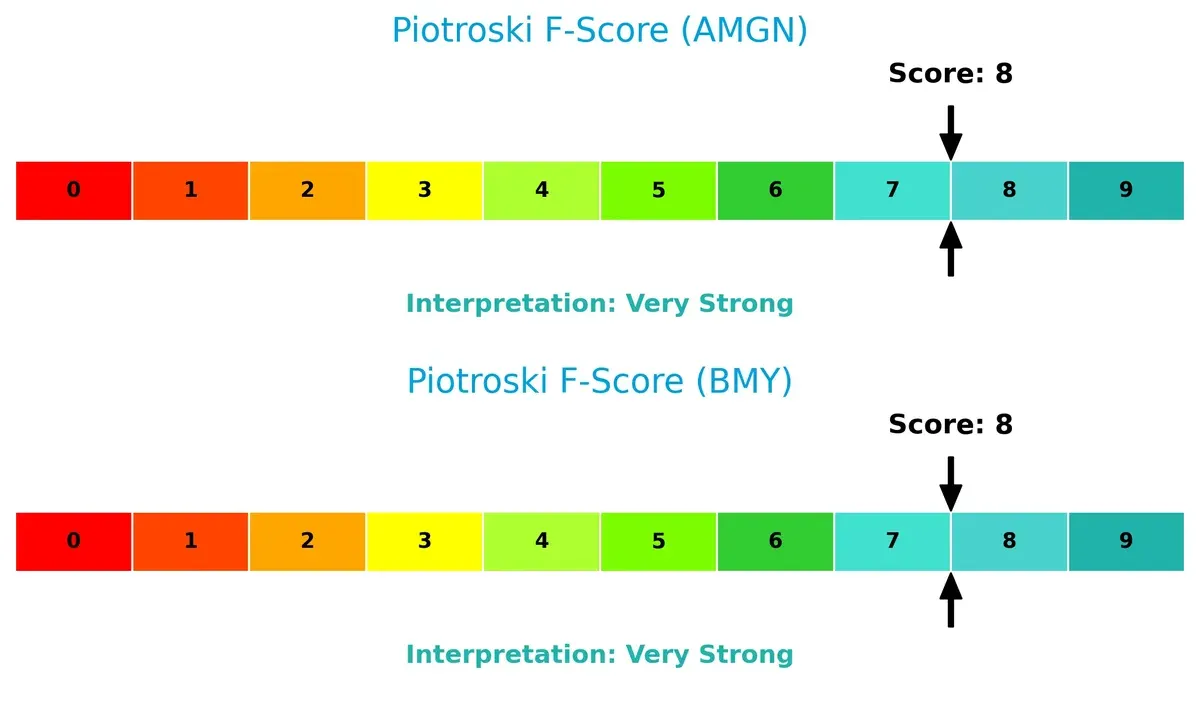
Financial Health: Quality of Operations
Both companies score an impressive 8 on the Piotroski F-Score, indicating very strong financial health and operational quality. Neither shows red flags in internal metrics, making them solid candidates from a financial strength perspective:
How are the two companies positioned?
This section dissects Amgen and Bristol-Myers Squibb’s operational DNA by comparing revenue distribution and internal dynamics. The goal is to confront their economic moats to identify the most resilient, sustainable competitive advantage today.
Revenue Segmentation: The Strategic Mix
This visual comparison dissects how Amgen Inc. and Bristol-Myers Squibb Company diversify their income streams and where their primary sector bets lie:
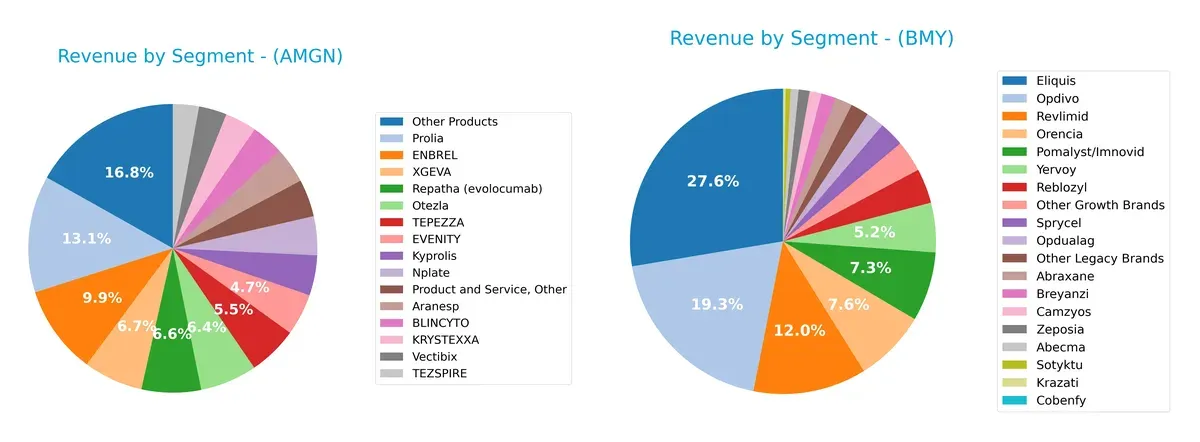
Amgen’s revenue spreads across multiple products, with “Other Products” at $5.63B and ENBREL anchoring at $3.32B. Bristol-Myers Squibb leans heavily on Eliquis, which dwarfs other segments at $13.33B, followed by Opdivo at $9.30B. Amgen’s diversified portfolio reduces concentration risk, while BMY’s reliance on blockbuster drugs exposes it to patent cliffs but benefits from ecosystem lock-in in oncology and cardiology.
Strengths and Weaknesses Comparison
This table compares the Strengths and Weaknesses of Amgen Inc. and Bristol-Myers Squibb Company:
Amgen Strengths
- High profitability with 20.98% net margin
- Strong ROE at 89.06% and ROIC of 18.35%
- Favorable fixed asset turnover at 4.64
- Solid dividend yield of 2.91%
- Diversified product portfolio with multiple top-selling drugs
- Significant US and Non-US revenue presence
Bristol-Myers Squibb Strengths
- Favorable ROIC at 13.59% and WACC at 4.71%
- Positive PE despite losses indicating market potential
- Strong quick ratio at 1.15 supporting liquidity
- Higher dividend yield of 4.24%
- Large US and global revenue streams including Europe and Rest of World
- Presence of multiple high-revenue drugs such as Eliquis and Opdivo
Amgen Weaknesses
- High debt-to-assets ratio at 60.28% and high D/E of 6.31
- Unfavorable price-to-book at 20.34
- Neutral liquidity ratios (current and quick)
- Unfavorable asset turnover at 0.41
- Moderate interest coverage ratio at 4.27
- Heavy reliance on US market for over 70% revenue
Bristol-Myers Squibb Weaknesses
- Negative net margin at -18.53% and ROE at -54.78%
- Unfavorable interest coverage at -3.3 signaling risk
- High leverage with debt-to-assets at 55.29% and D/E of 3.13
- Unfavorable price-to-book at 7.02
- Neutral asset turnover at 0.52
- Revenue concentration in US with significant dependence on few blockbuster drugs
Overall, Amgen demonstrates stronger profitability and operational efficiency but carries higher leverage risks. Bristol-Myers Squibb faces profitability challenges and liquidity risks despite a robust global footprint and promising innovation pipeline. Both must balance debt management with growth initiatives to sustain competitive positioning.
The Moat Duel: Analyzing Competitive Defensibility
A structural moat is the only reliable shield protecting long-term profits from relentless competitive erosion:
Amgen Inc.: Innovation-Driven Cost Advantage
Amgen’s moat stems from its advanced biotech platform and cost-efficient manufacturing. Its 31.98% EBIT margin and 12.65% ROIC premium over WACC confirm robust value creation. New oncology and inflammation therapies in 2026 could deepen this advantage.
Bristol-Myers Squibb Company: Diversified Portfolio & Growth Momentum
Bristol-Myers Squibb leverages a broad drug portfolio and rising ROIC trend, contrasting Amgen’s cost edge. Despite recent margin challenges, its expanding immuno-oncology pipeline promises profitable growth and market disruption ahead.
Innovation Efficiency vs. Portfolio Diversification
Amgen exhibits a wider moat with superior margin stability and efficient capital use. Bristol-Myers Squibb shows strong growth potential but weaker current profitability. Amgen is better positioned to defend and expand market share through operational excellence.
Which stock offers better returns?
The past year shows distinct bullish trends for both stocks, with Amgen Inc. accelerating strongly while Bristol-Myers Squibb Company posts steadier gains and marked buyer dominance recently.
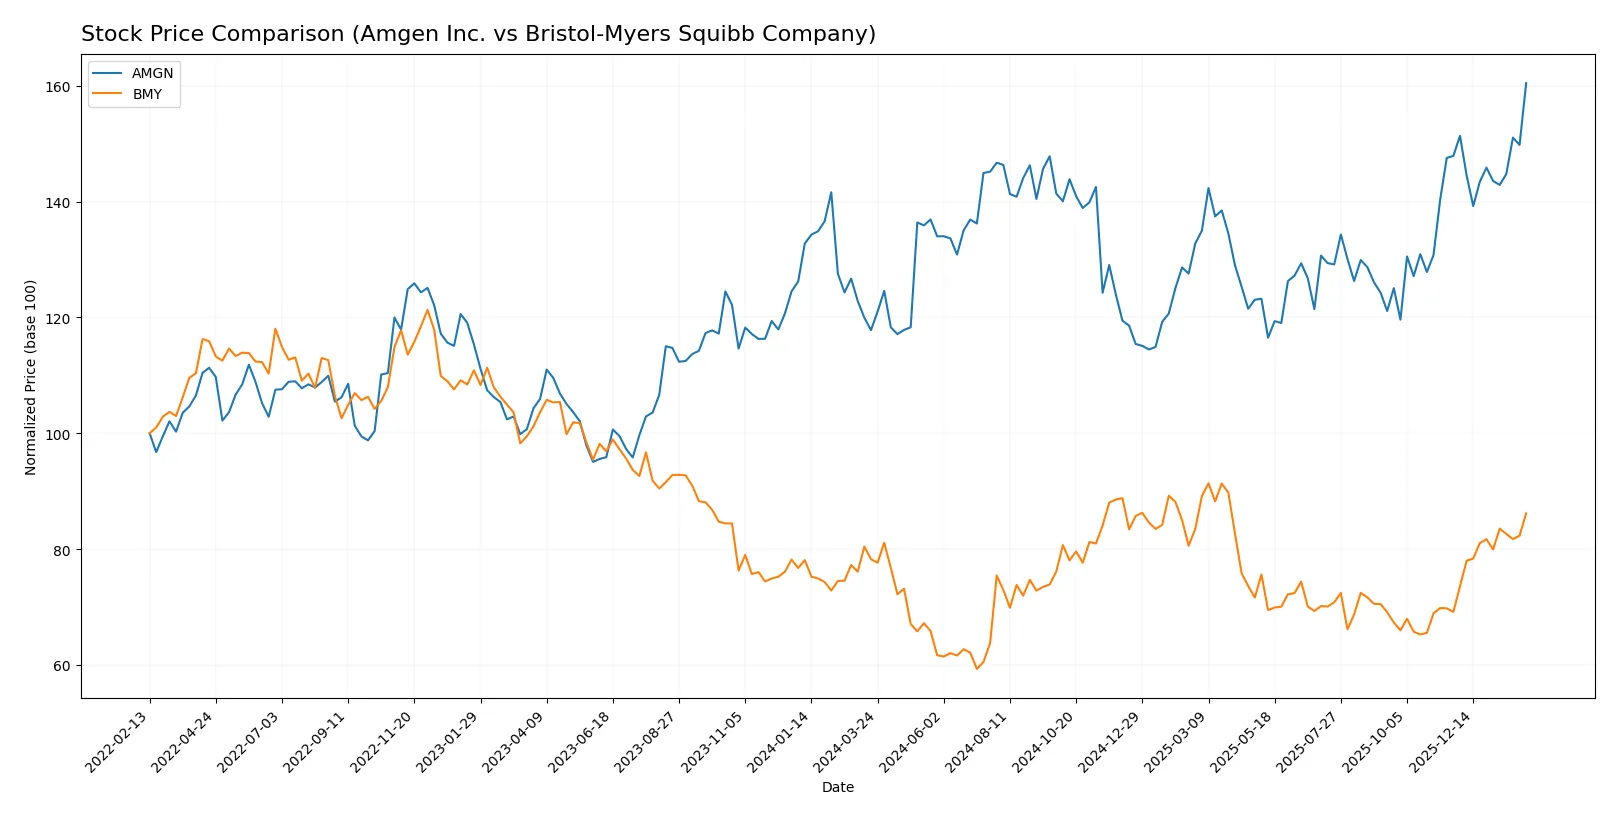
Trend Comparison
Amgen Inc. rose 36.2% over the past 12 months, showing accelerating momentum and high volatility between 261.22 and 366.2 per share. The recent 8.49% gain continues this bullish acceleration.
Bristol-Myers Squibb Company gained 10.09% over the same period with moderate volatility. Its recent 24.58% surge signals accelerating bullish momentum, supported by strong buyer dominance and decreasing volume trend.
Amgen’s 36.2% rise outpaces Bristol-Myers Squibb’s 10.09%, delivering the highest market performance despite higher volatility and volume growth.
Target Prices
Analysts project moderate upside for Amgen Inc. and Bristol-Myers Squibb Company based on current consensus targets.
| Company | Target Low | Target High | Consensus |
|---|---|---|---|
| Amgen Inc. | 309 | 425 | 364.09 |
| Bristol-Myers Squibb Company | 37 | 66 | 58.5 |
The consensus target for Amgen slightly exceeds its current price of 366.2, indicating modest growth expectations. Bristol-Myers Squibb’s consensus target of 58.5 is close to its current price of 57.62, suggesting a stable outlook with limited upside.

Don’t Let Luck Decide Your Entry Point
Optimize your entry points with our advanced ProRealTime indicators. You’ll get efficient buy signals with precise price targets for maximum performance. Start outperforming now!
How do institutions grade them?
The latest institutional grades for Amgen Inc. and Bristol-Myers Squibb Company are summarized below:
Amgen Inc. Grades
This table lists recent grades issued by key financial institutions for Amgen Inc.:
| Grading Company | Action | New Grade | Date |
|---|---|---|---|
| Morgan Stanley | Maintain | Equal Weight | 2026-02-04 |
| Leerink Partners | Maintain | Outperform | 2026-02-04 |
| Citigroup | Maintain | Neutral | 2026-02-04 |
| Cantor Fitzgerald | Maintain | Neutral | 2026-02-04 |
| UBS | Maintain | Buy | 2026-01-26 |
| Bernstein | Downgrade | Market Perform | 2026-01-20 |
| Truist Securities | Maintain | Hold | 2026-01-08 |
| Morgan Stanley | Maintain | Equal Weight | 2025-12-12 |
| Wells Fargo | Maintain | Equal Weight | 2025-12-10 |
| BMO Capital | Maintain | Outperform | 2025-12-03 |
Bristol-Myers Squibb Company Grades
Recent institutional grade updates for Bristol-Myers Squibb Company are as follows:
| Grading Company | Action | New Grade | Date |
|---|---|---|---|
| Piper Sandler | Maintain | Overweight | 2026-01-28 |
| Citigroup | Maintain | Neutral | 2026-01-27 |
| Leerink Partners | Maintain | Outperform | 2026-01-13 |
| Scotiabank | Maintain | Sector Perform | 2026-01-09 |
| UBS | Upgrade | Buy | 2026-01-07 |
| Citigroup | Maintain | Neutral | 2026-01-07 |
| B of A Securities | Upgrade | Buy | 2025-12-15 |
| Morgan Stanley | Maintain | Underweight | 2025-12-12 |
| Guggenheim | Upgrade | Buy | 2025-12-12 |
| Wells Fargo | Maintain | Equal Weight | 2025-12-10 |
Which company has the best grades?
Bristol-Myers Squibb shows stronger upgrades and more “Buy” ratings from UBS, B of A Securities, and Guggenheim. Amgen holds a mix of “Outperform” and “Equal Weight” ratings, with one downgrade. Investors may interpret Bristol-Myers Squibb’s higher buy-side momentum as a signal of greater institutional confidence.
Risks specific to each company
The following categories identify the critical pressure points and systemic threats facing both firms in the 2026 market environment:
1. Market & Competition
Amgen Inc.
- Strong presence in inflammation and oncology but faces intense competition from biosimilars and generics.
Bristol-Myers Squibb Company
- Diverse oncology and immunology portfolio, pressured by patent cliffs and emerging biotech rivals.
2. Capital Structure & Debt
Amgen Inc.
- High debt-to-assets at 60.3% signals leverage risk despite solid interest coverage (4.27x).
Bristol-Myers Squibb Company
- Debt-to-assets at 55.3% with negative interest coverage (-3.3x) raises significant financial stability concerns.
3. Stock Volatility
Amgen Inc.
- Beta of 0.47 indicates lower volatility, offering relative market stability.
Bristol-Myers Squibb Company
- Even lower beta at 0.30, suggesting defensive stock characteristics amid market fluctuations.
4. Regulatory & Legal
Amgen Inc.
- Faces regulatory scrutiny typical for biotech but diversified product approvals mitigate risk.
Bristol-Myers Squibb Company
- Heavy exposure to patent litigation and FDA approvals, elevating legal costs and market uncertainty.
5. Supply Chain & Operations
Amgen Inc.
- Operations benefit from established manufacturing but asset turnover (0.41) is suboptimal.
Bristol-Myers Squibb Company
- Slightly better asset turnover (0.52) but complex global supply chains increase operational risk.
6. ESG & Climate Transition
Amgen Inc.
- Actively invests in sustainability but faces sector-wide challenges in carbon footprint reduction.
Bristol-Myers Squibb Company
- Similar ESG commitments but slower progress on climate targets may impact long-term investor sentiment.
7. Geopolitical Exposure
Amgen Inc.
- Global operations expose it to trade tensions and regulatory shifts, especially in Asia.
Bristol-Myers Squibb Company
- Equally exposed globally, with additional risks from evolving US healthcare policies and international markets.
Which company shows a better risk-adjusted profile?
Amgen’s most impactful risk is its high leverage, though stable interest coverage cushions default risk. Bristol-Myers Squibb struggles with negative interest coverage and weak profitability, a red flag in capital structure. Amgen’s lower stock volatility and more favorable operational metrics give it a better risk-adjusted profile, despite both firms operating in a challenging regulatory and competitive landscape. Recent data showing Bristol-Myers’ negative net margin (-18.5%) underscores its earnings vulnerability, justifying heightened caution.
Final Verdict: Which stock to choose?
Amgen Inc. stands out with its exceptional ability to generate strong returns on invested capital well above its cost of capital. This cash machine boasts robust income quality and a rapidly growing moat, signaling durable competitive advantage. Its elevated leverage and asset turnover warrant vigilance. Best suited for aggressive growth portfolios.
Bristol-Myers Squibb Company’s strategic moat lies in its steadily improving ROIC and solid free cash flow yield, supported by a safer balance sheet relative to Amgen. Its recurring revenue and dividend yield enhance stability, appealing more to investors favoring Growth at a Reasonable Price (GARP). However, profitability concerns remain a point of caution.
If you prioritize strong capital efficiency and high return potential, Amgen outshines with its superior profitability and growth trajectory. However, if you seek better financial stability combined with consistent cash flow, Bristol-Myers Squibb offers a more balanced profile. Both present compelling but distinct analytical scenarios for different investor avatars.
Disclaimer: Investment carries a risk of loss of initial capital. The past performance is not a reliable indicator of future results. Be sure to understand risks before making an investment decision.
Go Further
I encourage you to read the complete analyses of Amgen Inc. and Bristol-Myers Squibb Company to enhance your investment decisions: