Home > Comparison > Healthcare > AMGN vs BIIB
The strategic rivalry between Amgen Inc. and Biogen Inc. shapes the healthcare sector’s innovation landscape. Amgen, a diversified drug manufacturer, focuses on inflammation and oncology with a broad therapeutic portfolio. Biogen, by contrast, specializes in neurological and neurodegenerative diseases, leveraging targeted therapies. This analysis pits Amgen’s scale and diversification against Biogen’s niche expertise to identify which offers a superior risk-adjusted return for a balanced portfolio in 2026.
Table of contents
Companies Overview
Amgen Inc. and Biogen Inc. shape the competitive landscape of innovative drug manufacturing with distinct market footprints.
Amgen Inc.: Biotech Powerhouse with Broad Therapeutic Reach
Amgen stands as a leader in human therapeutics, generating revenue by developing and marketing treatments across oncology, cardiovascular, and autoimmune diseases. Its strategic focus in 2026 emphasizes expanding its collaboration network and advancing pipeline assets in inflammation and neuroscience. Amgen’s robust product portfolio and global distribution channels underpin its dominant market position.
Biogen Inc.: Neurology and Neurodegenerative Specialist
Biogen specializes in therapies for neurological disorders, driving revenue through treatments for multiple sclerosis and Alzheimer’s disease. Its 2026 strategy centers on advancing novel neuroimmunology and neurodegenerative pipeline candidates while leveraging biosimilars to diversify offerings. Biogen’s concentrated expertise in neuro therapies forms its distinct competitive advantage.
Strategic Collision: Similarities & Divergences
Both firms operate in drug manufacturing but diverge in scope—Amgen pursues a broad therapeutic portfolio, while Biogen focuses narrowly on neurology. Their primary battleground is innovation leadership in specialty biologics. Amgen’s scale and diversified pipeline contrast with Biogen’s targeted neurocentric approach, creating two investment profiles rooted in different risk and growth dynamics.
Income Statement Comparison
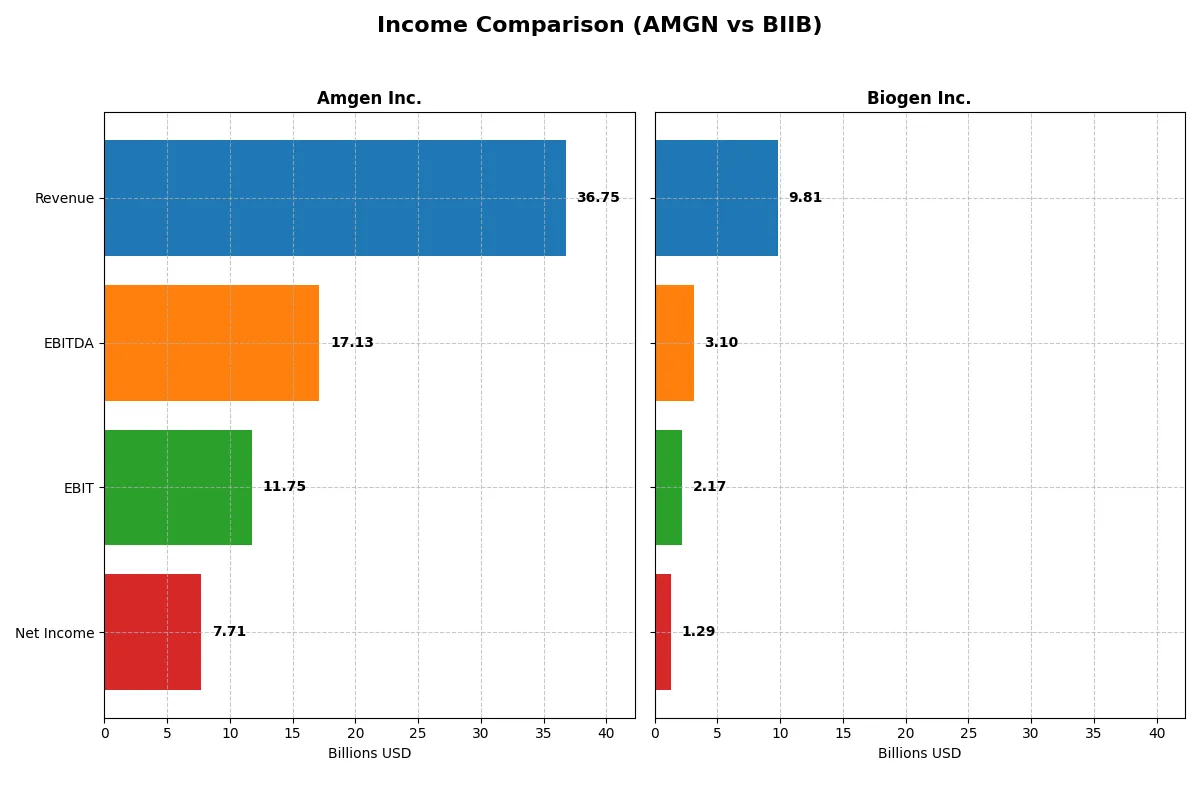
This data dissects the core profitability and scalability of both corporate engines to reveal who dominates the bottom line:
| Metric | Amgen Inc. (AMGN) | Biogen Inc. (BIIB) |
|---|---|---|
| Revenue | 36.8B | 9.8B |
| Cost of Revenue | 6.4B | 2.9B |
| Operating Expenses | 15.4B | 5.0B |
| Gross Profit | 30.3B | 6.9B |
| EBITDA | 17.1B | 3.1B |
| EBIT | 11.8B | 2.2B |
| Interest Expense | 2.8B | 0.2B |
| Net Income | 7.7B | 1.3B |
| EPS | 14.33 | 8.85 |
| Fiscal Year | 2025 | 2025 |
Income Statement Analysis: The Bottom-Line Duel
The income statement comparison reveals each company’s operational efficiency and profitability strength through recent financial performance metrics.
Amgen Inc. Analysis
Amgen’s revenue surged from 26.0B in 2021 to 36.7B in 2025, reflecting robust growth momentum. Net income rose sharply to 7.7B in 2025, driving a favorable net margin near 21%. Its gross margin remains strong above 82%, and EBIT margin improved impressively to nearly 32%, underscoring operational efficiency gains.
Biogen Inc. Analysis
Biogen’s revenue declined slightly from 11.0B in 2021 to 9.8B in 2025, with net income contracting to 1.3B. Despite a solid gross margin of 70%, Biogen’s net margin sits at a modest 13%. The EBIT margin stands at 22%, but recent declines in revenue and earnings indicate weakening profitability and operational challenges.
Growth and Margin Strength vs. Decline and Compression
Amgen outpaces Biogen decisively with nearly 10% annual revenue growth and strong margin expansion. Biogen faces revenue shrinkage and falling net margins, signaling deteriorating income statement health. For investors, Amgen’s profile offers a more attractive combination of scale, growth, and profitability resilience.
Financial Ratios Comparison
These vital ratios act as a diagnostic tool to expose the underlying fiscal health, valuation premiums, and capital efficiency of the companies compared below:
| Ratios | Amgen Inc. (AMGN) | Biogen Inc. (BIIB) |
|---|---|---|
| ROE | 89.1% | 7.08% |
| ROIC | 18.4% | 6.62% |
| P/E | 22.8 | 19.96 |
| P/B | 20.3 | 1.41 |
| Current Ratio | 1.14 | 2.68 |
| Quick Ratio | 0.90 | 2.03 |
| D/E | 6.31 | 0.38 |
| Debt-to-Assets | 60.3% | 23.6% |
| Interest Coverage | 5.41 | 7.63 |
| Asset Turnover | 0.41 | 0.33 |
| Fixed Asset Turnover | 4.64 | 2.95 |
| Payout ratio | 66.4% | 0% |
| Dividend yield | 2.91% | 0% |
| Fiscal Year | 2025 | 2025 |
Efficiency & Valuation Duel: The Vital Signs
Financial ratios serve as a company’s DNA, uncovering hidden risks and operational strengths that numbers alone cannot reveal.
Amgen Inc.
Amgen demonstrates robust profitability with an 89.06% ROE and 20.98% net margin, signaling operational excellence. The P/E ratio at 22.84 indicates a fairly valued stock, though a high P/B ratio hints at stretched valuation. Shareholders benefit from a 2.91% dividend yield, reflecting steady income distribution alongside solid reinvestment in R&D.
Biogen Inc.
Biogen posts a modest 7.08% ROE and 13.18% net margin, suggesting moderate profitability. Its P/E ratio of 19.96 appears reasonable, supported by a low P/B of 1.41, indicating undervaluation. The absence of dividends points to a growth-focused strategy, prioritizing reinvestment into research and operations to enhance future value.
Dividend Yield vs. Growth Focus: Balancing Value and Reinvestment
Amgen offers higher returns through dividends and superior profitability but carries some valuation stretch. Biogen presents a healthier balance sheet and favorable valuation, yet weaker returns and no dividend. Income investors may prefer Amgen, while growth-oriented investors might find Biogen’s reinvestment approach more appealing.
Which one offers the Superior Shareholder Reward?
I observe Amgen Inc. offers a dividend yield near 3%, supported by a payout ratio around 66%, signaling a strong income stream. Amgen also deploys buybacks, enhancing total returns sustainably. Biogen Inc. pays no dividends, reinvesting free cash flow into R&D and growth, with a lean buyback program. Given Amgen’s consistent dividend backed by solid free cash flow and moderate payout, its shareholder reward model appears more reliable and attractive in 2026. I conclude Amgen provides superior total shareholder return potential versus Biogen’s growth-focused but dividend-absent approach.
Comparative Score Analysis: The Strategic Profile
The radar chart reveals the fundamental DNA and trade-offs of Amgen Inc. and Biogen Inc., showcasing their financial strengths and vulnerabilities:
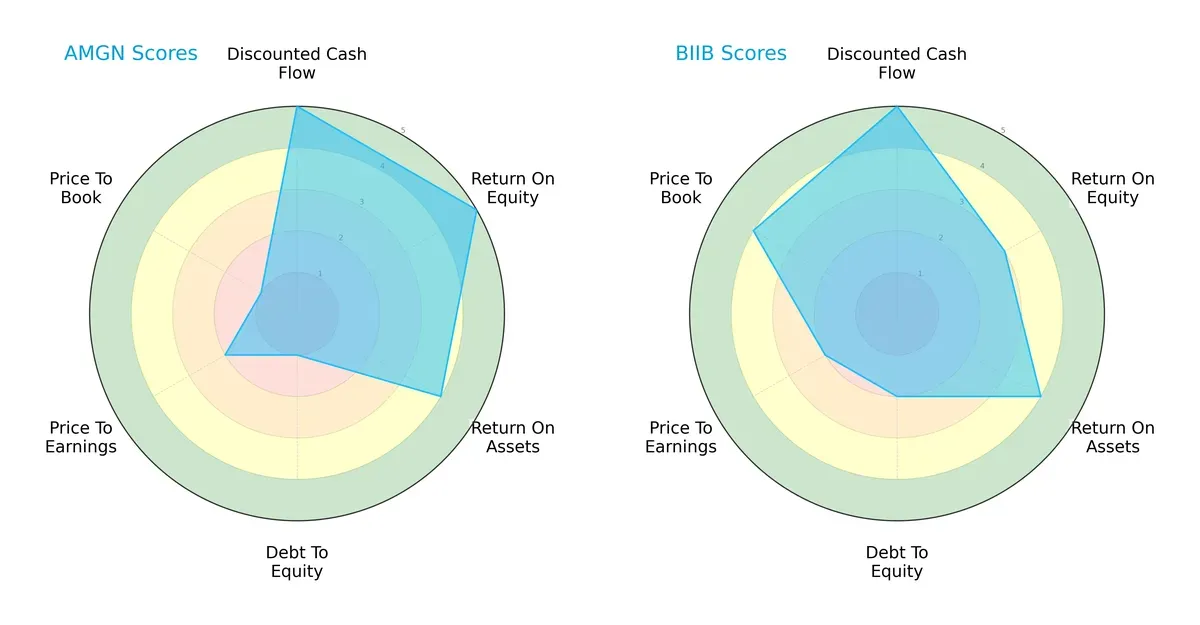
Amgen excels in return on equity (5 vs. 3) and discounted cash flow (both at 5), signaling superior profitability and cash flow generation. However, it suffers from a weak debt-to-equity score (1 vs. 2) and valuation metrics, indicating higher financial risk and possible overvaluation. Biogen presents a more balanced profile with better price-to-book (4 vs. 1) and a slightly stronger debt position. Overall, Biogen offers a steadier risk-return trade-off, while Amgen relies heavily on operational efficiency but carries more leverage risk.
Bankruptcy Risk: Solvency Showdown
Amgen’s Altman Z-Score stands at 2.32 (grey zone), while Biogen scores a safer 3.37 (safe zone), suggesting:
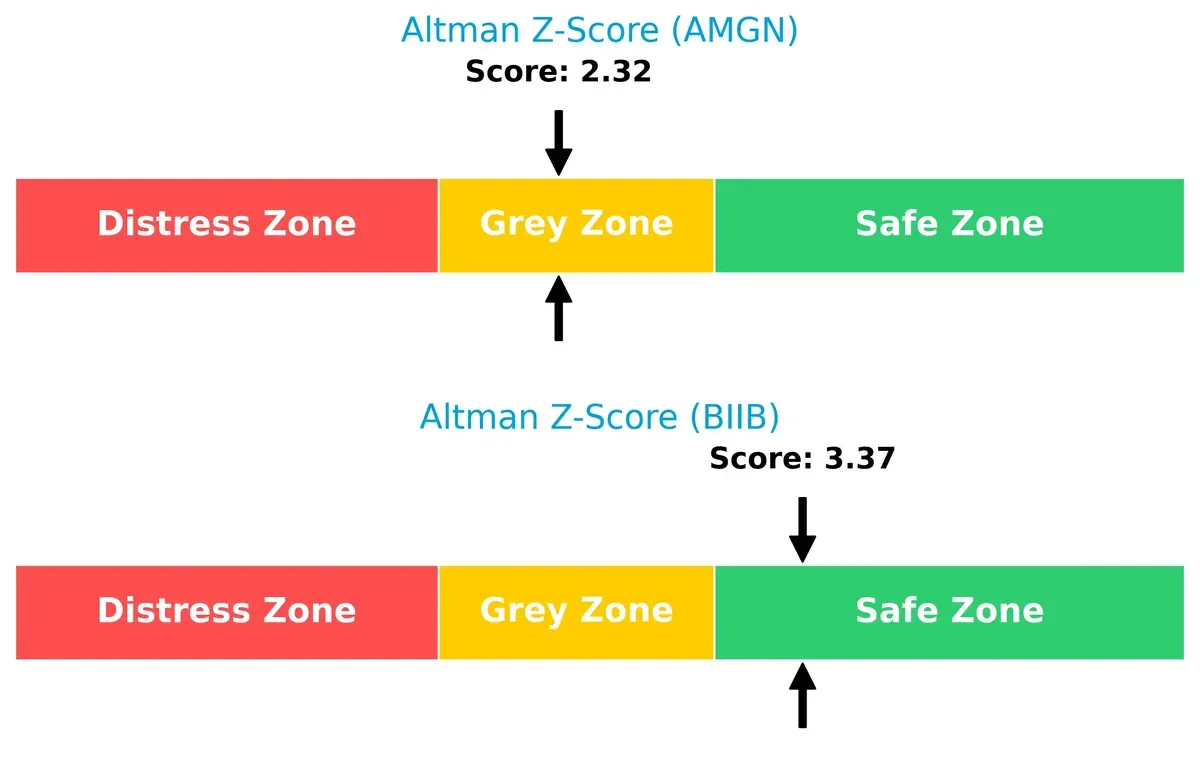
Biogen holds a clearer buffer against bankruptcy risk in this cycle. Amgen’s moderate score warns investors to watch leverage and liquidity closely, reflecting potential distress under adverse conditions.
Financial Health: Quality of Operations
Amgen’s Piotroski F-Score is a strong 8, surpassing Biogen’s average 6, indicating:
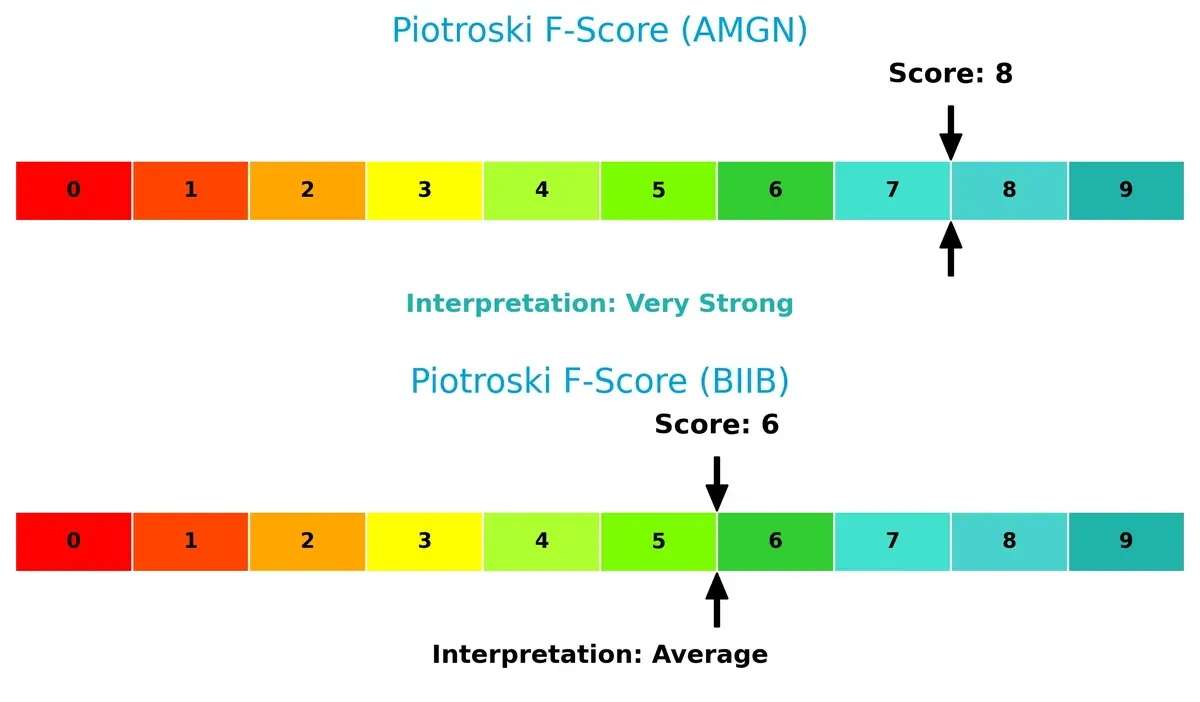
Amgen demonstrates superior internal financial health and operational quality. Biogen’s lower score flags room for improvement in efficiency or profitability metrics. This gap underscores Amgen’s current advantage in financial robustness despite its higher leverage risk.
How are the two companies positioned?
This section dissects Amgen’s and Biogen’s operational DNA by comparing their revenue distribution and internal dynamics. The goal is to confront their economic moats and identify which model delivers the most resilient, sustainable competitive advantage today.
Revenue Segmentation: The Strategic Mix
This visual comparison dissects how Amgen Inc. and Biogen Inc. diversify their income streams and where their primary sector bets lie:
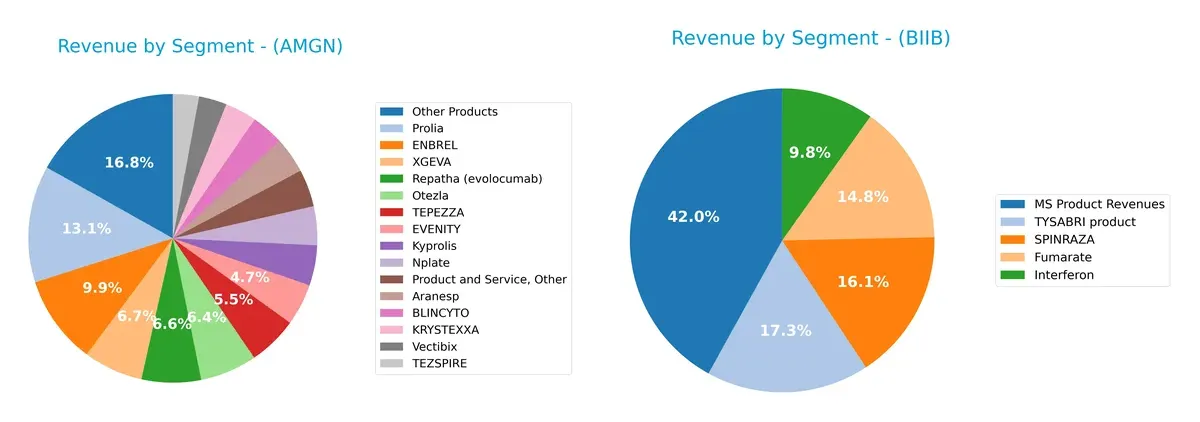
Amgen displays a broad revenue mix with multiple billion-dollar products like Enbrel ($3.3B), Prolia ($4.4B), and Other Products ($5.6B). Biogen, by contrast, pivots around MS Product Revenues ($4.0B), with fewer significant segments. Amgen’s diversified portfolio reduces concentration risk, supporting resilience. Biogen leans heavily on multiple sclerosis therapies, which anchors its ecosystem but poses exposure risks if market dynamics shift.
Strengths and Weaknesses Comparison
This table compares the strengths and weaknesses of Amgen and Biogen based on diversification, profitability, financials, innovation, global presence, and market share:
Amgen Strengths
- Broad product portfolio with multiple top-selling drugs
- High net margin and ROE indicate strong profitability
- Favorable ROIC above WACC supports value creation
- Significant U.S. and non-U.S. sales show global reach
- Solid dividend yield enhances investor appeal
Biogen Strengths
- Favorable net margin with lower leverage supports financial stability
- Strong liquidity ratios indicate good short-term financial health
- Lower debt-to-assets ratio reduces financial risk
- Diverse MS product revenues and innovation in SPINRAZA and TYSABRI
- Balanced U.S. and international sales contribute to geographic diversification
Amgen Weaknesses
- High debt-to-assets ratio signals financial risk
- Elevated price-to-book ratio suggests overvaluation concerns
- Moderate current and quick ratios limit liquidity flexibility
- Lower asset turnover implies less efficient asset use
- Heavy dependence on U.S. market limits geographic balance
Biogen Weaknesses
- Low ROE indicates weak shareholder returns
- Zero dividend yield may deter income-focused investors
- Asset turnover remains unfavorable, reducing operational efficiency
- Smaller product portfolio limits diversification
- Lower fixed asset turnover may impact capital productivity
Amgen’s strengths lie in its diversified, high-margin product base and global sales, offset by financial leverage and valuation concerns. Biogen shows financial prudence and geographic balance but faces challenges in profitability and asset efficiency. These contrasts shape each company’s strategic focus on growth and risk management.
The Moat Duel: Analyzing Competitive Defensibility
A structural moat is the only reliable shield protecting long-term profits from relentless competitive erosion. Let’s dissect how these two biopharma giants defend their turf:
Amgen Inc.: Durable Innovation and Scale Moat
Amgen’s moat stems from its robust intangible assets and economies of scale. I see this reflected in its very favorable ROIC 12.7% above WACC and stable 31.98% EBIT margin. In 2026, expanding oncology and inflammation portfolios deepen its moat, though biosimilar competition looms.
Biogen Inc.: Niche Neuroscience Expertise with Waning Returns
Biogen’s moat is anchored in specialized neurological therapies, unlike Amgen’s broader scale. Its ROIC barely clears WACC by 2.2%, and EBIT margin at 22.07% trails Amgen. Declining ROIC signals margin pressure, yet pipeline innovations could stabilize market share if successful.
Innovation Scale vs. Niche Depth: The Moat Showdown
Amgen’s wider moat leverages scale and diverse therapies, producing stronger capital efficiency and margin stability. Biogen’s niche focus offers a narrower moat, vulnerable to pipeline execution risks. I judge Amgen better positioned to defend and grow its competitive edge in 2026.
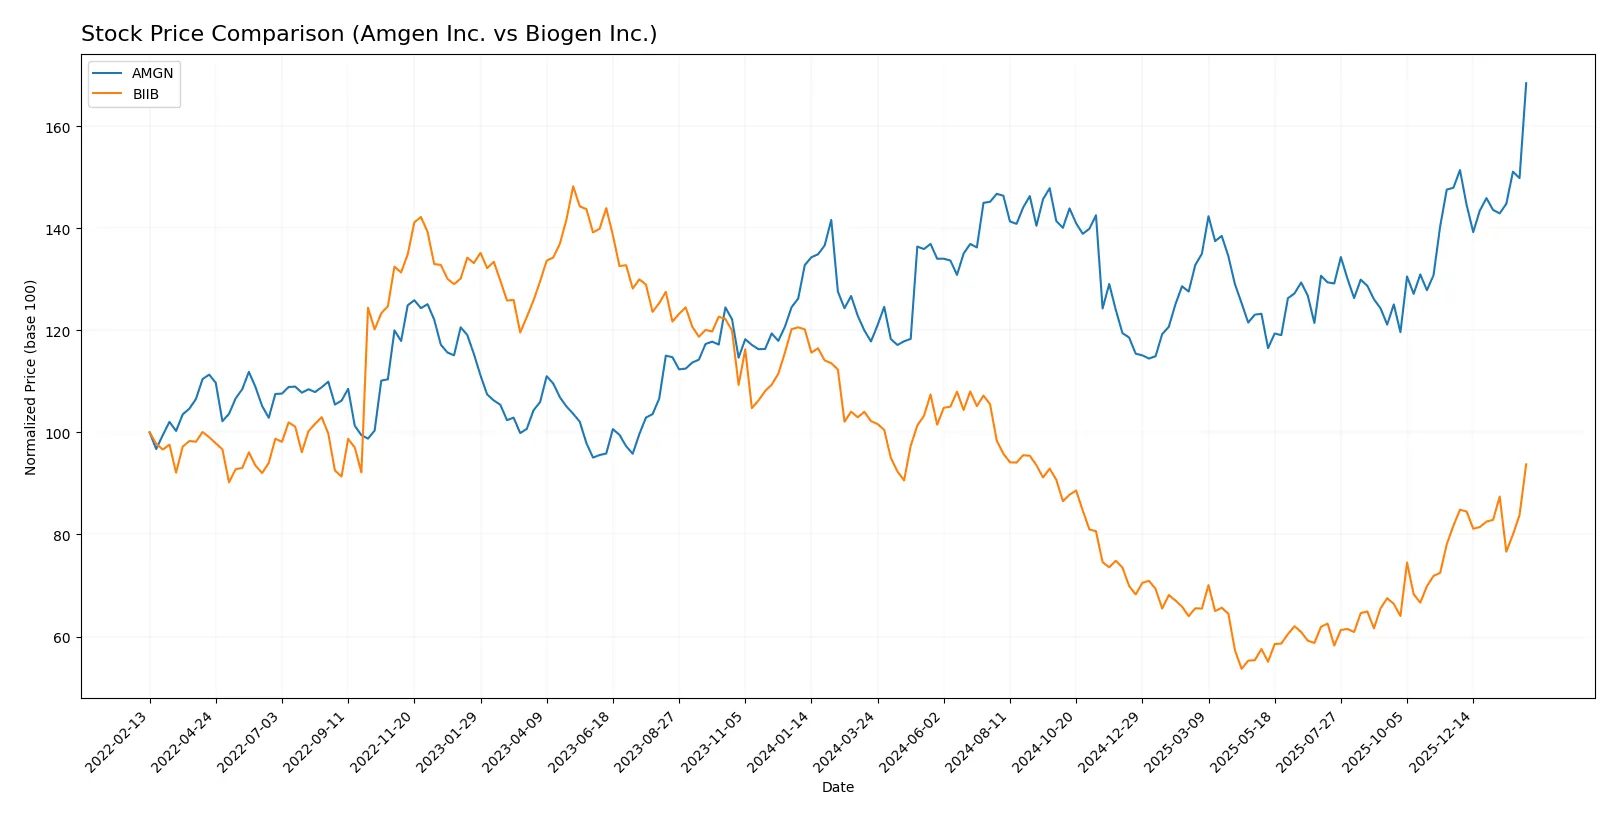
Which stock offers better returns?
Over the past year, Amgen Inc. surged 43%, showing accelerating gains and strong buyer dominance, while Biogen Inc. declined 8%, despite recent positive momentum and increased buying activity.
Trend Comparison
Amgen Inc. posted a bullish 43% rise over 12 months, with accelerating momentum and a high of 384.32. The trend shows strong buyer dominance and increasing volume.
Biogen Inc. suffered an 8% decline over the same period, marking a bearish trend despite recent 15% gains and strong buyer dominance, yet higher volatility persists.
Amgen’s 43% growth clearly outperforms Biogen’s 8% loss, delivering the highest market returns in this comparison.
Target Prices
Analysts present a mixed but cautiously optimistic target consensus for Amgen Inc. and Biogen Inc.
| Company | Target Low | Target High | Consensus |
|---|---|---|---|
| Amgen Inc. | 309 | 425 | 364.09 |
| Biogen Inc. | 143 | 250 | 188.75 |
Amgen’s consensus target sits slightly below its current price of 384, suggesting limited upside or possible consolidation. Biogen’s target consensus at 188.75 is modestly below its current 201, indicating cautious sentiment despite recent gains.

Don’t Let Luck Decide Your Entry Point
Optimize your entry points with our advanced ProRealTime indicators. You’ll get efficient buy signals with precise price targets for maximum performance. Start outperforming now!
How do institutions grade them?
Amgen Inc. Grades
Here are the recent institutional grades for Amgen Inc.:
| Grading Company | Action | New Grade | Date |
|---|---|---|---|
| Morgan Stanley | Maintain | Equal Weight | 2026-02-04 |
| Citigroup | Maintain | Neutral | 2026-02-04 |
| Leerink Partners | Maintain | Outperform | 2026-02-04 |
| Cantor Fitzgerald | Maintain | Neutral | 2026-02-04 |
| UBS | Maintain | Buy | 2026-01-26 |
| Bernstein | Downgrade | Market Perform | 2026-01-20 |
| Truist Securities | Maintain | Hold | 2026-01-08 |
| Morgan Stanley | Maintain | Equal Weight | 2025-12-12 |
| Wells Fargo | Maintain | Equal Weight | 2025-12-10 |
| BMO Capital | Maintain | Outperform | 2025-12-03 |
Biogen Inc. Grades
Below are the latest institutional grades for Biogen Inc.:
| Grading Company | Action | New Grade | Date |
|---|---|---|---|
| Oppenheimer | Maintain | Outperform | 2026-01-30 |
| Citigroup | Maintain | Neutral | 2026-01-27 |
| Truist Securities | Maintain | Hold | 2026-01-08 |
| Citigroup | Maintain | Neutral | 2026-01-07 |
| Morgan Stanley | Maintain | Equal Weight | 2025-12-12 |
| Wells Fargo | Maintain | Equal Weight | 2025-12-10 |
| HSBC | Downgrade | Reduce | 2025-12-10 |
| Piper Sandler | Maintain | Neutral | 2025-11-21 |
| Stifel | Upgrade | Buy | 2025-11-06 |
| Bernstein | Maintain | Market Perform | 2025-11-03 |
Which company has the best grades?
Both companies receive a mix of neutral and outperform ratings. Amgen shows more “Outperform” and “Buy” grades from major firms, while Biogen has a few downgrades and more “Neutral” ratings. Amgen’s stronger grades could attract more investor confidence.
Risks specific to each company
The following categories identify critical pressure points and systemic threats facing Amgen Inc. and Biogen Inc. in the 2026 market environment:
1. Market & Competition
Amgen Inc.
- Strong product portfolio with oncology and inflammation focus supports resilience against competition.
Biogen Inc.
- Narrower neurological focus increases vulnerability to competitive innovation and patent cliffs.
2. Capital Structure & Debt
Amgen Inc.
- High debt-to-assets (60%) and debt/equity ratio (6.31) signal elevated financial leverage risk.
Biogen Inc.
- Low debt-to-assets (23.6%) and debt/equity (0.38) reflect conservative balance sheet, reducing default risk.
3. Stock Volatility
Amgen Inc.
- Beta of 0.47 indicates moderate stock volatility, less sensitive to market swings.
Biogen Inc.
- Lower beta at 0.16 signals greater stock stability amid market fluctuations.
4. Regulatory & Legal
Amgen Inc.
- Broad therapeutic areas expose Amgen to diverse regulatory environments, increasing compliance complexity.
Biogen Inc.
- Heavy dependence on neurodegenerative therapies heightens risk from regulatory setbacks or approvals.
5. Supply Chain & Operations
Amgen Inc.
- Large-scale manufacturing and global distribution pose operational risks but benefit from scale.
Biogen Inc.
- Smaller scale and specialized products can cause greater disruption impact from supply chain issues.
6. ESG & Climate Transition
Amgen Inc.
- Established ESG initiatives support sustainability but must navigate evolving climate regulations.
Biogen Inc.
- ESG efforts less mature; may face increasing pressure to align with climate transition standards.
7. Geopolitical Exposure
Amgen Inc.
- Global footprint includes exposure to trade tensions and international policy shifts.
Biogen Inc.
- More US-centric operations reduce direct geopolitical risks but limit diversification benefits.
Which company shows a better risk-adjusted profile?
Amgen’s highest risk lies in its heavy financial leverage, which could pressure its credit profile during economic downturns. Biogen’s main risk stems from regulatory dependency on neurological drug approvals. Biogen’s lower leverage and stronger liquidity present a better risk-adjusted profile. Notably, Biogen’s Altman Z-Score places it in the safe zone, while Amgen remains in the grey zone, underscoring Biogen’s relative financial stability in 2026.
Final Verdict: Which stock to choose?
Amgen Inc. wields a formidable economic moat, driven by a robust ROIC well above its cost of capital, signaling efficient capital allocation and value creation. Its main point of vigilance lies in a heavy debt load, which could pressure financial flexibility. This stock suits investors targeting aggressive growth with a tolerance for leverage risk.
Biogen Inc. offers a strategic moat rooted in financial stability, with a strong balance sheet and favorable liquidity metrics. Though its profitability growth is lagging, its lower leverage and modest valuation appeal to those valuing safety. Biogen fits well within a GARP (Growth at a Reasonable Price) portfolio seeking steadier risk-adjusted returns.
If you prioritize sustained value creation and high growth potential, Amgen outshines with superior capital efficiency and growth momentum despite leverage concerns. However, if you seek better stability and balance sheet strength with reasonable valuation, Biogen offers a safer profile, albeit with slower growth. Both present distinct analytical scenarios tailored to differing investor risk appetites.
Disclaimer: Investment carries a risk of loss of initial capital. The past performance is not a reliable indicator of future results. Be sure to understand risks before making an investment decision.
Go Further
I encourage you to read the complete analyses of Amgen Inc. and Biogen Inc. to enhance your investment decisions: