Home > Comparison > Industrials > AME vs XYL
The strategic rivalry between AMETEK, Inc. and Xylem Inc. shapes the evolution of the industrial machinery sector. AMETEK operates as a diversified manufacturer of electronic instruments and electromechanical devices, while Xylem focuses on engineered water solutions across infrastructure and applied water segments. This analysis explores their contrasting operational models and growth trajectories to identify which company offers a superior risk-adjusted return for a well-diversified investment portfolio.
Table of contents
Companies Overview
AMETEK and Xylem drive critical industrial machinery markets with distinct focuses on electronic instruments and water solutions.
AMETEK, Inc.: Precision Instruments Leader
AMETEK dominates the electronic instruments and electromechanical devices market. It generates revenue through two segments: Electronic Instruments serving aerospace, industrial, and laboratory sectors, and Electromechanical offering motors, sensors, and precision metal products. In 2026, AMETEK’s strategy centers on expanding its portfolio in process automation and aerospace instrumentation, leveraging its broad industrial footprint.
Xylem Inc.: Water Technology Innovator
Xylem specializes in engineered products for water and wastewater management. It earns revenue via three segments: Water Infrastructure, Applied Water, and Measurement & Control Solutions, focusing on pumps, filtration, and smart water network technologies. In 2026, Xylem prioritizes smart water solutions and digital analytics to enhance infrastructure resilience and operational efficiency globally.
Strategic Collision: Similarities & Divergences
Both companies compete in industrial machinery but with contrasting philosophies: AMETEK emphasizes precision instrumentation across diverse sectors, while Xylem pursues an integrated water technology ecosystem. Their primary battleground is industrial infrastructure modernization, where advanced controls and analytics matter most. Investors face distinct profiles—AMETEK offers diversified industrial exposure, Xylem presents growth through water technology innovation.
Income Statement Comparison
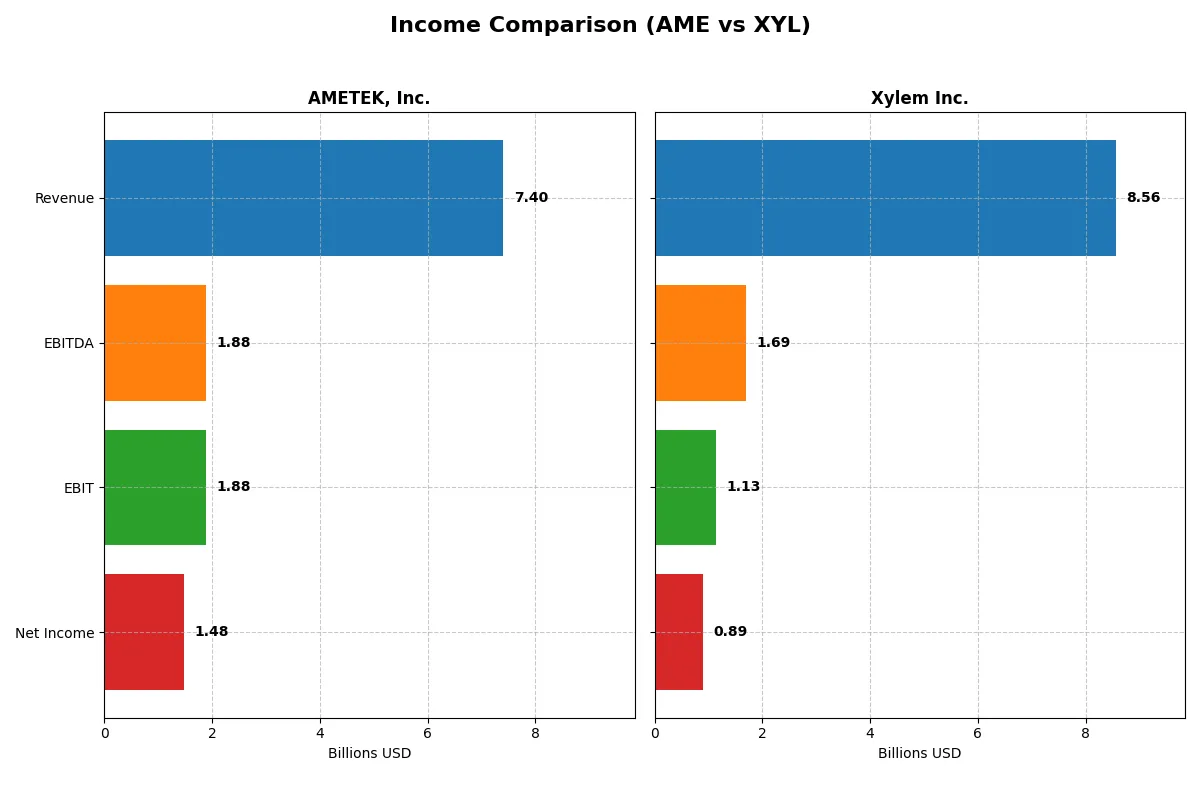
The following data dissects the core profitability and scalability of both corporate engines to reveal who dominates the bottom line:
| Metric | AMETEK, Inc. (AME) | Xylem Inc. (XYL) |
|---|---|---|
| Revenue | 7.4B | 8.6B |
| Cost of Revenue | 4.7B | 5.4B |
| Operating Expenses | 757M | 2.2B |
| Gross Profit | 2.7B | 3.2B |
| EBITDA | 1.9B | 1.7B |
| EBIT | 1.9B | 1.1B |
| Interest Expense | 81M | 44M |
| Net Income | 1.5B | 890M |
| EPS | 6.42 | 3.67 |
| Fiscal Year | 2025 | 2024 |
Income Statement Analysis: The Bottom-Line Duel
This income statement comparison exposes which company runs a more efficient and profitable corporate engine over recent years.
AMETEK, Inc. Analysis
AMETEK shows steady revenue growth, reaching 7.4B in 2025 with net income climbing to 1.48B. Its gross margin holds firm at 36.4%, while net margin sits at a strong 20%. In 2025, AMETEK’s operating efficiency sustains momentum despite modest revenue growth, signaling disciplined cost control.
Xylem Inc. Analysis
Xylem’s revenue surged to 8.56B in 2024, lifting net income to 890M. Its gross margin stands slightly higher at 37.5%, though net margin trails at 10.4%. The company demonstrates robust top-line expansion and margin improvement, with EBIT growth accelerating over 65% in the latest year, reflecting aggressive operational scaling.
Margin Strength vs. Growth Velocity
AMETEK dominates in profitability with superior net margins and consistent earnings growth, while Xylem outpaces in revenue expansion and EBIT momentum. Fundamentally, AMETEK’s margin power offers a more resilient earnings profile. Investors seeking steady profit conversion may find AMETEK’s disciplined margins more attractive than Xylem’s rapid but lower-margin growth.
Financial Ratios Comparison
These vital ratios act as a diagnostic tool to expose the underlying fiscal health, valuation premiums, and capital efficiency of the companies analyzed:
| Ratios | AMETEK, Inc. (AME) | Xylem Inc. (XYL) |
|---|---|---|
| ROE | 13.93% | 8.36% |
| ROIC | 11.04% | 5.78% |
| P/E | 31.97 | 31.63 |
| P/B | 4.45 | 2.64 |
| Current Ratio | 1.06 | 1.75 |
| Quick Ratio | 0.67 | 1.33 |
| D/E (Debt-to-Equity) | 0.21 | 0.20 |
| Debt-to-Assets | 14.21% | 12.88% |
| Interest Coverage | 23.82 | 22.93 |
| Asset Turnover | 0.46 | 0.52 |
| Fixed Asset Turnover | 6.56 | 7.43 |
| Payout Ratio | 19.31% | 39.33% |
| Dividend Yield | 0.60% | 1.24% |
| Fiscal Year | 2025 | 2024 |
Efficiency & Valuation Duel: The Vital Signs
Financial ratios serve as a company’s DNA, unveiling operational strengths and hidden risks critical for confident investing decisions.
AMETEK, Inc.
AMETEK shows solid profitability with a 13.93% ROE and a strong 20% net margin, indicating efficient core operations. However, its valuation appears stretched with a high P/E of 31.97 and elevated price-to-book at 4.45. The company delivers modest dividends yielding 0.6%, balancing returns with reinvestment in growth and R&D.
Xylem Inc.
Xylem posts a lower ROE of 8.36% and a 10.39% net margin, signaling less operational efficiency compared to AMETEK. Its P/E of 31.63 is similarly high, but a more reasonable price-to-book of 2.64 tempers valuation concerns. Xylem offers a 1.24% dividend yield, reflecting a more shareholder-friendly return policy alongside steady reinvestment.
Operational Efficiency vs. Valuation Stretch
AMETEK’s superior profitability contrasts with its higher valuation multiples, suggesting premium pricing for efficiency. Xylem offers a more balanced valuation with moderate profitability and stronger dividend yield. Investors prioritizing operational strength may lean toward AMETEK, while those favoring income and valuation cushioning might prefer Xylem.
Which one offers the Superior Shareholder Reward?
I observe AMETEK, Inc. (AME) yields a modest 0.62% dividend with a conservative 19% payout ratio, supported by strong free cash flow. Its buyback program is steady but less intense. Xylem Inc. (XYL) offers a higher 1.24% yield but a riskier 39% payout ratio, with lower free cash flow coverage and a heavier reliance on dividends over buybacks. Historically, sustainable shareholder rewards come from balanced dividends and aggressive buybacks. AME’s model aligns better with long-term value, making it my preferred total return choice in 2026.
Comparative Score Analysis: The Strategic Profile
The radar chart reveals the fundamental DNA and trade-offs of AMETEK, Inc. and Xylem Inc., highlighting their financial strengths and valuation challenges:
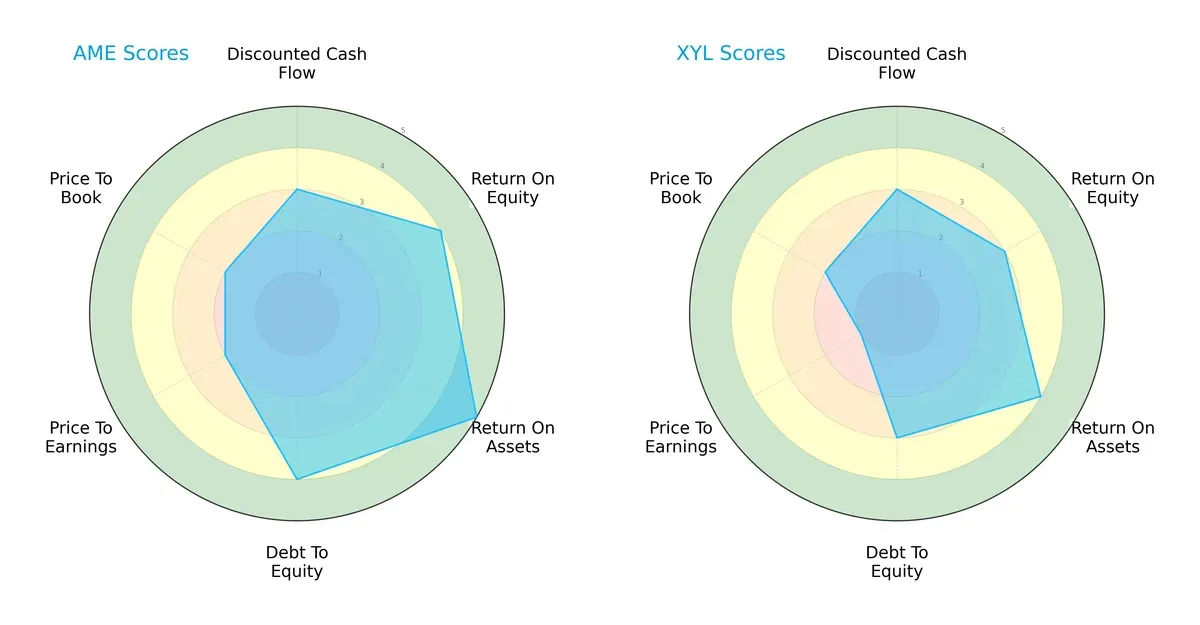
AMETEK leads with a more balanced profile, excelling in ROE (4 vs. 3), ROA (5 vs. 4), and debt management (4 vs. 3). Xylem lags in valuation metrics, scoring very low on P/E (1 vs. 2). Both share moderate DCF scores, but AMETEK’s overall rating (A-) surpasses Xylem’s (B), confirming its stronger operational efficiency and financial stability.
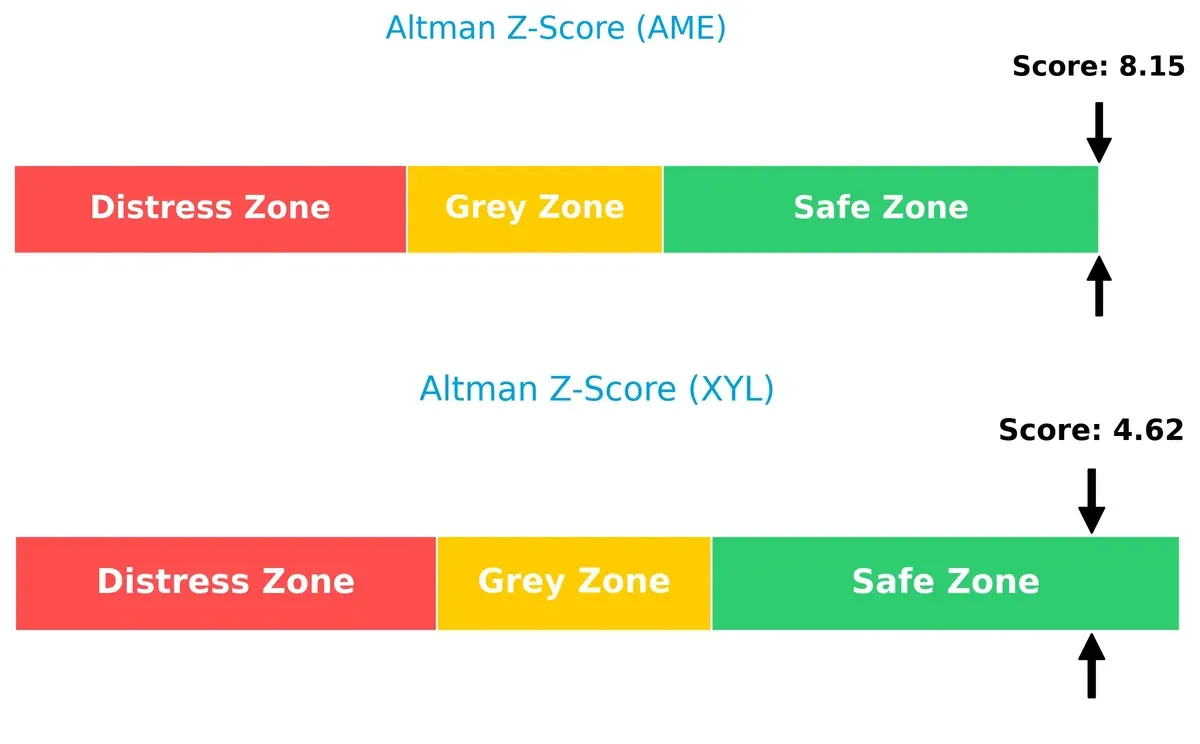
Bankruptcy Risk: Solvency Showdown
AMETEK’s Altman Z-Score of 8.15 significantly outpaces Xylem’s 4.62, placing both firms safely above distress thresholds but with AMETEK enjoying a wider margin of solvency and resilience in this economic cycle:
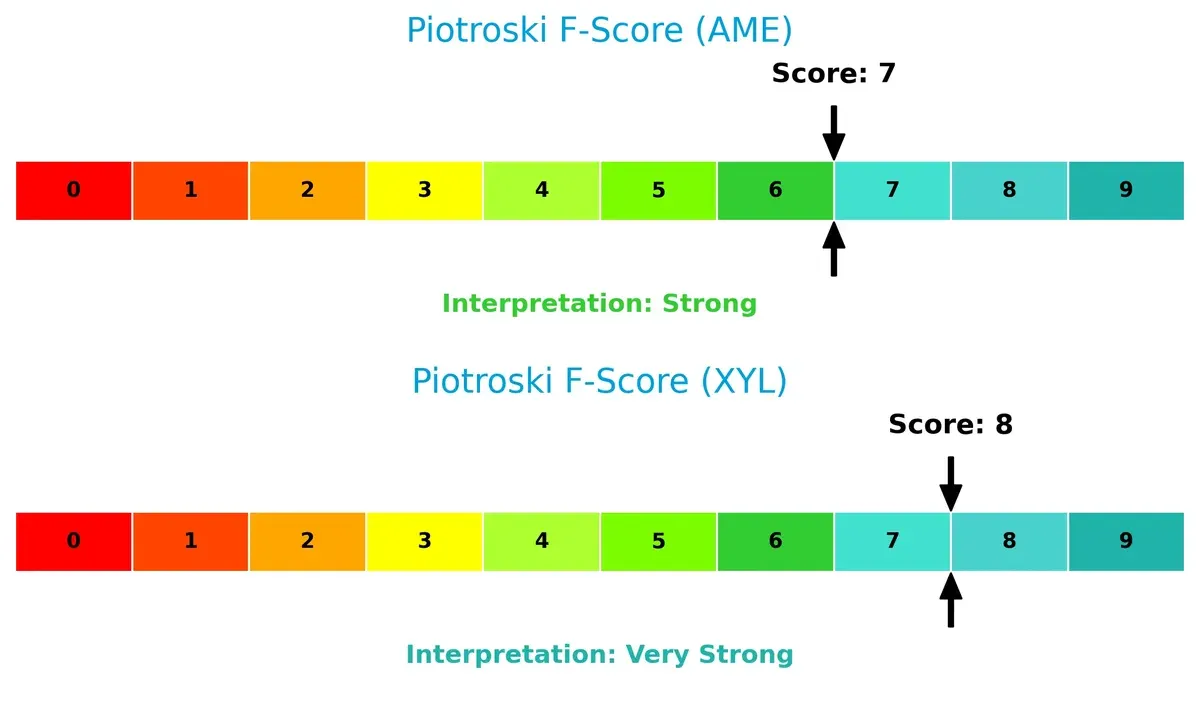
Financial Health: Quality of Operations
Xylem’s Piotroski F-Score of 8 edges AMETEK’s 7, signaling marginally stronger internal financial health and operational quality. Neither displays red flags, but Xylem’s score suggests a slight advantage in profitability and efficiency metrics:
How are the two companies positioned?
This section dissects AMETEK and Xylem’s operational DNA by comparing their revenue distribution and internal strengths and weaknesses. The objective is to confront their economic moats and identify which model offers the most resilient competitive advantage today.
Revenue Segmentation: The Strategic Mix
The following visual comparison dissects how AMETEK, Inc. and Xylem Inc. diversify their income streams and where their primary sector bets lie:
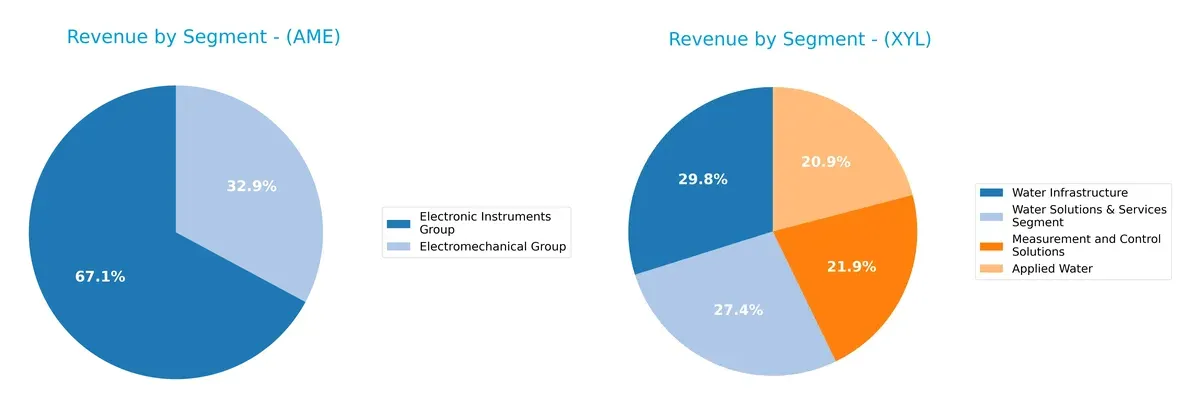
AMETEK’s revenue pivots mainly on Electronic Instruments Group at $4.66B in 2024, dwarfing its Electromechanical Group at $2.28B. This concentration anchors AMETEK’s expertise but poses concentration risk. Xylem showcases a more diversified mix with four segments, led by Water Infrastructure at $2.56B and Water Solutions & Services at $2.34B, reducing dependency on any single stream and strengthening its ecosystem lock-in in water technology.
Strengths and Weaknesses Comparison
The table compares the Strengths and Weaknesses of AMETEK, Inc. and Xylem Inc.:
AMETEK, Inc. Strengths
- Strong net margin of 20%
- Favorable ROIC at 11.04%
- Low debt-to-equity ratio of 0.21
- High interest coverage at 23.13
- Diversified revenue across Electromechanical and Electronic Instruments
- Global presence in US, UK, EU, Asia with steady growth
Xylem Inc. Strengths
- Favorable net margin at 10.39%
- Strong current and quick ratios above 1
- Low debt-to-equity at 0.20
- High interest coverage of 25.7
- Diversified water-related segments
- Significant US revenue with expanding Europe and Asia Pacific markets
AMETEK, Inc. Weaknesses
- Unfavorable PE and PB ratios indicating high valuation
- Quick ratio of 0.67 signals liquidity risk
- Asset turnover of 0.46 is low
- Dividend yield at 0.6% is weak
- ROE neutral at 13.93%
- Slightly unfavorable liquidity profile
Xylem Inc. Weaknesses
- Unfavorable ROE at 8.36%
- Neutral PB ratio of 2.64
- PE ratio elevated at 31.63
- Moderate ROIC of 5.78%
- Dividend yield neutral at 1.24%
- Neutral asset turnover of 0.52
Both companies demonstrate strengths in financial stability and segment diversification. AMETEK shows superior profitability metrics but has liquidity and valuation concerns. Xylem offers better liquidity and geographic expansion but faces challenges in returns on equity and valuation multiples. These factors shape their strategic priorities around operational efficiency and capital allocation.
The Moat Duel: Analyzing Competitive Defensibility
A structural moat is the only reliable shield protecting long-term profits from relentless competitive erosion:
AMETEK, Inc.: Precision Engineering Moat
I see AMETEK’s moat rooted in its intangible assets and advanced instrumentation expertise. Its 25.4% EBIT margin confirms stable pricing power and operational efficiency. New aerospace and industrial sensor markets in 2026 could deepen this advantage.
Xylem Inc.: Water Infrastructure Network Effects
Xylem’s moat centers on network effects in water infrastructure and smart metering solutions, contrasting AMETEK’s product specialization. Despite a lower EBIT margin (13.2%), its rapid revenue and EPS growth signal expanding competitive reach and market disruption potential.
Verdict: Engineering Excellence vs. Infrastructure Reach
AMETEK’s wider moat shines through superior ROIC exceeding WACC by 2.5% and high margin stability. Xylem grows fast but still sheds value overall. AMETEK is better positioned to defend and expand its market share long term.
Which stock offers better returns?
Over the past year, AMETEK, Inc. and Xylem Inc. exhibited distinct bullish price movements with AMETEK showing stronger acceleration and higher gains.
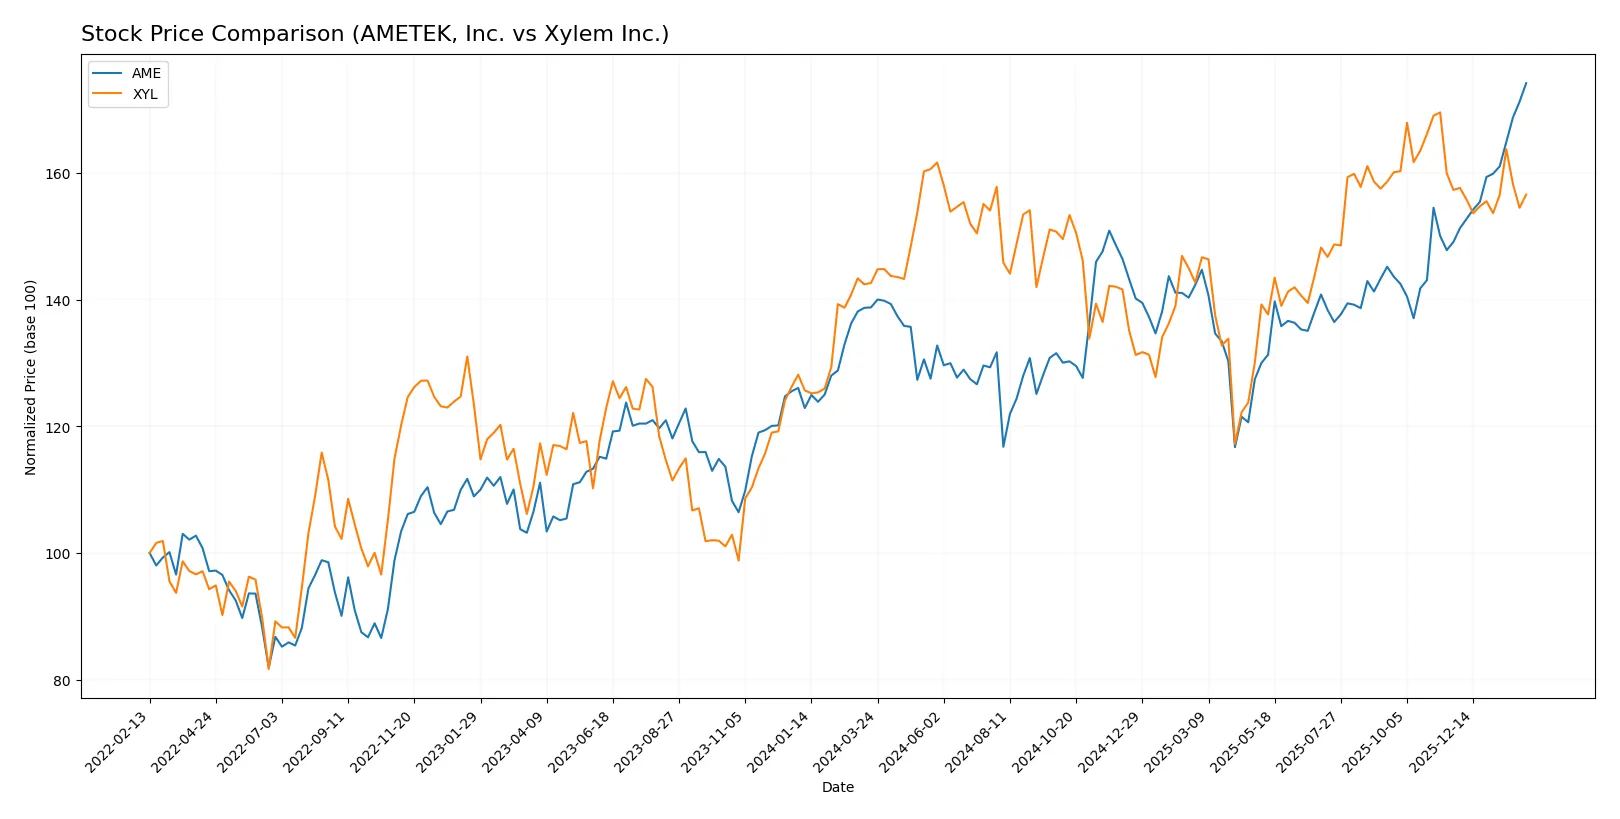
Trend Comparison
AMETEK’s stock rose 25.51% over the past 12 months, reflecting a clear bullish trend with accelerating momentum and a high volatility level at 14.42%. Its price ranged from 152.66 to 227.83.
Xylem’s stock increased 9.8% over the same period, also bullish with acceleration but lower volatility at 9.57%. Recent months show a near-neutral trend with a slight 0.46% decline.
Comparing both, AMETEK outperformed Xylem with greater total returns and stronger upward momentum over the past year.
Target Prices
Analysts present a moderately bullish target consensus for AMETEK, Inc. and Xylem Inc.
| Company | Target Low | Target High | Consensus |
|---|---|---|---|
| AMETEK, Inc. | 204 | 271 | 237.91 |
| Xylem Inc. | 150 | 178 | 169.67 |
The consensus target for AMETEK stands about 4.6% above its current price of 227.83, signaling moderate upside. Xylem’s targets imply a more significant premium of roughly 21.5% over its 139.74 price, reflecting stronger analyst optimism.

Don’t Let Luck Decide Your Entry Point
Optimize your entry points with our advanced ProRealTime indicators. You’ll get efficient buy signals with precise price targets for maximum performance. Start outperforming now!
How do institutions grade them?
This section compares recent institutional grades for AMETEK, Inc. and Xylem Inc.:
AMETEK, Inc. Grades
Below is a summary of recent grades from reputable financial institutions for AMETEK, Inc.:
| Grading Company | Action | New Grade | Date |
|---|---|---|---|
| Keybanc | maintain | Overweight | 2026-02-04 |
| DA Davidson | maintain | Buy | 2026-02-04 |
| Barclays | maintain | Equal Weight | 2026-02-04 |
| Oppenheimer | downgrade | Perform | 2026-01-27 |
| Morgan Stanley | maintain | Equal Weight | 2026-01-12 |
| Barclays | maintain | Equal Weight | 2026-01-07 |
| Keybanc | maintain | Overweight | 2026-01-07 |
| Keybanc | maintain | Overweight | 2026-01-06 |
| Mizuho | maintain | Outperform | 2026-01-05 |
| TD Cowen | upgrade | Buy | 2025-12-23 |
Xylem Inc. Grades
Below is a summary of recent grades from reputable financial institutions for Xylem Inc.:
| Grading Company | Action | New Grade | Date |
|---|---|---|---|
| Barclays | maintain | Overweight | 2026-01-07 |
| Mizuho | maintain | Neutral | 2026-01-05 |
| TD Cowen | maintain | Hold | 2025-12-05 |
| UBS | maintain | Buy | 2025-11-06 |
| Stifel | maintain | Buy | 2025-10-29 |
| Citigroup | maintain | Buy | 2025-10-29 |
| Barclays | maintain | Overweight | 2025-10-29 |
| RBC Capital | maintain | Outperform | 2025-10-29 |
| Citigroup | maintain | Buy | 2025-10-09 |
| Mizuho | maintain | Neutral | 2025-09-12 |
Which company has the best grades?
AMETEK, Inc. consistently receives strong buy or overweight ratings, with only one recent downgrade. Xylem Inc. also has predominantly positive grades but includes more neutral and hold ratings. Investors may perceive AMETEK’s grades as slightly more favorable, potentially reflecting stronger confidence from analysts.
Risks specific to each company
The following categories identify critical pressure points and systemic threats facing AMETEK, Inc. and Xylem Inc. in the 2026 market environment:
1. Market & Competition
AMETEK, Inc.
- Operates in diverse industrial segments; faces pressure from technological innovation and cyclical demand.
Xylem Inc.
- Focuses on water solutions; exposed to infrastructure spending cycles and increasing competition in smart water tech.
2. Capital Structure & Debt
AMETEK, Inc.
- Low debt-to-equity (0.21) with strong interest coverage (23.13); balance sheet risk is moderate.
Xylem Inc.
- Slightly lower leverage (0.20) and solid interest coverage (25.7); capital structure is sound and conservative.
3. Stock Volatility
AMETEK, Inc.
- Beta at 1.036 indicates moderate volatility in line with industrial sector benchmarks.
Xylem Inc.
- Higher beta of 1.163 signals greater stock price swings, reflecting sensitivity to economic cycles.
4. Regulatory & Legal
AMETEK, Inc.
- Faces standard industrial regulatory oversight; no notable legal issues reported recently.
Xylem Inc.
- Subject to environmental regulations in water treatment; compliance costs may rise with tightening policies.
5. Supply Chain & Operations
AMETEK, Inc.
- Operates a global manufacturing network; supply chain risks include raw material cost volatility.
Xylem Inc.
- Relies on extensive component sourcing for water tech; operational disruptions could impact deliveries.
6. ESG & Climate Transition
AMETEK, Inc.
- Moderate ESG risk; limited exposure to climate transition but must adapt to sustainability trends.
Xylem Inc.
- High exposure to climate solutions; ESG initiatives offer growth but require capital investments.
7. Geopolitical Exposure
AMETEK, Inc.
- Global footprint exposes it to trade tensions and tariffs, especially in aerospace and industrial markets.
Xylem Inc.
- International operations create risks from geopolitical instability, particularly in emerging markets.
Which company shows a better risk-adjusted profile?
AMETEK’s biggest risk lies in its stock valuation and operational leverage, with a high P/E and weak quick ratio signaling caution. Xylem faces its largest risk from regulatory and operational pressures amid climate transition demands. Overall, Xylem presents a better risk-adjusted profile, bolstered by stronger liquidity and ESG positioning. Recent data show AMETEK’s quick ratio at 0.67, a red flag for short-term liquidity, while Xylem’s liquidity ratios remain comfortably above 1, underscoring superior balance sheet resilience.
Final Verdict: Which stock to choose?
AMETEK, Inc. stands out with its superpower of consistent value creation, demonstrated by a very favorable moat and steadily growing ROIC above WACC. Its operational efficiency and solid income growth make it a formidable cash machine. A point of vigilance remains its moderate liquidity ratios, which could pressure short-term flexibility. AMETEK suits aggressive growth portfolios seeking durable competitive advantages.
Xylem Inc. boasts a strategic moat anchored in strong liquidity and stable debt management, appealing for investors prioritizing financial safety. While its ROIC trails below WACC, its improving profitability and robust income growth signal an emerging turnaround. Xylem fits well in GARP portfolios aiming for growth tempered by reasonable risk controls.
If you prioritize robust economic moats and superior capital efficiency, AMETEK outshines as the compelling choice due to its proven value creation and operational strength. However, if you seek safer balance sheets with improving profitability at a potentially more attractive price, Xylem offers better stability and a promising growth trajectory. Both profiles demand careful risk assessment aligned with your investment horizon.
Disclaimer: Investment carries a risk of loss of initial capital. The past performance is not a reliable indicator of future results. Be sure to understand risks before making an investment decision.
Go Further
I encourage you to read the complete analyses of AMETEK, Inc. and Xylem Inc. to enhance your investment decisions: