Home > Comparison > Industrials > AME vs ROP
The strategic rivalry between AMETEK, Inc. and Roper Technologies, Inc. shapes the industrial machinery sector’s evolution. AMETEK operates a capital-intensive model focused on electronic instruments and electromechanical devices, while Roper leverages a software-driven approach combining engineered products with cloud solutions. This head-to-head pits traditional manufacturing against technological integration. This analysis will clarify which trajectory offers superior risk-adjusted returns for a diversified portfolio in today’s competitive landscape.
Table of contents
Companies Overview
AMETEK, Inc. and Roper Technologies, Inc. stand as influential players in the industrial machinery sector, shaping market dynamics through innovation and scale.
AMETEK, Inc.: Diverse Industrial Instruments Leader
AMETEK dominates the industrial machinery space with its dual-segment business model: Electronic Instruments and Electromechanical products. Its core revenue derives from advanced instruments serving aerospace, industrial, and power markets. In 2026, the company focuses on expanding precision motion control and sensor technologies, reinforcing its broad industrial footprint and technological edge.
Roper Technologies, Inc.: Software-Driven Industrial Innovator
Roper Technologies integrates software solutions with engineered products, targeting diverse verticals like healthcare, utilities, and transportation. Its revenue engine combines cloud-based analytics with precision instruments and control systems. The firm’s 2026 strategy emphasizes scaling cloud platforms and enhancing data analytics to strengthen its competitive moat in digital industrial applications.
Strategic Collision: Similarities & Divergences
Both companies operate in industrial machinery but diverge sharply in approach: AMETEK relies on hardware-intensive precision manufacturing, while Roper leans into software-enabled solutions. Their competition centers on market share in industrial automation and control systems. This contrast creates distinct investment profiles—AMETEK offers tangible asset strength, Roper rides the growth wave of digital transformation.
Income Statement Comparison
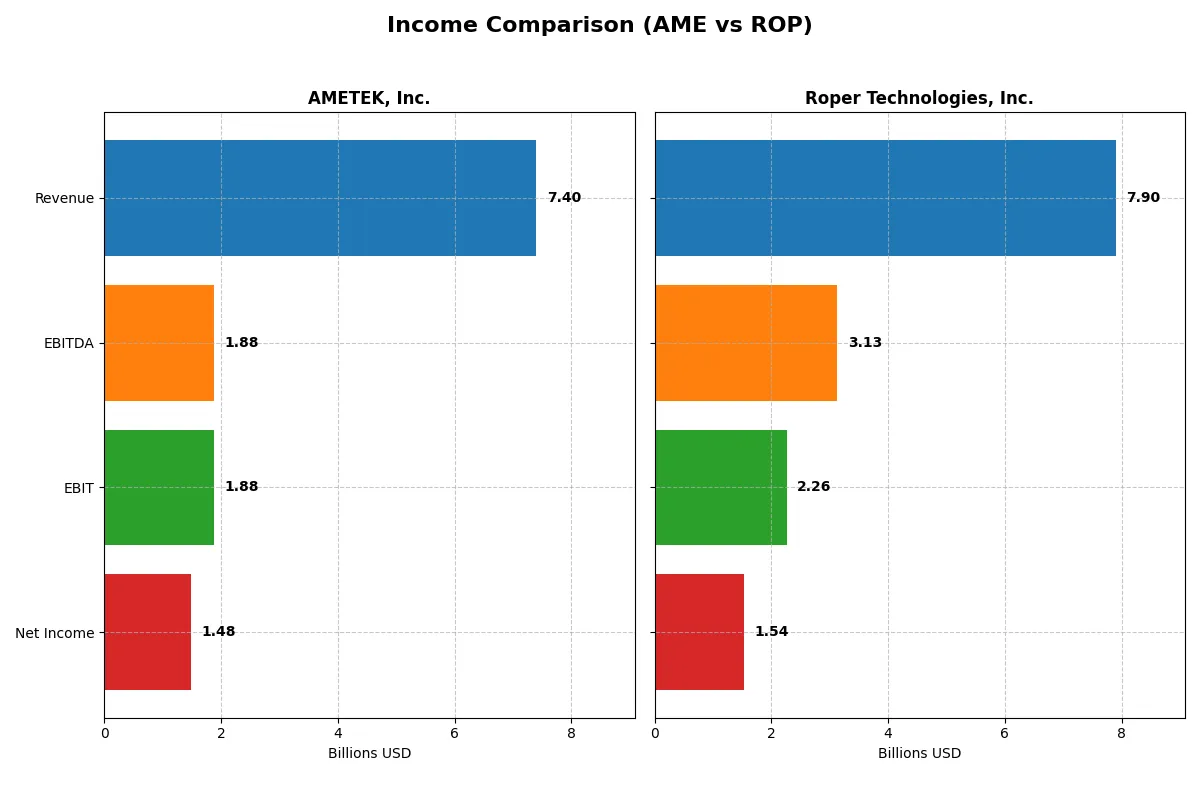
This data dissects the core profitability and scalability of both corporate engines to reveal who dominates the bottom line:
| Metric | AMETEK, Inc. (AME) | Roper Technologies, Inc. (ROP) |
|---|---|---|
| Revenue | 7.40B | 7.90B |
| Cost of Revenue | 4.71B | 2.43B |
| Operating Expenses | 757M | 3.24B |
| Gross Profit | 2.69B | 5.47B |
| EBITDA | 1.88B | 3.13B |
| EBIT | 1.88B | 2.26B |
| Interest Expense | 81M | 325M |
| Net Income | 1.48B | 1.54B |
| EPS | 6.42 | 14.31 |
| Fiscal Year | 2025 | 2025 |
Income Statement Analysis: The Bottom-Line Duel
This income statement comparison reveals which company leverages its revenue most efficiently to convert sales into profit.
AMETEK, Inc. Analysis
AMETEK’s revenue climbed steadily from 5.55B in 2021 to 7.4B in 2025, while net income surged from 990M to 1.48B. Its gross margin holds firm around 36%, and net margin improved to 20% in 2025. The firm’s expanding EBIT and EPS confirm solid operational efficiency and consistent profit momentum.
Roper Technologies, Inc. Analysis
Roper’s revenue grew more rapidly, from 4.83B in 2021 to 7.9B in 2025, with net income rising from 1.1B to 1.54B. The company boasts a commanding gross margin above 69%, and a near 19.4% net margin in 2025. Despite high revenue growth, recent net margin and EPS declined slightly, signaling margin pressure.
Margin Strength vs. Revenue Growth
AMETEK shows steady margin expansion and consistent profit growth, while Roper excels in top-line growth but endures margin compression. AMETEK’s disciplined cost control and margin improvement offer a more stable earnings profile. Investors seeking reliable profitability may find AMETEK’s model more attractive than Roper’s high-growth yet margin-challenged approach.
Financial Ratios Comparison
These vital ratios act as a diagnostic tool to expose the underlying fiscal health, valuation premiums, and capital efficiency of the companies compared below:
| Ratios | AMETEK, Inc. (AME) | Roper Technologies, Inc. (ROP) |
|---|---|---|
| ROE | 13.93% | 7.73% |
| ROIC | 11.04% | 5.62% |
| P/E | 31.97 | 31.06 |
| P/B | 4.45 | 2.40 |
| Current Ratio | 1.06 | 0.52 |
| Quick Ratio | 0.67 | 0.48 |
| D/E (Debt-to-Equity) | 0.21 | 0.47 |
| Debt-to-Assets | 14.2% | 26.9% |
| Interest Coverage | 23.82 | 6.88 |
| Asset Turnover | 0.46 | 0.23 |
| Fixed Asset Turnover | 6.56 | 50.37 |
| Payout ratio | 19.3% | 23.1% |
| Dividend yield | 0.60% | 0.74% |
| Fiscal Year | 2025 | 2025 |
Efficiency & Valuation Duel: The Vital Signs
Financial ratios serve as a company’s DNA, unveiling hidden risks and operational strengths beyond surface-level earnings.
AMETEK, Inc.
AMETEK delivers a solid 13.9% ROE and a strong 20% net margin, signaling operational efficiency. Its valuation appears stretched with a P/E near 32 and a P/B of 4.45, both unfavorable. Dividend yield is modest at 0.6%, suggesting limited cash return; reinvestment likely supports steady growth and R&D.
Roper Technologies, Inc.
Roper posts a lower 7.7% ROE and a 19.4% net margin, reflecting moderate profitability. The P/E ratio of 31 is also stretched, though P/B at 2.4 is more reasonable. Dividend yield of 0.74% remains low, indicating a balanced approach between shareholder payouts and reinvestment for innovation.
Valuation Stretch vs. Operational Strength
Both companies trade at high multiples, but AMETEK edges ahead with superior returns on equity and invested capital. Roper’s weaker profitability and lower asset turnover raise caution. Investors prioritizing operational resilience may prefer AMETEK, while those seeking modest dividends and growth balance might consider Roper’s profile.
Which one offers the Superior Shareholder Reward?
I compare AMETEK, Inc. (AME) and Roper Technologies, Inc. (ROP) on dividends, payout ratios, and buybacks as shareholder rewards. AME yields ~0.62% with a conservative 19% payout, showing strong free cash flow coverage. ROP offers a higher yield near 0.74%, but with a 23% payout ratio and heavier debt. ROP’s buybacks are aggressive, boosting returns, while AME’s buybacks are more restrained but sustainable given solid cash flow and leverage. ROP’s model risks leverage stress despite higher yield. AME’s balanced distribution and superior cash flow coverage provide a more reliable long-term total return. I favor AMETEK for sustainable shareholder reward in 2026.
Comparative Score Analysis: The Strategic Profile
The radar chart reveals the fundamental DNA and trade-offs of AMETEK, Inc. and Roper Technologies, Inc., highlighting their financial strengths and valuation contrasts:
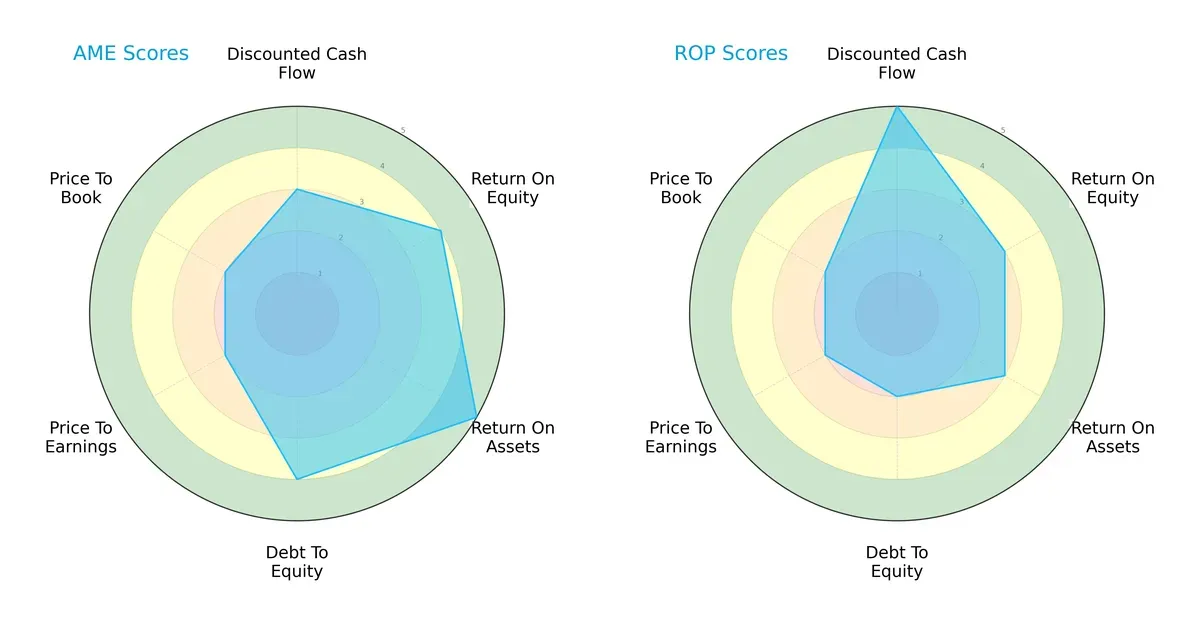
AMETEK delivers a balanced profile with strong ROE (4) and ROA (5) scores, alongside a solid debt-to-equity (4), signaling efficient asset use and prudent leverage. Roper excels in discounted cash flow (5), indicating robust future cash generation, but shows weaker operational returns (ROE 3, ROA 3) and higher financial risk (debt-to-equity 2). AMETEK’s broader strengths suggest steadier fundamentals, while Roper relies heavily on cash flow advantages.
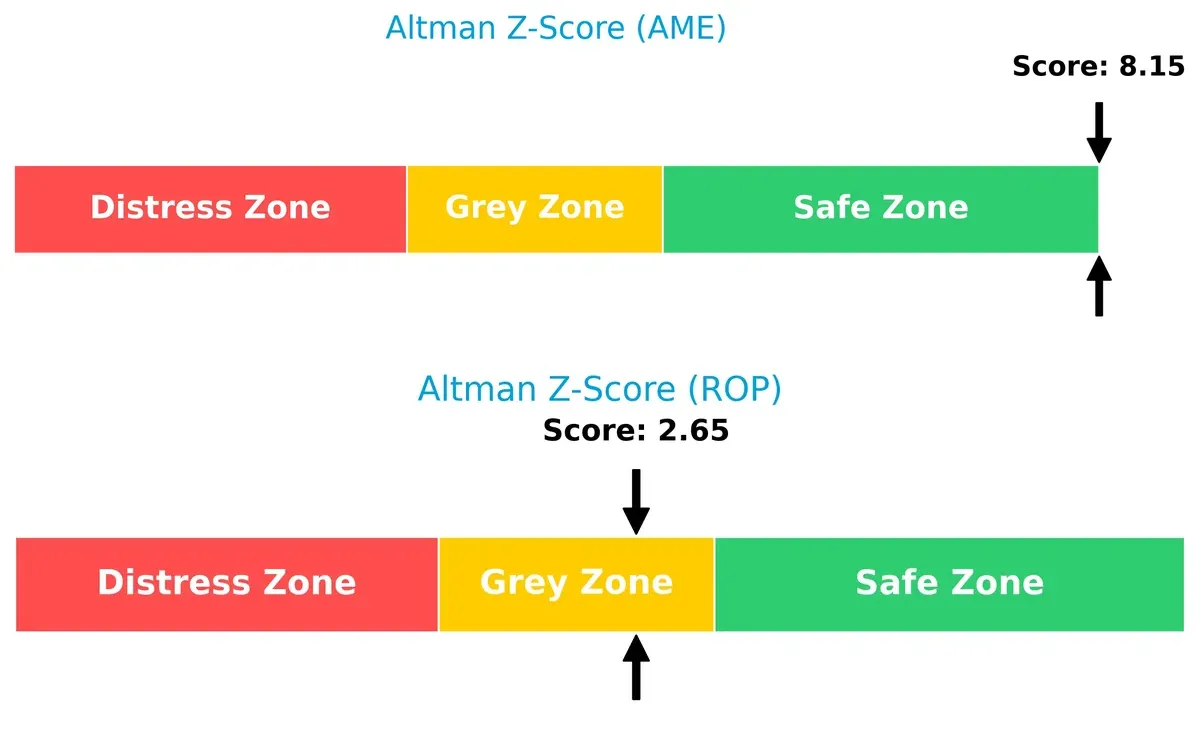
Bankruptcy Risk: Solvency Showdown
AMETEK’s Altman Z-Score of 8.15 places it comfortably in the safe zone, whereas Roper’s 2.65 falls into the grey zone, indicating moderate bankruptcy risk amid economic fluctuations:
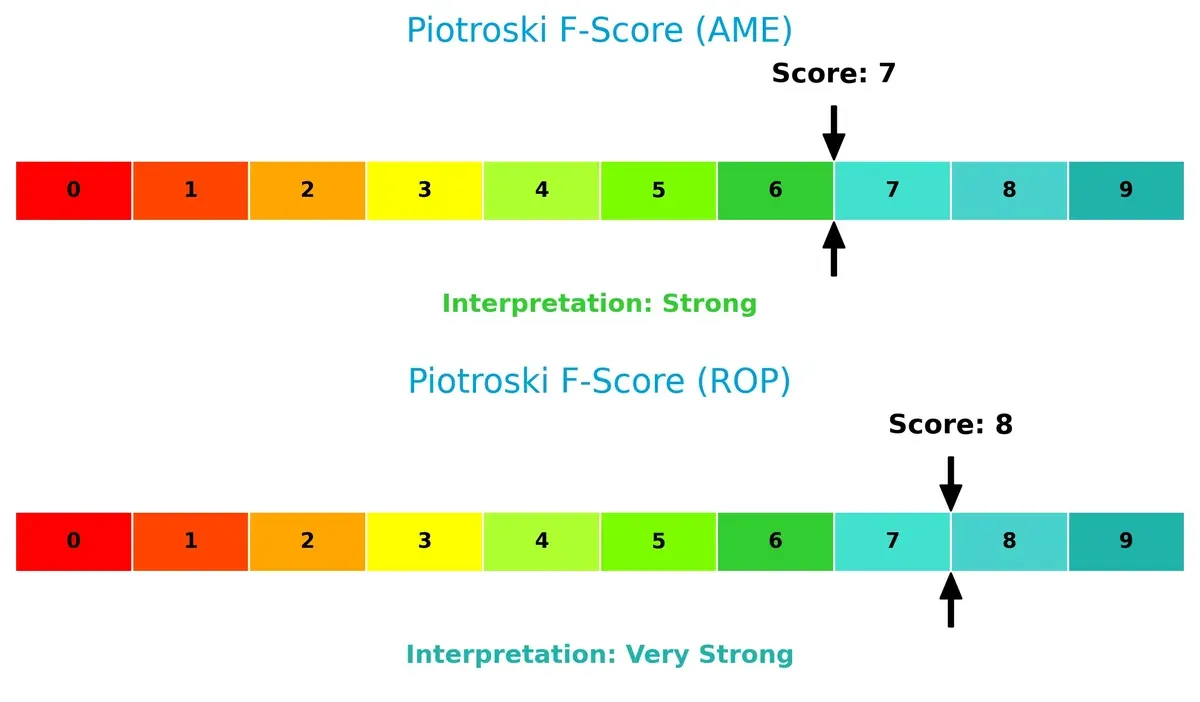
Financial Health: Quality of Operations
Roper edges ahead with a Piotroski F-Score of 8, reflecting very strong financial health, marginally outperforming AMETEK’s strong score of 7. This suggests Roper’s internal metrics are slightly more robust, though AMETEK remains financially sound:
How are the two companies positioned?
This section dissects AMETEK and Roper’s operational DNA by comparing revenue distribution and internal dynamics. The goal is to confront their economic moats to reveal which model offers the most resilient competitive advantage today.
Revenue Segmentation: The Strategic Mix
This visual comparison dissects how AMETEK, Inc. and Roper Technologies, Inc. diversify their income streams and where their primary sector bets lie:
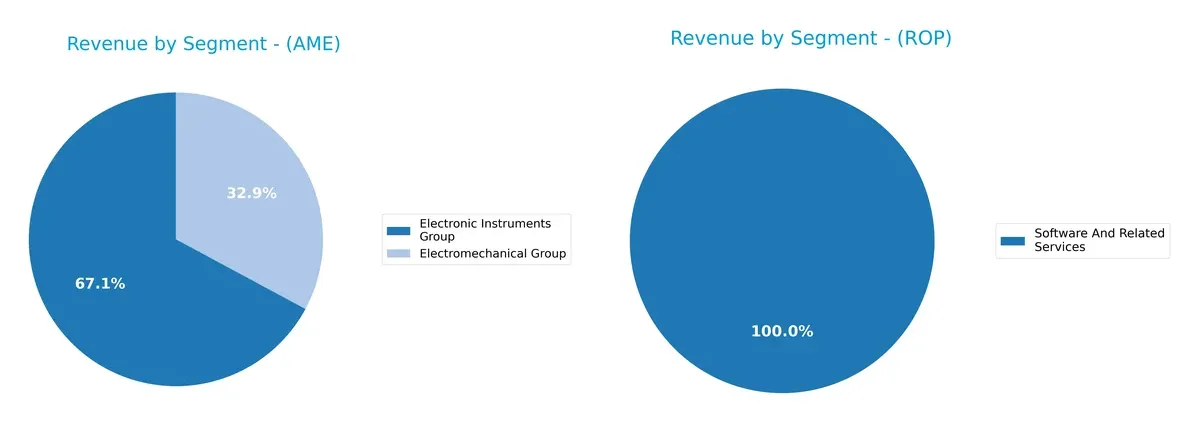
AMETEK anchors revenue in two segments: Electronic Instruments Group at $4.66B and Electromechanical Group at $2.28B, showing a balanced yet focused portfolio. Roper pivots on a dominant Software and Related Services segment at $10.74B, highlighting concentration risk but strong ecosystem lock-in. AMETEK’s dual-segment approach cushions volatility, while Roper’s software reliance hints at infrastructure dominance but less diversification.
Strengths and Weaknesses Comparison
This table compares the Strengths and Weaknesses of AMETEK, Inc. and Roper Technologies, Inc.:
AMETEK, Inc. Strengths
- Favorable net margin at 20%
- Strong ROIC of 11.04% above WACC
- Low debt-to-assets ratio at 14.21%
- High fixed asset turnover at 6.56
- Diverse revenue streams from Electromechanical and Electronic Instruments groups
- Significant global sales including US, Europe, and Asia
Roper Technologies, Inc. Strengths
- Favorable net margin near 19.44%
- Strong interest coverage at 6.96
- Favorable WACC at 7.27% below ROIC
- Very high fixed asset turnover at 50.37
- Large revenue from Software and Related Services segment
- Solid global presence, primarily US with growing non-US markets
AMETEK, Inc. Weaknesses
- Unfavorable PE at 31.97 and PB at 4.45 indicating high valuation
- Low quick ratio at 0.67 suggesting liquidity concerns
- Asset turnover at 0.46 below ideal levels
- Low dividend yield at 0.6%
- Neutral ROE at 13.93%
- Significant unfavorable ratios at 35.71%
Roper Technologies, Inc. Weaknesses
- Unfavorable ROE at 7.73%
- Low current and quick ratios at 0.52 and 0.48 respectively
- Elevated debt-to-assets at 26.9% though still favorable
- Unfavorable PE at 31.06
- Dividend yield low at 0.74%
- Asset turnover weak at 0.23
Both companies demonstrate strong profitability and asset efficiency in key areas, but each faces liquidity and valuation challenges. AMETEK shows broader diversification across product groups and regions, while Roper relies heavily on its software segment and US market dominance. These factors shape their strategic focuses and risk profiles.
The Moat Duel: Analyzing Competitive Defensibility
A structural moat is the only reliable shield protecting long-term profits from relentless competitive pressure and market erosion:
AMETEK, Inc.: Precision Engineering with Durable Cost Advantage
AMETEK’s moat rests on cost advantages in highly specialized electromechanical products. Its financials reveal a very favorable ROIC exceeding WACC by 2.5%, indicating strong value creation. In 2026, expanding aerospace and industrial markets could deepen this moat.
Roper Technologies, Inc.: Software-Driven Network Effects
Roper leverages network effects through diverse, cloud-based software solutions contrasting with AMETEK’s hardware focus. Despite growing ROIC, it still sheds value overall, reflecting margin pressure. Opportunities lie in scaling software platforms and cross-industry expansion in 2026.
Cost Efficiency vs. Network Expansion: The Moat Face-Off
AMETEK holds a deeper, more sustainable moat with consistent value creation and margin stability. Roper’s rising ROIC signals promise, but its overall value destruction weakens its competitive defense. AMETEK stands better positioned to protect and grow market share.
Which stock offers better returns?
Over the past 12 months, AMETEK, Inc. recorded a strong upward price movement, while Roper Technologies, Inc. faced a pronounced decline, reflecting contrasting trading dynamics.
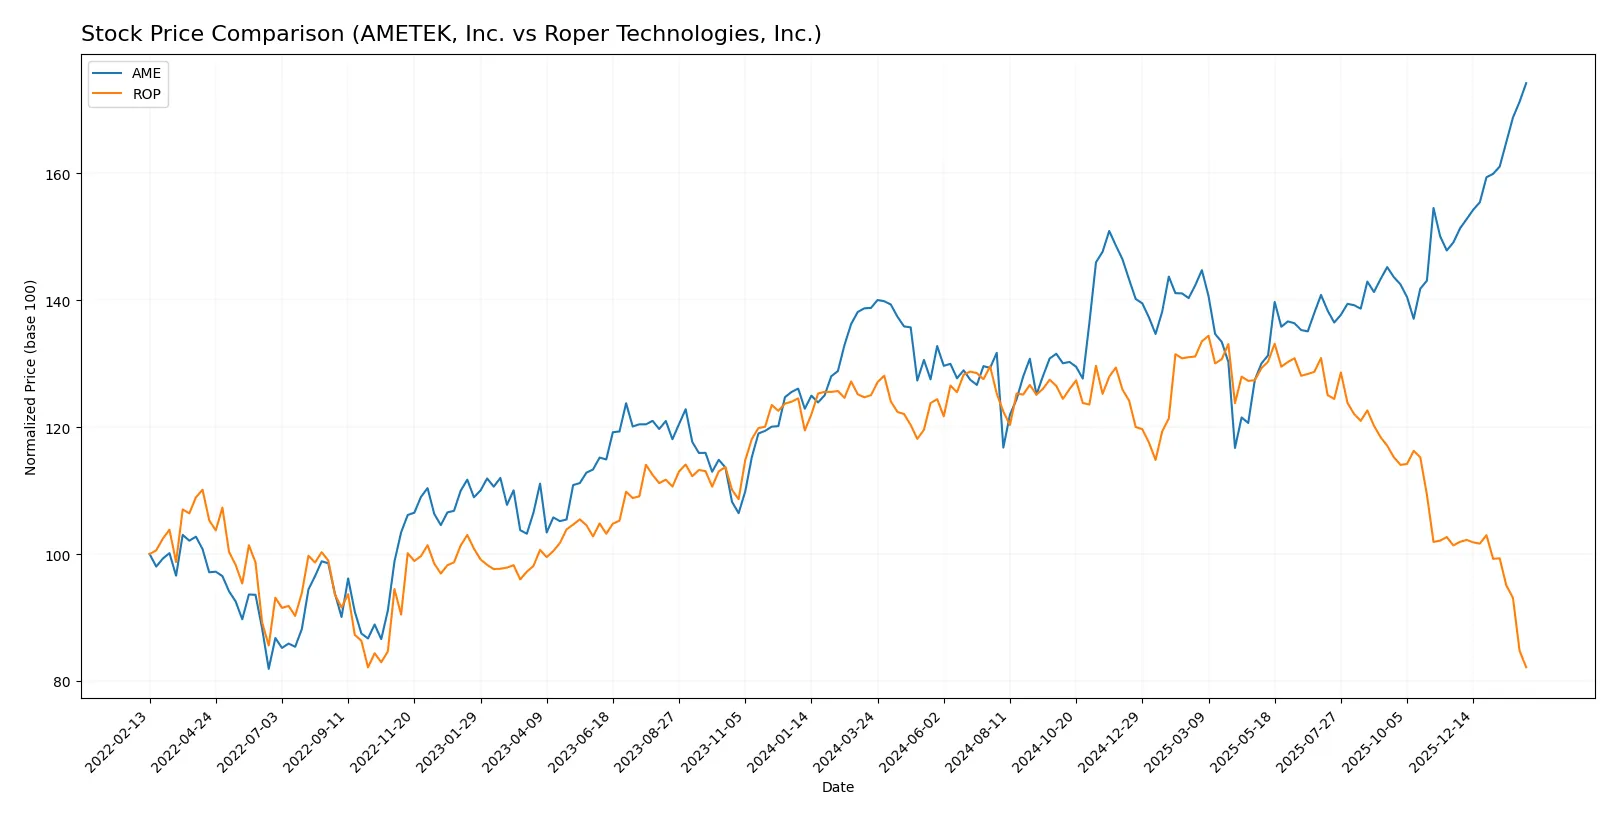
Trend Comparison
AMETEK, Inc. shows a bullish 25.51% price increase over the past year with accelerating momentum and a high of 227.83, indicating strong upward trend confidence. Roper Technologies, Inc. exhibits a bearish trend with a 34.28% price decline, decelerating momentum, and a volatile range between 359.71 and 588.38. Comparing both, AMETEK outperformed Roper significantly, delivering the highest market return with positive acceleration and buyer dominance.
Target Prices
Analysts present a bullish consensus for AMETEK, Inc. and Roper Technologies, Inc., reflecting growth expectations above current prices.
| Company | Target Low | Target High | Consensus |
|---|---|---|---|
| AMETEK, Inc. | 204 | 271 | 237.91 |
| Roper Technologies, Inc. | 365 | 575 | 475.5 |
For AMETEK, the consensus target of $238 exceeds the current price of $227.83, implying moderate upside. Roper’s target consensus at $475.5 significantly surpasses its $359.71 trading price, signaling strong analyst confidence.

Don’t Let Luck Decide Your Entry Point
Optimize your entry points with our advanced ProRealTime indicators. You’ll get efficient buy signals with precise price targets for maximum performance. Start outperforming now!
How do institutions grade them?
Here is a summary of recent institutional grades for AMETEK, Inc. and Roper Technologies, Inc.:
AMETEK, Inc. Grades
This table presents the latest grades and actions from key grading companies on AMETEK, Inc.:
| Grading Company | Action | New Grade | Date |
|---|---|---|---|
| Keybanc | Maintain | Overweight | 2026-02-04 |
| DA Davidson | Maintain | Buy | 2026-02-04 |
| Barclays | Maintain | Equal Weight | 2026-02-04 |
| Oppenheimer | Downgrade | Perform | 2026-01-27 |
| Morgan Stanley | Maintain | Equal Weight | 2026-01-12 |
| Barclays | Maintain | Equal Weight | 2026-01-07 |
| Keybanc | Maintain | Overweight | 2026-01-07 |
| Keybanc | Maintain | Overweight | 2026-01-06 |
| Mizuho | Maintain | Outperform | 2026-01-05 |
| TD Cowen | Upgrade | Buy | 2025-12-23 |
Roper Technologies, Inc. Grades
This table shows recent grading actions for Roper Technologies, Inc. by several institutions:
| Grading Company | Action | New Grade | Date |
|---|---|---|---|
| Goldman Sachs | Maintain | Neutral | 2026-01-29 |
| Argus Research | Downgrade | Hold | 2026-01-28 |
| Mizuho | Maintain | Underperform | 2026-01-28 |
| RBC Capital | Maintain | Sector Perform | 2026-01-28 |
| Stifel | Downgrade | Hold | 2026-01-28 |
| Citigroup | Maintain | Buy | 2026-01-28 |
| JP Morgan | Maintain | Underweight | 2026-01-28 |
| Truist Securities | Maintain | Buy | 2026-01-28 |
| Barclays | Maintain | Underweight | 2026-01-28 |
| Oppenheimer | Downgrade | Perform | 2026-01-28 |
Which company has the best grades?
AMETEK, Inc. generally holds stronger ratings with multiple “Buy” and “Overweight” grades. Roper Technologies, Inc. faces several downgrades and more cautious ratings like “Hold” and “Underperform.” Investors might view AMETEK’s grades as comparatively more favorable for growth prospects.
Risks specific to each company
The following categories identify the critical pressure points and systemic threats facing both firms in the 2026 market environment:
1. Market & Competition
AMETEK, Inc.
- Faces pressure from industrial machinery peers with moderate net margin and strong ROIC, but high valuation multiples.
Roper Technologies, Inc.
- Competes in software and engineered products with slightly lower margins and ROIC, but more diversified segments.
2. Capital Structure & Debt
AMETEK, Inc.
- Maintains conservative leverage with debt/equity at 0.21 and strong interest coverage at 23.13x.
Roper Technologies, Inc.
- Higher leverage with debt/equity at 0.47 and lower interest coverage at 6.96x, increasing financial risk.
3. Stock Volatility
AMETEK, Inc.
- Beta near 1.04 indicates market-level volatility; trading range is relatively stable.
Roper Technologies, Inc.
- Lower beta at 0.93 suggests less volatility, but recent price surge increases short-term risk.
4. Regulatory & Legal
AMETEK, Inc.
- Industrial sector faces standard regulatory compliance; no major legal concerns disclosed.
Roper Technologies, Inc.
- Software and healthcare segments face evolving regulations; data privacy risks present persistent challenges.
5. Supply Chain & Operations
AMETEK, Inc.
- Complex manufacturing and aerospace supply chains vulnerable to raw material price swings and geopolitical disruptions.
Roper Technologies, Inc.
- Relies on cloud infrastructure and specialized manufacturing; operational risks stem from tech integration and service continuity.
6. ESG & Climate Transition
AMETEK, Inc.
- Industrial footprint requires significant ESG investments; moderate progress in energy efficiency and emissions.
Roper Technologies, Inc.
- Focused on software solutions with lower direct emissions but faces pressure on data center energy use and sustainability.
7. Geopolitical Exposure
AMETEK, Inc.
- Exposure to global aerospace and industrial markets; sensitive to trade tensions and tariffs.
Roper Technologies, Inc.
- Global software and industrial services face risks from international regulatory divergence and supply chain uncertainties.
Which company shows a better risk-adjusted profile?
AMETEK’s strongest risk is its high valuation multiples combined with moderate liquidity ratios. Roper’s most impactful risk lies in its higher leverage and weaker liquidity, increasing financial vulnerability. Despite this, AMETEK’s consistent interest coverage and safer Altman Z-Score provide a more favorable risk-adjusted profile. Notably, Roper’s Altman Z-Score in the grey zone signals heightened bankruptcy risk compared to AMETEK’s safe zone standing.
Final Verdict: Which stock to choose?
AMETEK, Inc. (AME) stands out with its superpower of consistently creating value through a strong and growing return on invested capital. Its efficient capital allocation and robust profitability underpin a durable competitive edge. A point of vigilance remains its moderate liquidity, suggesting cautious monitoring. AME suits investors seeking aggressive growth with quality fundamentals.
Roper Technologies, Inc. (ROP) leverages a strategic moat rooted in high income quality and recurring revenue streams. Despite weaker returns on equity and a more leveraged balance sheet, it offers a defensive cushion relative to AME’s agility. ROP fits well within a GARP (Growth at a Reasonable Price) portfolio aiming for stable income growth with moderate risk tolerance.
If you prioritize sustainable economic value creation and operational efficiency, AMETEK presents the more compelling choice due to its very favorable moat and improving profitability. However, if you seek steady cash flow with a resilient business model despite financial leverage, Roper offers better stability and income predictability. Both cases require monitoring liquidity and valuation risks amid market volatility.
Disclaimer: Investment carries a risk of loss of initial capital. The past performance is not a reliable indicator of future results. Be sure to understand risks before making an investment decision.
Go Further
I encourage you to read the complete analyses of AMETEK, Inc. and Roper Technologies, Inc. to enhance your investment decisions: