Home > Comparison > Industrials > AME vs ROK
The strategic rivalry between AMETEK, Inc. and Rockwell Automation, Inc. shapes the industrial machinery landscape. AMETEK operates as a diversified manufacturer of electronic instruments and electromechanical devices, while Rockwell Automation focuses on advanced industrial automation and digital transformation solutions. This head-to-head highlights a contrast between broad industrial manufacturing and specialized technology-driven services. This analysis will clarify which company offers the superior risk-adjusted trajectory for a balanced portfolio.
Table of contents
Companies Overview
AMETEK and Rockwell Automation anchor the industrial machinery landscape with distinct operational strengths and market focuses.
AMETEK, Inc.: Precision Instruments and Electromechanical Solutions
AMETEK stands as a leader in electronic instruments and electromechanical devices. Its revenue derives from two core segments: Electronic Instruments, serving aerospace, power, and industrial markets, and Electromechanical, offering precision motion control and electrical connectors. In 2026, AMETEK emphasizes expanding its instrumentation in aerospace and industrial automation, leveraging its broad product portfolio to deepen market penetration.
Rockwell Automation, Inc.: Industrial Automation and Digital Transformation
Rockwell Automation commands a dominant position in industrial automation with solutions spanning hardware, software, and lifecycle services. Its revenue engine centers on Intelligent Devices, Software & Control, and Lifecycle Services, targeting discrete, hybrid, and process industries. The company’s 2026 strategy focuses on accelerating digital transformation, integrating software-driven solutions to enhance operational efficiency across manufacturing ecosystems.
Strategic Collision: Similarities & Divergences
Both companies excel in industrial machinery but diverge strategically: AMETEK emphasizes hardware innovation across diverse instruments, while Rockwell prioritizes software and digital services. Their primary battleground lies in industrial automation where hardware meets digital integration. Investors face contrasting profiles—AMETEK offers diversified industrial precision, whereas Rockwell delivers cutting-edge digital transformation exposure.
Income Statement Comparison
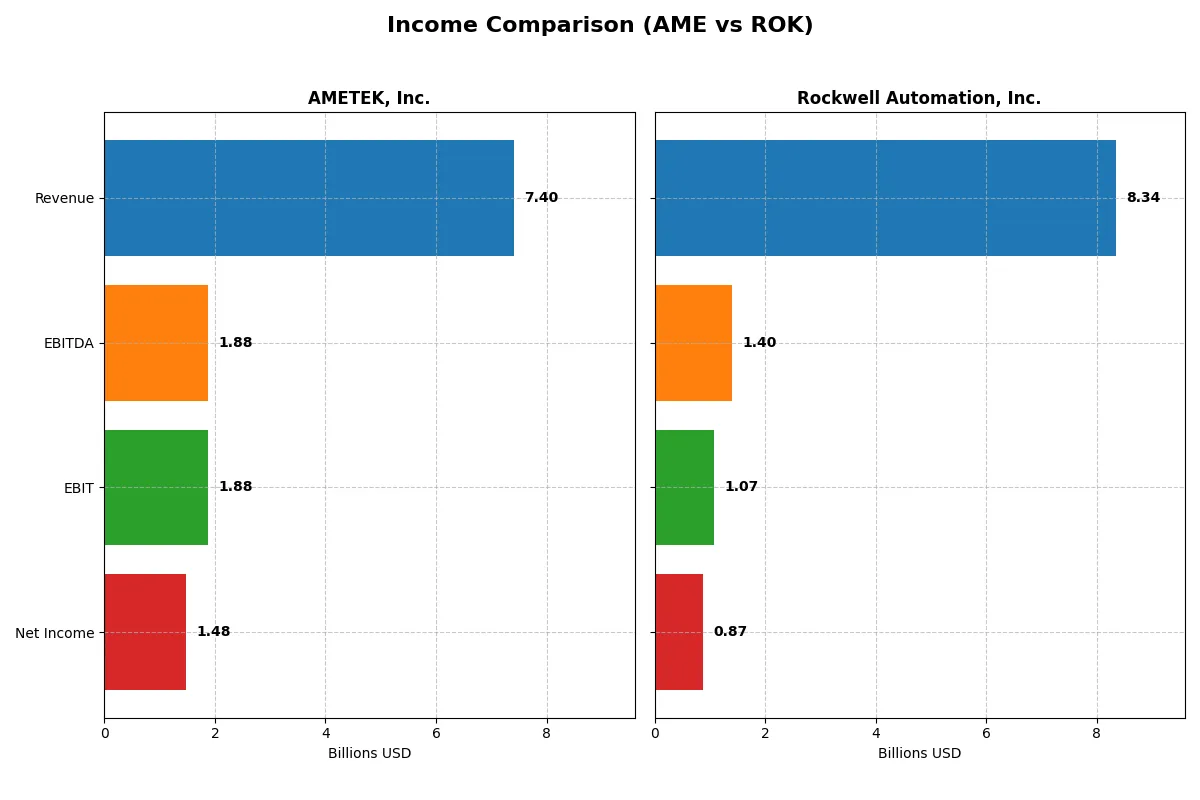
The following data dissects the core profitability and scalability of both corporate engines to reveal who dominates the bottom line:
| Metric | AMETEK, Inc. (AME) | Rockwell Automation, Inc. (ROK) |
|---|---|---|
| Revenue | 7.4B | 8.3B |
| Cost of Revenue | 4.7B | 4.3B |
| Operating Expenses | 757M | 2.6B |
| Gross Profit | 2.7B | 4.0B |
| EBITDA | 1.9B | 1.4B |
| EBIT | 1.9B | 1.1B |
| Interest Expense | 81M | 156M |
| Net Income | 1.5B | 869M |
| EPS | 6.42 | 7.69 |
| Fiscal Year | 2025 | 2025 |
Income Statement Analysis: The Bottom-Line Duel
This income statement comparison reveals which company operates its business with greater financial efficiency and profit sustainability.
AMETEK, Inc. Analysis
AMETEK’s revenue rose steadily from 5.5B in 2021 to 7.4B in 2025, with net income climbing from 990M to 1.48B. Its gross margin holds firm at 36.4%, while net margin stands at a strong 20%. The 2025 results highlight efficient cost control, supporting solid EBIT and EPS growth momentum.
Rockwell Automation, Inc. Analysis
Rockwell Automation’s revenue grew more modestly, from 7.0B in 2021 to 8.3B in 2025. Net income, however, declined from 1.36B to 867M, reflecting margin pressure. Despite a robust gross margin near 48%, the net margin fell to 10.4%. The latest year shows weakening EBIT and EPS, signaling deteriorating profitability.
Margin Strength vs. Earnings Consistency
AMETEK outperforms Rockwell Automation with superior net income growth and margin expansion over five years. Rockwell’s higher gross margin fails to translate into bottom-line strength due to rising expenses and declining net income. Investors seeking consistent profit growth and margin resilience may find AMETEK’s profile more attractive.
Financial Ratios Comparison
These vital ratios act as a diagnostic tool to expose the underlying fiscal health, valuation premiums, and capital efficiency of the companies compared below:
| Ratios | AMETEK, Inc. (AME) | Rockwell Automation, Inc. (ROK) |
|---|---|---|
| ROE | 13.93% | 23.78% |
| ROIC | 11.04% | 13.71% |
| P/E | 31.97 | 45.33 |
| P/B | 4.45 | 10.78 |
| Current Ratio | 1.06 | 1.14 |
| Quick Ratio | 0.67 | 0.77 |
| D/E (Debt to Equity) | 0.21 | 1.00 |
| Debt-to-Assets | 14.21% | 32.51% |
| Interest Coverage | 23.82 | 9.12 |
| Asset Turnover | 0.46 | 0.74 |
| Fixed Asset Turnover | 6.56 | 6.95 |
| Payout Ratio | 19.31% | 68.01% |
| Dividend Yield | 0.60% | 1.50% |
| Fiscal Year | 2025 | 2025 |
Efficiency & Valuation Duel: The Vital Signs
Ratios act as the company’s DNA, revealing hidden risks and operational excellence that define its investment appeal and financial health.
AMETEK, Inc.
AMETEK posts a solid 13.9% ROE and a strong 20% net margin, showing decent profitability. Its valuation looks stretched with a high 32 P/E and 4.45 P/B ratios. The 0.6% dividend yield is modest, reflecting a cautious shareholder return strategy favoring moderate payouts amid stable capital allocation.
Rockwell Automation, Inc.
Rockwell Automation boasts a robust 23.8% ROE and a respectable 10.4% net margin, underscoring efficient capital use. However, its valuation is expensive, with a 45.3 P/E and 10.8 P/B, signaling market optimism. A 1.5% dividend yield complements its balanced approach between rewarding shareholders and investing in growth.
Valuation Tension Meets Profitability Strength
AMETEK offers a more balanced risk profile with favorable leverage and margin metrics but trades at a premium P/E. Rockwell shows superior ROE and dividend yield but at a notably higher valuation and leverage. Growth-focused investors may prefer Rockwell’s aggressive returns, while risk-conscious ones might lean toward AMETEK’s steadier fundamentals.
Which one offers the Superior Shareholder Reward?
I compare AMETEK, Inc. (AME) and Rockwell Automation, Inc. (ROK) on dividend yield, payout ratios, and share buybacks as key total return drivers. AME yields ~0.62% with a conservative payout ratio near 19%. It supports dividends with strong free cash flow, reflecting a sustainable model. ROK offers a higher yield around 1.5% but carries a steep payout ratio above 60%, signaling riskier distribution coverage. Both companies engage in buybacks, but AME’s disciplined capital allocation and lower leverage underpin steadier shareholder returns. I find AMETEK’s balanced dividend and buyback approach delivers more sustainable, superior long-term value in 2026.
Comparative Score Analysis: The Strategic Profile
The radar chart reveals the fundamental DNA and trade-offs of AMETEK, Inc. and Rockwell Automation, Inc., highlighting their strategic strengths and vulnerabilities:
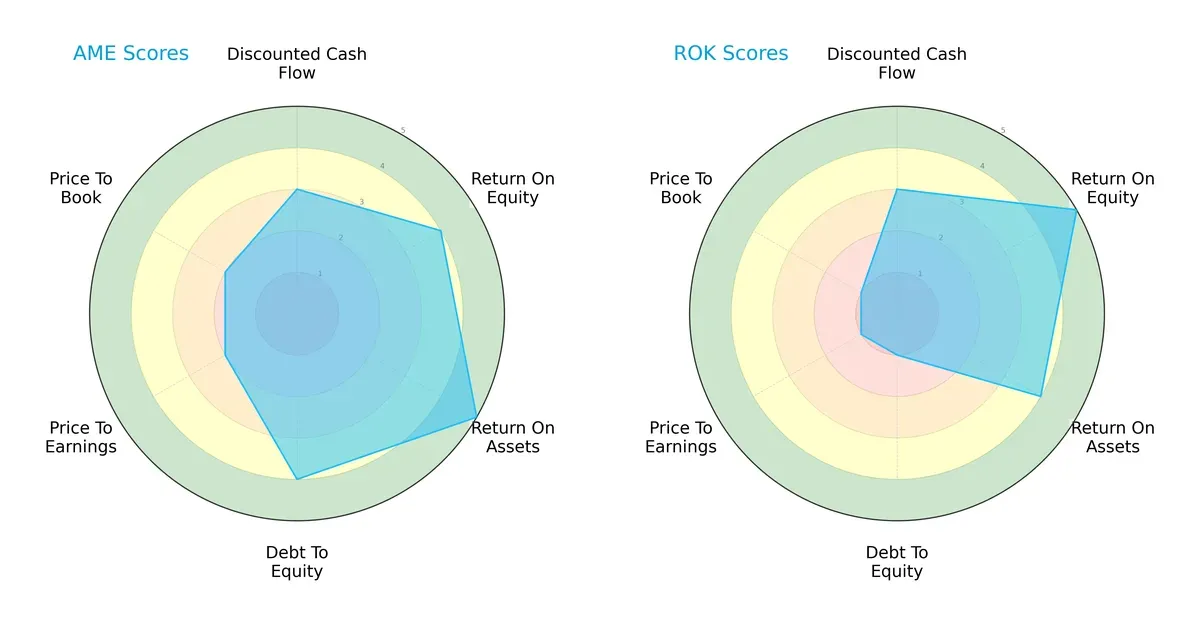
AMETEK shows a balanced profile with strong ROA (5) and solid debt management (4). Rockwell excels in ROE (5) but suffers a weak debt-to-equity score (1), indicating higher leverage risk. AMETEK’s valuation scores (PE/PB at 2) moderately outperform Rockwell’s very unfavorable valuation metrics (1), suggesting AMETEK offers a more stable investment foundation.
Bankruptcy Risk: Solvency Showdown
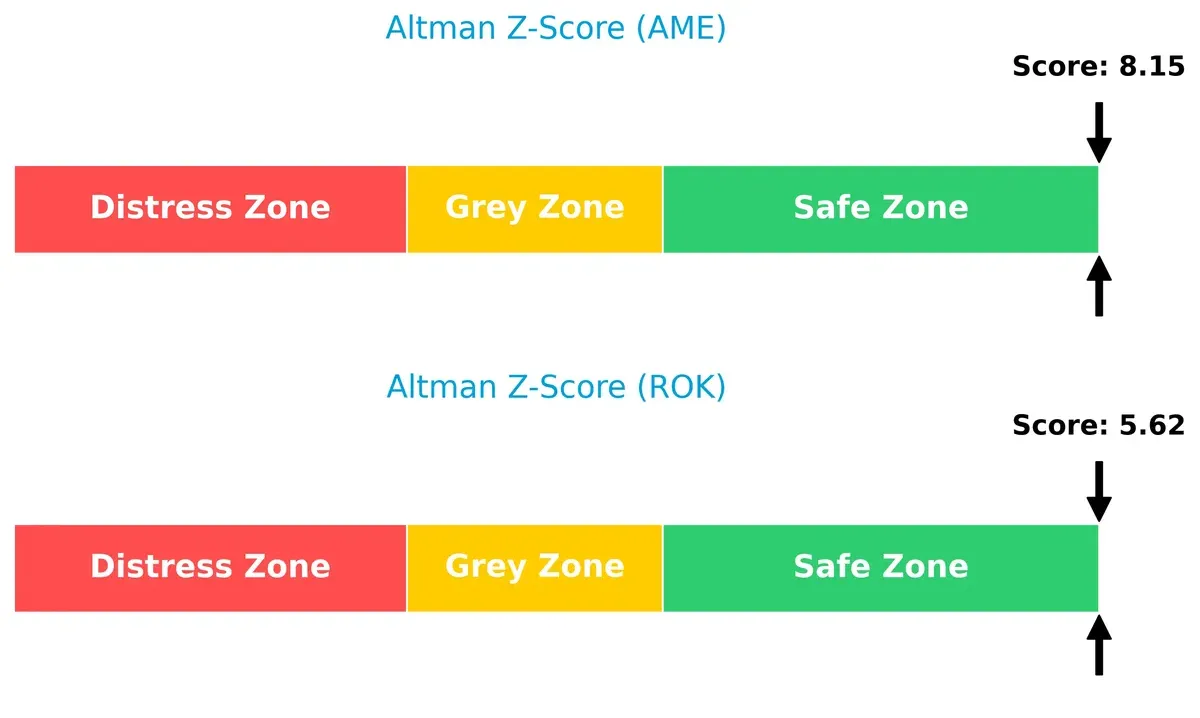
AMETEK’s Altman Z-Score of 8.15 vastly exceeds Rockwell’s 5.62, confirming both firms’ safety but highlighting AMETEK’s superior resilience against bankruptcy risk in this economic cycle:
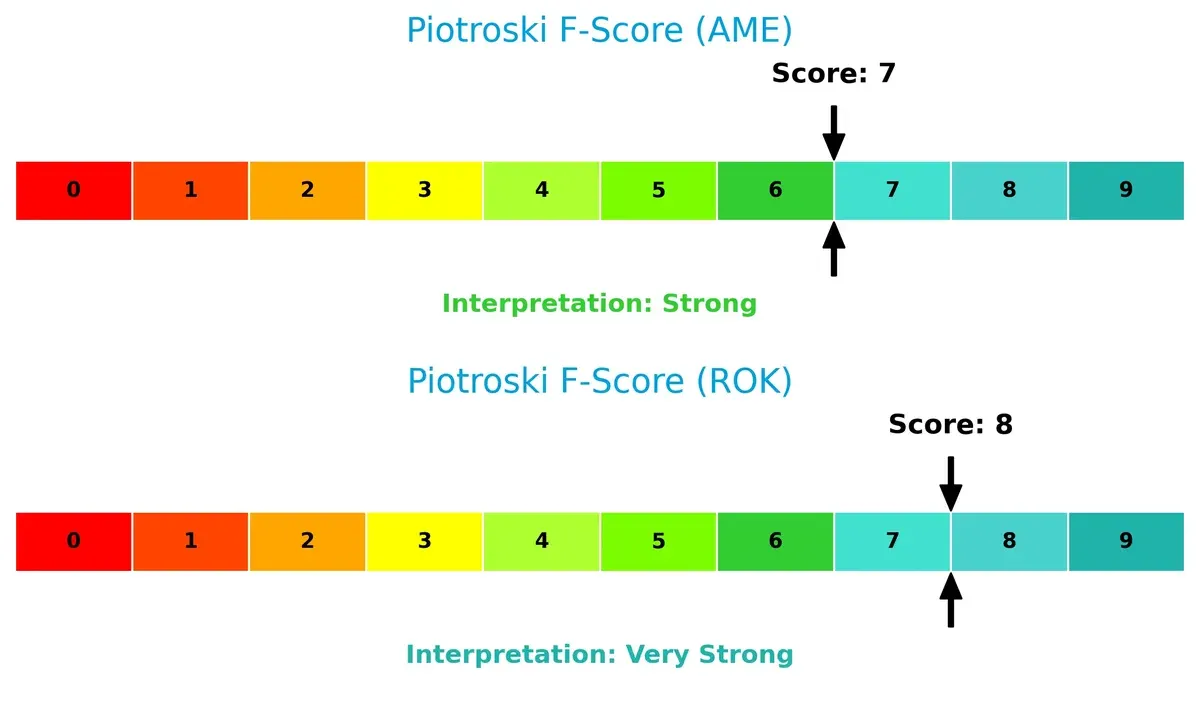
Financial Health: Quality of Operations
Rockwell edges AMETEK with a Piotroski F-Score of 8 versus 7, indicating very strong internal financial health. AMETEK remains strong but slightly behind, signaling fewer operational red flags in Rockwell’s metrics:
How are the two companies positioned?
This section dissects AMETEK and Rockwell Automation’s operational DNA by comparing revenue distribution and internal dynamics. The goal is to confront their economic moats to identify the most resilient competitive advantage today.
Revenue Segmentation: The Strategic Mix
The following visual comparison dissects how AMETEK, Inc. and Rockwell Automation, Inc. diversify their income streams and where their primary sector bets lie:
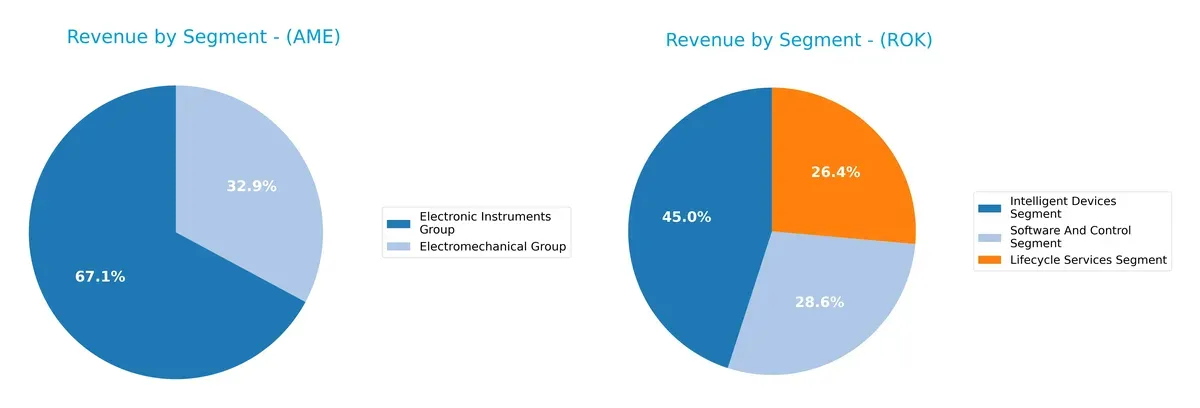
AMETEK anchors its revenue in two segments: Electronic Instruments at $4.7B and Electromechanical Group at $2.3B, showing moderate diversification. Rockwell Automation, however, presents a more balanced three-segment mix, with Intelligent Devices at $3.8B, Lifecycle Services at $2.3B, and Software and Control at $2.2B. Rockwell’s tri-segment approach reduces concentration risk, while AMETEK’s heavier reliance on Electronic Instruments suggests focused expertise but higher exposure to that segment’s cycle.
Strengths and Weaknesses Comparison
This table compares the Strengths and Weaknesses of AMETEK, Inc. and Rockwell Automation, Inc.:
AMETEK Strengths
- Balanced product segmentation with Electromechanical and Electronic Instruments groups
- Consistent US and Asia market presence
- Favorable net margin (20%) and ROIC (11%)
- Low debt-to-assets (14%) and strong interest coverage (23x)
Rockwell Automation Strengths
- Diverse segments including Intelligent Devices, Lifecycle Services, Software
- Strong US and EMEA geographic reach
- Favorable ROE (24%) and ROIC (14%)
- Solid interest coverage (7x) and fixed asset turnover (7x)
AMETEK Weaknesses
- Unfavorable valuation metrics (PE 32, PB 4.5)
- Low quick ratio (0.67) and asset turnover (0.46)
- Dividend yield low at 0.6%
- Neutral ROE (14%) and WACC (8.5%)
Rockwell Automation Weaknesses
- Unfavorable valuation (PE 45, PB 11)
- High WACC (11%) and leverage (debt-to-assets 33%)
- Quick ratio weak at 0.77
- Moderate net margin (10%) and lower interest coverage (7x)
AMETEK shows operational efficiency and conservative leverage, but valuation and liquidity ratios deserve caution. Rockwell Automation excels in profitability and segment diversity but carries higher financial risk and valuation premiums.
The Moat Duel: Analyzing Competitive Defensibility
A structural moat is the only reliable shield protecting long-term profits from relentless competition and margin erosion:
AMETEK, Inc.: Precision Engineering and Operational Excellence
AMETEK’s moat stems from advanced electromechanical and electronic instruments with high switching costs. Its 25.4% EBIT margin signals efficient capital use. Expansion in aerospace and industrial sectors should deepen this moat in 2026.
Rockwell Automation, Inc.: Integrated Automation Ecosystem
Rockwell’s competitive edge lies in its software-driven automation platform, leveraging network effects unlike AMETEK’s product-centric model. Despite a strong ROIC gap over WACC, recent margin pressure calls for cautious optimism amid digital transformation opportunities.
Capital Efficiency vs. Ecosystem Integration: The Moat Face-off
Both firms create value with ROIC exceeding WACC, but Rockwell’s 77% ROIC growth outpaces AMETEK’s 11%, revealing a deeper moat. Yet, AMETEK’s stable margins better position it to defend market share against volatility.
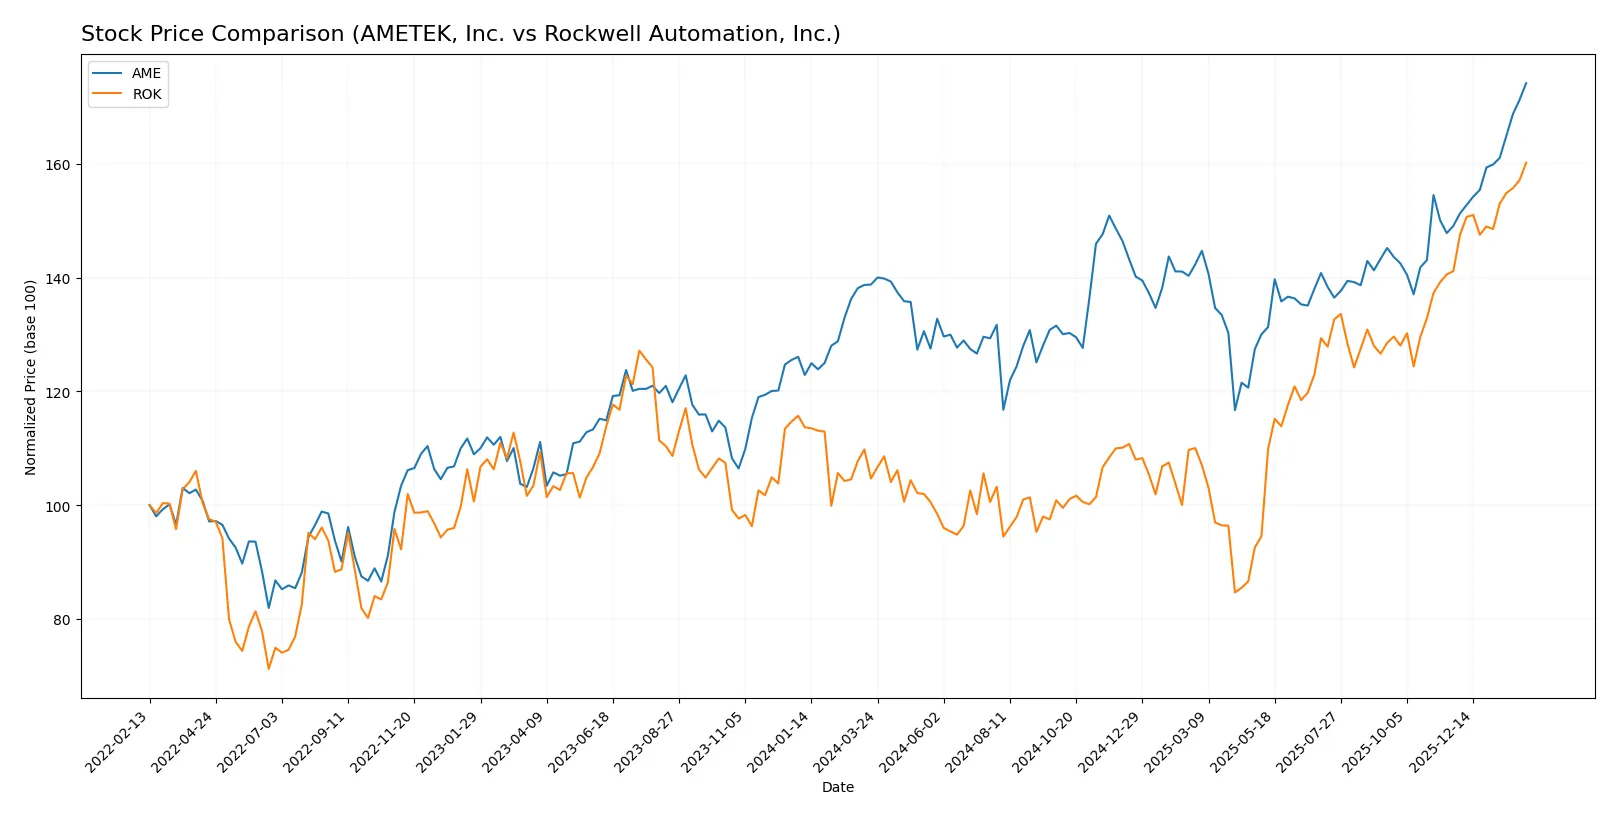
Which stock offers better returns?
The stock price chart highlights significant gains for both AMETEK, Inc. and Rockwell Automation, Inc. over the past year, with accelerating upward trends and marked price appreciation.
Trend Comparison
AMETEK, Inc. shows a 25.51% price increase over the past 12 months, indicating a bullish trend with accelerating momentum and moderate volatility (14.42 std deviation). The stock hit a high of 227.83 and a low of 152.66.
Rockwell Automation, Inc. posted a stronger 53.03% gain over the same period, also bullish with acceleration. Its volatility is notably higher at 50.22 std deviation, with a price range from 227.11 to 429.84.
Rockwell Automation outperformed AMETEK in market returns, delivering the highest price appreciation and a more pronounced upward trend over the past year.
Target Prices
Analysts present a confident target price consensus for AMETEK, Inc. and Rockwell Automation, Inc.
| Company | Target Low | Target High | Consensus |
|---|---|---|---|
| AMETEK, Inc. | 204 | 271 | 237.91 |
| Rockwell Automation, Inc. | 380 | 470 | 421.57 |
The target consensus for AMETEK suggests upside potential from the current price of 228, indicating moderate growth expectations. Rockwell Automation’s consensus price sits slightly below the current 430, reflecting a cautious yet stable outlook.

Don’t Let Luck Decide Your Entry Point
Optimize your entry points with our advanced ProRealTime indicators. You’ll get efficient buy signals with precise price targets for maximum performance. Start outperforming now!
How do institutions grade them?
AMETEK, Inc. Grades
The following table summarizes recent institutional grades for AMETEK, Inc.:
| Grading Company | Action | New Grade | Date |
|---|---|---|---|
| Keybanc | Maintain | Overweight | 2026-02-04 |
| DA Davidson | Maintain | Buy | 2026-02-04 |
| Barclays | Maintain | Equal Weight | 2026-02-04 |
| Oppenheimer | Downgrade | Perform | 2026-01-27 |
| Morgan Stanley | Maintain | Equal Weight | 2026-01-12 |
| Barclays | Maintain | Equal Weight | 2026-01-07 |
| Keybanc | Maintain | Overweight | 2026-01-07 |
| Keybanc | Maintain | Overweight | 2026-01-06 |
| Mizuho | Maintain | Outperform | 2026-01-05 |
| TD Cowen | Upgrade | Buy | 2025-12-23 |
Rockwell Automation, Inc. Grades
The following table summarizes recent institutional grades for Rockwell Automation, Inc.:
| Grading Company | Action | New Grade | Date |
|---|---|---|---|
| Oppenheimer | Downgrade | Perform | 2026-01-20 |
| JP Morgan | Maintain | Neutral | 2026-01-16 |
| Morgan Stanley | Maintain | Overweight | 2026-01-13 |
| Wells Fargo | Maintain | Equal Weight | 2026-01-07 |
| Barclays | Maintain | Overweight | 2026-01-07 |
| Goldman Sachs | Upgrade | Neutral | 2025-12-16 |
| Jefferies | Maintain | Buy | 2025-12-10 |
| Citigroup | Maintain | Buy | 2025-12-08 |
| Barclays | Maintain | Overweight | 2025-12-04 |
| Baird | Maintain | Outperform | 2025-11-21 |
Which company has the best grades?
AMETEK, Inc. generally holds “Overweight” and “Buy” ratings, with some “Equal Weight” grades. Rockwell Automation, Inc. features a broader spread from “Neutral” to “Outperform.” AMETEK’s higher frequency of “Overweight” and “Buy” may suggest stronger analyst conviction, potentially influencing investor confidence more positively.
Risks specific to each company
The following categories identify the critical pressure points and systemic threats facing both firms in the 2026 market environment:
1. Market & Competition
AMETEK, Inc.
- Operates diversified industrial machinery segments with moderate net margin (20%). Faces pressure from high P/E and P/B ratios.
Rockwell Automation, Inc.
- Higher beta (1.53) signals greater market sensitivity. Faces intense competition in automation software with elevated valuations.
2. Capital Structure & Debt
AMETEK, Inc.
- Low debt-to-equity (0.21) and strong interest coverage (23x) indicate conservative leverage.
Rockwell Automation, Inc.
- Debt-to-equity at 1.0 is high, increasing financial risk despite adequate interest coverage (6.9x).
3. Stock Volatility
AMETEK, Inc.
- Beta at 1.04, close to market average, suggests moderate volatility.
Rockwell Automation, Inc.
- Beta at 1.53 indicates above-market volatility, raising risk for investors.
4. Regulatory & Legal
AMETEK, Inc.
- Industrial sector exposure with standard regulatory compliance risks.
Rockwell Automation, Inc.
- Automation and software segments face evolving cybersecurity and compliance rules, increasing legal complexity.
5. Supply Chain & Operations
AMETEK, Inc.
- Broad industrial footprint with moderate asset turnover (0.46) signals operational efficiency challenges.
Rockwell Automation, Inc.
- Slightly better asset turnover (0.74) but complexity in software and hardware integration poses supply risks.
6. ESG & Climate Transition
AMETEK, Inc.
- Moderate ESG pressures typical of heavy industrial manufacturers; progress in environmental sensors.
Rockwell Automation, Inc.
- Stronger focus on digital transformation aligns with energy efficiency trends but exposed to scrutiny on data privacy.
7. Geopolitical Exposure
AMETEK, Inc.
- Global sales diversification mitigates isolated geopolitical risks.
Rockwell Automation, Inc.
- Operations in multiple discrete and process industries increase sensitivity to trade tensions and tariffs.
Which company shows a better risk-adjusted profile?
AME faces moderate market valuation and operational efficiency risks but benefits from a strong balance sheet and lower leverage. ROK exhibits higher financial risk due to elevated debt and greater stock volatility despite superior profitability metrics. AME’s conservative capital structure offers a more balanced risk profile in 2026.
Final Verdict: Which stock to choose?
AMETEK, Inc. stands out as a cash-generative industrial powerhouse with a proven ability to create value sustainably. Its superpower lies in efficient capital allocation and steadily growing returns on invested capital. A point of vigilance is its moderate liquidity profile, which could challenge short-term flexibility. It fits well in portfolios targeting steady, long-term growth with moderate risk tolerance.
Rockwell Automation, Inc. boasts a strategic moat anchored in automation and digital transformation leadership, delivering high returns on equity and strong cash flows. Compared to AMETEK, it carries higher leverage and a more volatile earnings trend, suggesting a slightly riskier profile. Its appeal suits investors seeking growth combined with innovation exposure, aligned with a GARP (Growth at a Reasonable Price) strategy.
If you prioritize consistent value creation and capital efficiency, AMETEK is the compelling choice due to its stable margins and strong balance sheet. However, if you seek growth driven by technological leadership and can tolerate higher volatility, Rockwell Automation offers superior upside potential with a commanding market position. Each presents a distinct scenario for investors balancing growth and risk.
Disclaimer: Investment carries a risk of loss of initial capital. The past performance is not a reliable indicator of future results. Be sure to understand risks before making an investment decision.
Go Further
I encourage you to read the complete analyses of AMETEK, Inc. and Rockwell Automation, Inc. to enhance your investment decisions: