Home > Comparison > Industrials > AME vs PSN
The strategic rivalry between AMETEK, Inc. and Parsons Corporation shapes the industrial machinery sector’s evolution. AMETEK operates as a diversified manufacturer of electronic instruments and electromechanical devices, emphasizing advanced process and aerospace solutions. Parsons focuses on integrated defense, intelligence, and critical infrastructure services, blending technology with engineering. This analysis weighs their contrasting operational models to identify which offers superior risk-adjusted returns for a diversified portfolio.
Table of contents
Companies Overview
AMETEK and Parsons Corporation stand as pivotal players in the industrial machinery sector, each commanding distinct niches and strategic priorities.
AMETEK, Inc.: Precision Instruments and Electromechanical Solutions
AMETEK dominates the market with its electronic instruments and electromechanical devices spanning aerospace, industrial, and specialized manufacturing sectors. Its core revenue derives from two segments: Electronic Instruments and Electromechanical, serving high-tech industries with advanced sensors, power supplies, and precision motion control. In 2026, AMETEK prioritizes innovation in sensor technology and power management, enhancing its competitive edge through diversified industrial applications.
Parsons Corporation: Defense and Critical Infrastructure Innovator
Parsons Corporation anchors its identity in integrated solutions for defense, intelligence, and critical infrastructure markets worldwide. Revenue stems from its Federal Solutions and Critical Infrastructure segments, delivering cybersecurity, missile defense, and smart city technologies. The company’s 2026 strategy focuses on expanding its footprint in cybersecurity and mission-critical infrastructure, leveraging advanced analytics and space situational awareness to support government and private sectors.
Strategic Collision: Similarities & Divergences
Both companies operate within industrial machinery but diverge sharply in business philosophy: AMETEK emphasizes precision manufacturing and diversified industrial instrumentation, while Parsons pursues a specialized defense and infrastructure services model. Their primary battleground lies in government and aerospace sectors, where high reliability and innovation are paramount. AMETEK offers a broad industrial exposure with strong product moats; Parsons presents a niche, high-barrier defense profile appealing to investors seeking specialized government contract resilience.
Income Statement Comparison
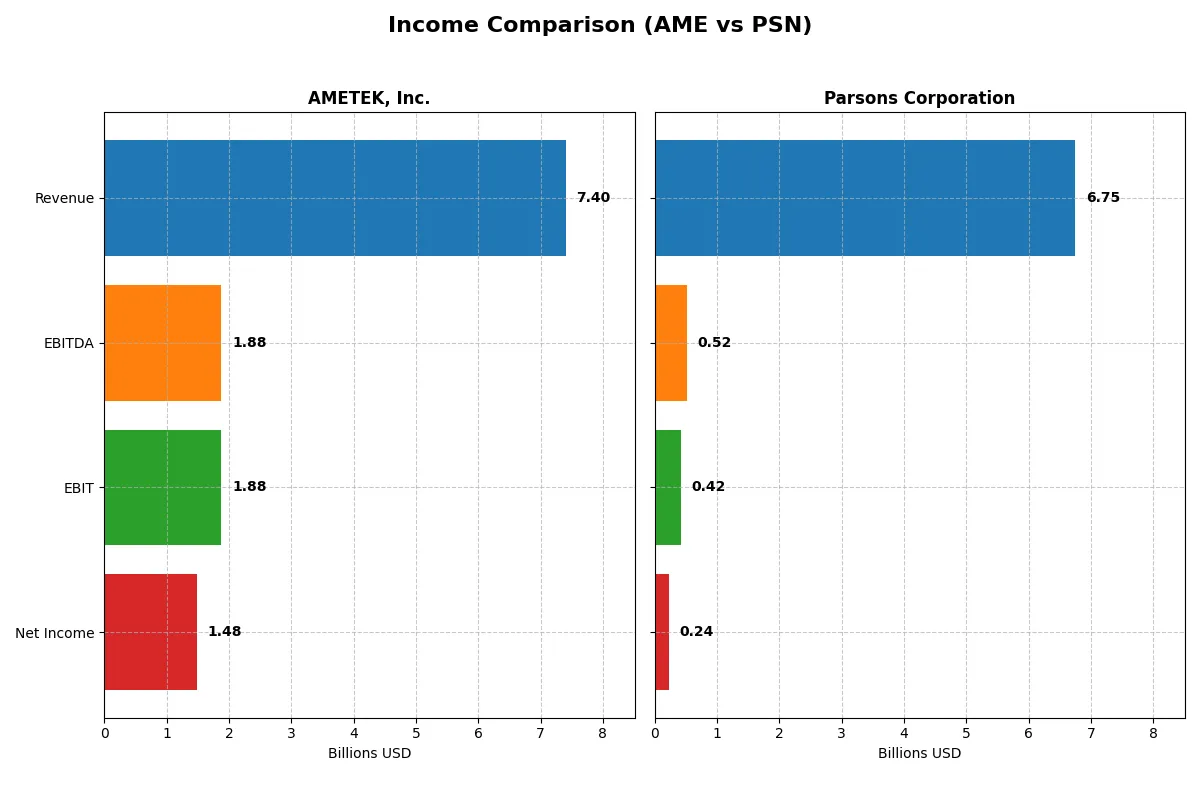
The following table dissects the core profitability and scalability of both corporate engines to reveal who dominates the bottom line:
| Metric | AMETEK, Inc. (AME) | Parsons Corporation (PSN) |
|---|---|---|
| Revenue | 7.4B | 6.8B |
| Cost of Revenue | 4.7B | 5.3B |
| Operating Expenses | 757M | 978M |
| Gross Profit | 2.7B | 1.4B |
| EBITDA | 1.9B | 518M |
| EBIT | 1.9B | 419M |
| Interest Expense | 81M | 52M |
| Net Income | 1.5B | 238M |
| EPS | 6.42 | 2.21 |
| Fiscal Year | 2025 | 2024 |
Income Statement Analysis: The Bottom-Line Duel
This income statement comparison reveals which company operates its business with superior efficiency and sustainable profit generation.
AMETEK, Inc. Analysis
AMETEK’s revenue grew steadily from 5.5B in 2021 to 7.4B in 2025, with net income rising from 990M to 1.48B. Its gross margin holds strong at 36.4%, and net margin remains healthy at 20%. The 2025 figures show solid momentum, supported by a favorable EBIT margin of 25.4%, reflecting disciplined cost control and consistent profitability.
Parsons Corporation Analysis
Parsons increased revenue impressively from 3.7B in 2021 to 6.75B in 2024, with net income surging from 66M to 238M. Despite a lower gross margin of 20.8%, Parsons improved its EBIT margin to 6.2% and net margin to 3.5%. The 2024 year marks strong growth momentum, with revenue and earnings expanding at double-digit rates, signaling operational scaling.
Margin Strength vs. Growth Surge
AMETEK delivers superior margins and more consistent profitability, with a net margin nearly six times Parsons’ level. Parsons, however, exhibits faster revenue and earnings growth, nearly doubling its net income over four years. For investors prioritizing stable profit quality, AMETEK’s profile is more attractive. Growth-focused investors might find Parsons’ momentum compelling despite thinner margins.
Financial Ratios Comparison
These vital ratios act as a diagnostic tool to expose the underlying fiscal health, valuation premiums, and capital efficiency of the companies compared below:
| Ratios | AMETEK, Inc. (AME) | Parsons Corporation (PSN) |
|---|---|---|
| ROE | 14.0% | 9.7% |
| ROIC | 11.0% | 8.3% |
| P/E | 32.0 | 41.7 |
| P/B | 4.45 | 4.06 |
| Current Ratio | 1.06 | 1.29 |
| Quick Ratio | 0.67 | 1.29 |
| D/E | 0.21 | 0.59 |
| Debt-to-Assets | 14.2% | 25.9% |
| Interest Coverage | 23.8 | 8.3 |
| Asset Turnover | 0.46 | 1.23 |
| Fixed Asset Turnover | 6.56 | 25.51 |
| Payout ratio | 19.3% | 0% |
| Dividend yield | 0.60% | 0% |
| Fiscal Year | 2025 | 2024 |
Efficiency & Valuation Duel: The Vital Signs
Financial ratios act as a company’s DNA, revealing hidden risks and operational excellence that shape investor decisions profoundly.
AMETEK, Inc.
AMETEK shows solid profitability with a 13.93% ROE and a favorable 20% net margin, indicating efficient core operations. However, its valuation appears stretched with a high P/E of 31.97 and P/B of 4.45. The company returns capital via a modest 0.6% dividend yield, favoring reinvestment over aggressive payouts.
Parsons Corporation
Parsons exhibits weaker profitability, with a 9.73% ROE and a slim 3.48% net margin, signaling operational challenges. Its valuation is more stretched, carrying a P/E of 41.72 and a P/B of 4.06. Parsons pays no dividend, instead channeling resources into growth and sustaining a solid interest coverage ratio of 8.13.
Premium Valuation vs. Operational Efficiency
Both companies share slightly favorable ratio profiles, but AMETEK offers stronger profitability and a more balanced capital return approach despite a high valuation. Parsons’s higher valuation and lower margins increase risk. Investors seeking operational stability may prefer AMETEK, while growth-focused profiles might consider Parsons’s reinvestment strategy.
Which one offers the Superior Shareholder Reward?
I observe AMETEK (AME) pays a consistent dividend yield near 0.62%, with a payout ratio around 19%, well-covered by robust free cash flow. AME also pursues modest buybacks, enhancing total returns sustainably. Conversely, Parsons (PSN) pays no dividend but reinvests heavily, supported by improving margins. PSN’s buybacks are less prominent, reflecting cautious capital allocation. Historically, dividend plus buyback strategies like AME’s deliver steadier shareholder rewards. In 2026, I favor AME for superior total return, balancing yield, buybacks, and sustainability.
Comparative Score Analysis: The Strategic Profile
The radar chart reveals the fundamental DNA and trade-offs of AMETEK, Inc. and Parsons Corporation, highlighting their financial strengths and market positioning:
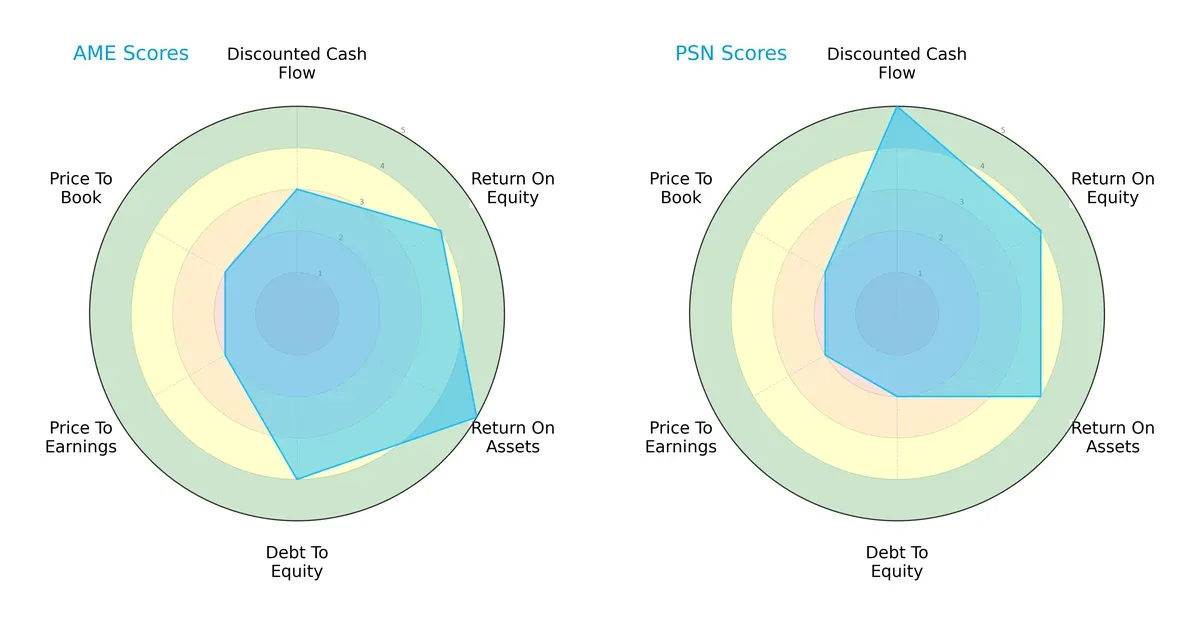
AMETEK shows a more balanced profile with strong ROA (5) and debt management (4), while Parsons excels in discounted cash flow (5) but has weaker leverage control (2). AMETEK’s consistent returns and moderate valuation scores contrast with Parsons’ reliance on cash flow strength, signaling different strategic focuses.
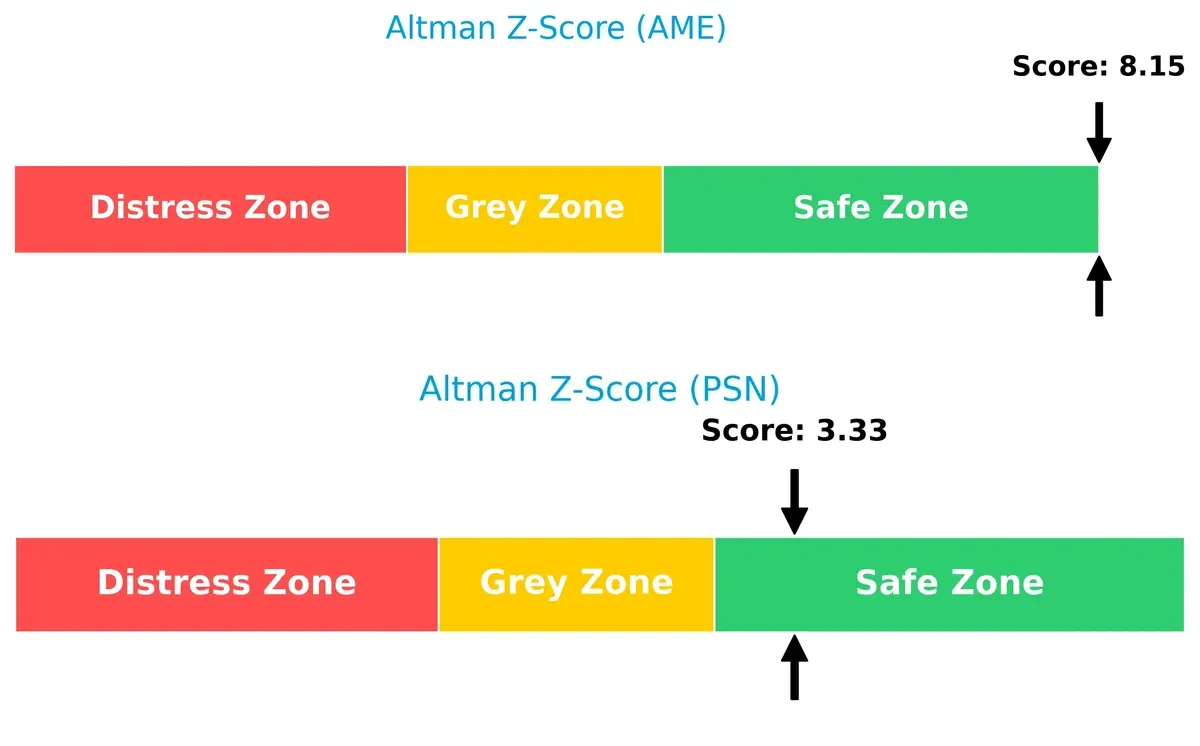
Bankruptcy Risk: Solvency Showdown
AMETEK’s Altman Z-Score of 8.15 far surpasses Parsons’ 3.33, indicating a much safer solvency position for AMETEK in this economic cycle:
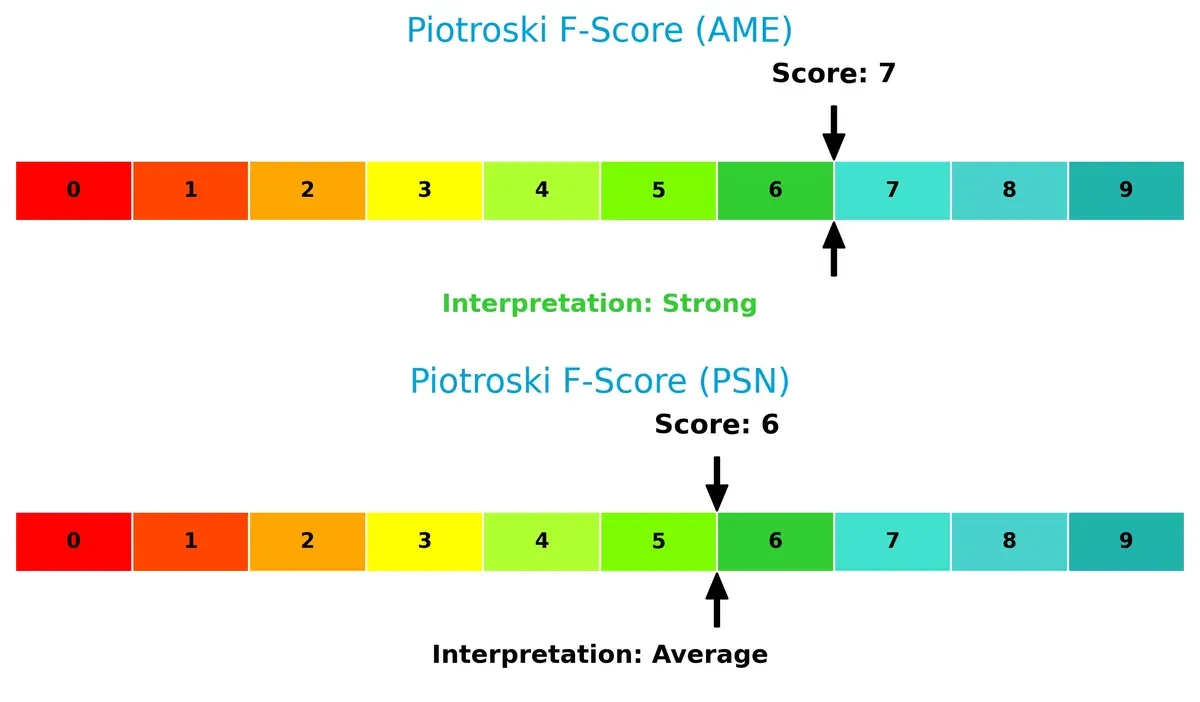
Financial Health: Quality of Operations
AMETEK’s Piotroski F-Score of 7 suggests stronger financial health than Parsons’ 6, with Parsons showing slight red flags in operational consistency:
How are the two companies positioned?
This section dissects AME and PSN’s operational DNA by comparing revenue distribution and internal strengths and weaknesses. The goal is to confront their economic moats to reveal which model offers the most resilient competitive advantage today.
Revenue Segmentation: The Strategic Mix
This visual comparison dissects how AMETEK, Inc. and Parsons Corporation diversify their income streams and highlights their primary sector bets:
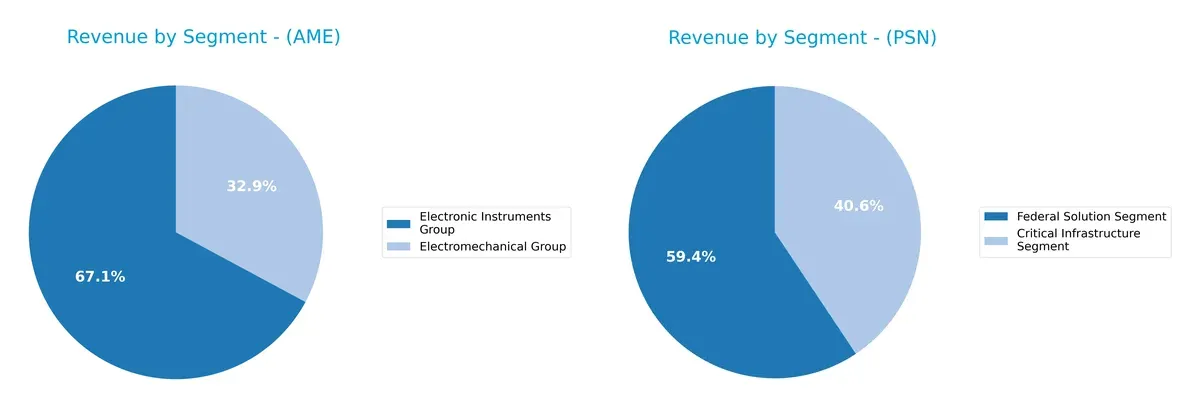
AMETEK anchors revenue in two balanced segments: $4.66B from Electronic Instruments and $2.28B from Electromechanical Group. Parsons relies heavily on its Federal Solution Segment, which dwarfs its $2.74B Critical Infrastructure revenue with $4.01B. AMETEK’s dual-segment mix suggests resilience and cross-sector exposure. Parsons shows concentration risk but benefits from federal contracts’ stability and infrastructure dominance.
Strengths and Weaknesses Comparison
This table compares the strengths and weaknesses of AMETEK, Inc. and Parsons Corporation:
AMETEK Strengths
- Diverse revenue from Electromechanical and Electronic Instruments groups
- Solid net margin at 20%
- Favorable ROIC above WACC
- Low debt-to-assets at 14%
- Strong interest coverage at 23x
- Global presence across US, UK, EU, Asia
Parsons Strengths
- Revenue diversified between Critical Infrastructure and Federal Solutions
- Favorable WACC at 6.24% below ROIC
- Strong asset and fixed asset turnover
- Higher current and quick ratios indicating liquidity
- Interest coverage at 8x
- Significant presence in North America and Middle East
AMETEK Weaknesses
- Unfavorable high P/E and P/B multiples
- Quick ratio below 1 indicating liquidity risk
- Low asset turnover at 0.46
- Dividend yield low at 0.6%
- ROE neutral at 13.9%
Parsons Weaknesses
- Low net margin at 3.5%
- ROE below 10% and unfavorable
- Unfavorable high P/E and P/B multiples
- No dividend yield
- Higher debt-to-assets ratio at 26%
AMETEK exhibits strong profitability and conservative leverage but faces valuation and liquidity concerns. Parsons shows operational efficiency and liquidity strengths but struggles with profitability and higher leverage. These contrasts highlight differing strategic focuses and financial health.
The Moat Duel: Analyzing Competitive Defensibility
A structural moat shields long-term profits from relentless competitive pressures. Without it, earnings erode rapidly. Let’s examine the moat dynamics of two industrial players:
AMETEK, Inc.: Precision Engineering with Durable Cost Advantage
AMETEK’s moat stems from its cost advantage and specialized electromechanical instruments. This drives a strong 25.4% EBIT margin and stable 20% net margin. In 2026, expansion into aerospace sensors could deepen its moat amid rising complexity.
Parsons Corporation: Integrated Defense Network Effects
Parsons leverages network effects in defense and critical infrastructure, enhancing client stickiness. Its 6.21% EBIT margin trails AMETEK but grows rapidly, driven by 41.8% EBIT growth last year. The firm’s expanding cybersecurity platforms offer disruptive growth potential.
Verdict: Cost Leadership vs. Network Expansion
AMETEK boasts a wider moat with higher ROIC and margin stability. Parsons shows a steeper ROIC growth trend but remains a narrower moat player. AMETEK is better positioned to defend entrenched industrial market share in 2026.
Which stock offers better returns?
The past year revealed sharply divergent price trends for AMETEK, Inc. and Parsons Corporation, showcasing distinct trading dynamics and market sentiment shifts.
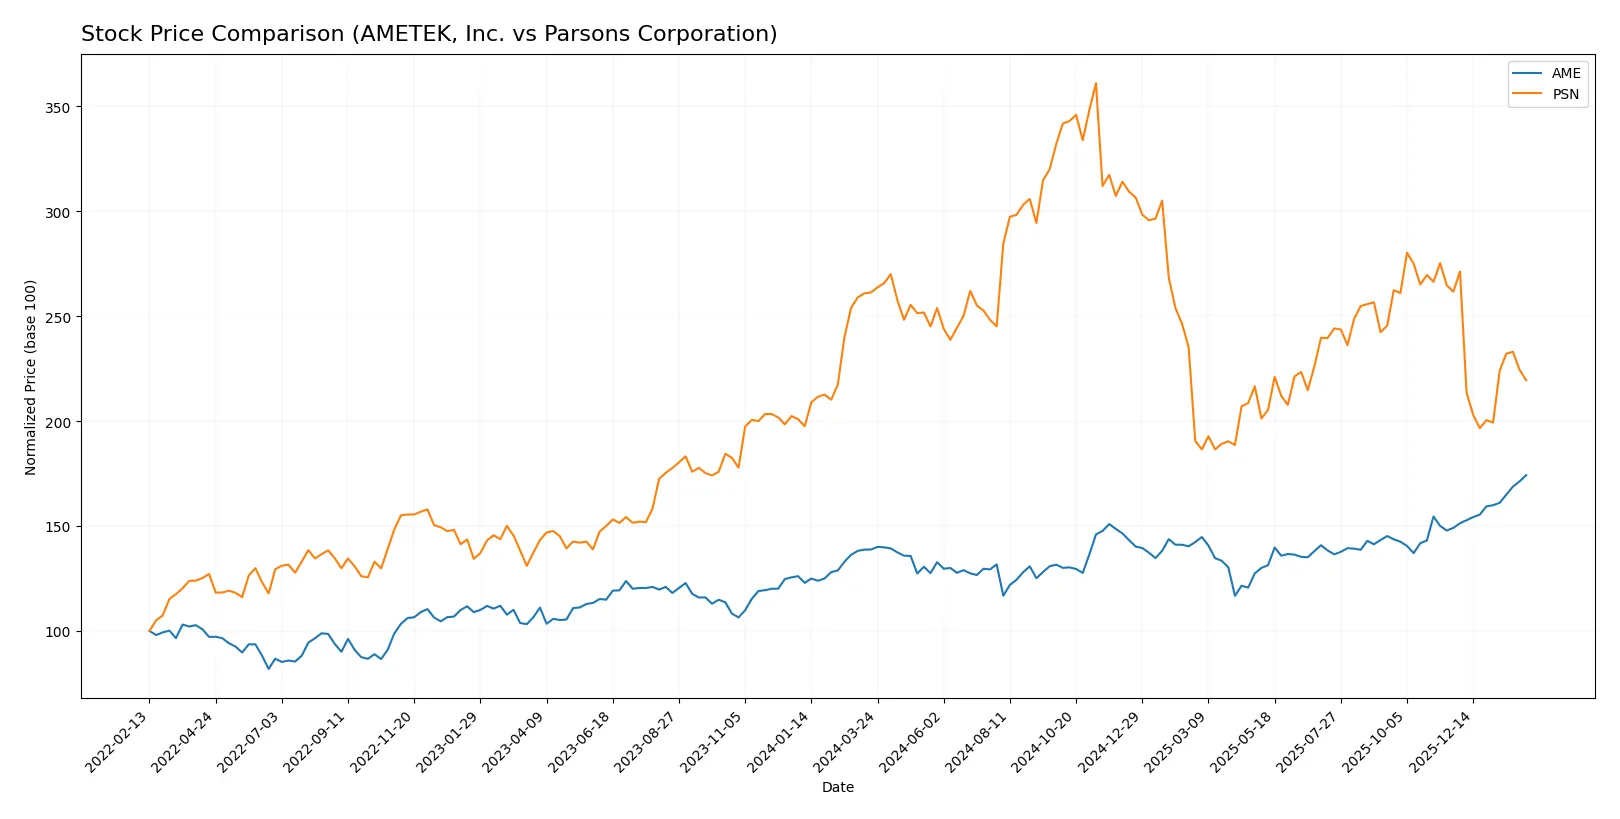
Trend Comparison
AMETEK, Inc. posted a 25.51% price gain over the past year, confirming a bullish trend with accelerating momentum and a high of 227.83. Volatility remains elevated at 14.42%.
Parsons Corporation endured a 16.01% price decline, marking a bearish trend with decelerating losses and a low of 58.22. Its volatility measured 13.1%, slightly below AMETEK’s.
AMETEK’s robust price appreciation outperforms Parsons’ decline, delivering the stronger market performance among these peers.
Target Prices
Analysts present a solid target consensus for AMETEK, Inc. and Parsons Corporation.
| Company | Target Low | Target High | Consensus |
|---|---|---|---|
| AMETEK, Inc. | 204 | 271 | 237.91 |
| Parsons Corporation | 78 | 104 | 86.8 |
The consensus target prices for both stocks suggest moderate upside from current levels, reflecting analyst confidence in their industrial sector growth prospects. AMETEK’s target exceeds its current price by about 4.5%, while Parsons shows roughly 27% potential upside.

Don’t Let Luck Decide Your Entry Point
Optimize your entry points with our advanced ProRealTime indicators. You’ll get efficient buy signals with precise price targets for maximum performance. Start outperforming now!
How do institutions grade them?
The following tables summarize recent institutional grades for AMETEK, Inc. and Parsons Corporation:
AMETEK, Inc. Grades
This table lists recent grade actions from credible financial institutions for AMETEK, Inc.
| Grading Company | Action | New Grade | Date |
|---|---|---|---|
| Keybanc | maintain | Overweight | 2026-02-04 |
| DA Davidson | maintain | Buy | 2026-02-04 |
| Barclays | maintain | Equal Weight | 2026-02-04 |
| Oppenheimer | downgrade | Perform | 2026-01-27 |
| Morgan Stanley | maintain | Equal Weight | 2026-01-12 |
| Barclays | maintain | Equal Weight | 2026-01-07 |
| Keybanc | maintain | Overweight | 2026-01-07 |
| Keybanc | maintain | Overweight | 2026-01-06 |
| Mizuho | maintain | Outperform | 2026-01-05 |
| TD Cowen | upgrade | Buy | 2025-12-23 |
Parsons Corporation Grades
Below is a summary of recent grades from reputable firms for Parsons Corporation.
| Grading Company | Action | New Grade | Date |
|---|---|---|---|
| Barclays | maintain | Overweight | 2026-01-23 |
| Keybanc | maintain | Overweight | 2026-01-20 |
| UBS | maintain | Buy | 2026-01-15 |
| Citigroup | maintain | Buy | 2026-01-13 |
| B of A Securities | maintain | Buy | 2025-12-30 |
| Stifel | maintain | Buy | 2025-12-23 |
| Jefferies | maintain | Hold | 2025-12-11 |
| TD Cowen | upgrade | Buy | 2025-12-10 |
| Truist Securities | maintain | Buy | 2025-12-08 |
| Baird | maintain | Outperform | 2025-12-08 |
Which company has the best grades?
Parsons Corporation consistently receives buy and overweight ratings from multiple firms. AMETEK’s grades are more mixed, including equal weight and a recent downgrade. Investors may view Parsons as having stronger institutional confidence.
Risks specific to each company
The following categories identify the critical pressure points and systemic threats facing AMETEK, Inc. and Parsons Corporation in the 2026 market environment:
1. Market & Competition
AMETEK, Inc.
- Faces intense competition in industrial machinery, relying on innovation to maintain market share.
Parsons Corporation
- Operates in defense and critical infrastructure with niche competition but high dependency on government contracts.
2. Capital Structure & Debt
AMETEK, Inc.
- Maintains low debt-to-equity (0.21) with strong interest coverage (23.13), indicating conservative leverage.
Parsons Corporation
- Higher debt ratio (0.59) and moderate coverage (8.13) increase financial risk but manageable with steady cash flows.
3. Stock Volatility
AMETEK, Inc.
- Beta near market average (1.036) suggests typical volatility for industrial sector stocks.
Parsons Corporation
- Lower beta (0.665) indicates less sensitivity to market swings, reflecting defense sector stability.
4. Regulatory & Legal
AMETEK, Inc.
- Exposure to environmental regulations and product safety standards across global operations.
Parsons Corporation
- Subject to stringent defense contracting regulations and cybersecurity compliance risks.
5. Supply Chain & Operations
AMETEK, Inc.
- Complex global supply chains risk disruption, impacting precision manufacturing and inventory.
Parsons Corporation
- Operational risks tied to project execution and specialized technology supply in defense and infrastructure.
6. ESG & Climate Transition
AMETEK, Inc.
- Faces pressure to reduce emissions in manufacturing and improve sustainability metrics.
Parsons Corporation
- Must navigate climate-related risks in infrastructure projects and defense operations adapting to new policies.
7. Geopolitical Exposure
AMETEK, Inc.
- Global footprint exposes it to trade tensions and regional economic instability.
Parsons Corporation
- High exposure to U.S. government and international defense alliances increases geopolitical risk sensitivity.
Which company shows a better risk-adjusted profile?
AMETEK’s strongest risk is supply chain complexity impacting operational efficiency. Parsons’ dominant risk lies in regulatory and geopolitical dependence on defense contracts. AMETEK’s lower leverage and solid interest coverage provide a more stable capital base. Parsons benefits from lower stock volatility but faces higher regulatory and geopolitical uncertainties. Given these factors and their Altman Z-scores—8.15 (AME) vs. 3.33 (PSN)—AMETEK offers a superior risk-adjusted profile. The recent strong interest coverage ratio for AMETEK reassures its financial resilience amid market pressures.
Final Verdict: Which stock to choose?
AMETEK, Inc. shines with unmatched capital efficiency and a very favorable moat, consistently creating value above its cost of capital. Its key point of vigilance is the moderately high valuation multiples, which might temper near-term upside. AMETEK fits well in an Aggressive Growth portfolio seeking durable profitability.
Parsons Corporation offers a strategic moat rooted in solid income quality and a growing return on invested capital. Its stronger liquidity ratios and lower operational leverage provide a safer profile relative to AMETEK. Parsons suits investors favoring GARP—balancing growth potential with reasonable financial prudence.
If you prioritize strong economic moats and robust profitability, AMETEK outshines with superior capital returns and accelerating momentum. However, if you seek better liquidity and a more conservative risk profile, Parsons offers better stability and growth at a more measured valuation. Both present compelling cases, depending on your risk tolerance and portfolio strategy.
Disclaimer: Investment carries a risk of loss of initial capital. The past performance is not a reliable indicator of future results. Be sure to understand risks before making an investment decision.
Go Further
I encourage you to read the complete analyses of AMETEK, Inc. and Parsons Corporation to enhance your investment decisions: