Home > Comparison > Industrials > PH vs AME
The strategic rivalry between Parker-Hannifin Corporation and AMETEK, Inc. shapes the industrial machinery sector’s future. Parker-Hannifin operates as a capital-intensive leader in motion and control technologies serving diverse markets, while AMETEK focuses on high-margin electronic instruments and electromechanical devices. This analysis explores their contrasting operational models and competitive edge to identify which company presents a superior risk-adjusted return for a diversified industrial portfolio in 2026.
Table of contents
Companies Overview
Parker-Hannifin and AMETEK lead the industrial machinery sector with distinct market strengths and innovation paths.
Parker-Hannifin Corporation: Leader in Motion and Control Technologies
Parker-Hannifin dominates as a global provider of motion and control systems for mobile, industrial, and aerospace markets. Its revenue streams come from diversified industrial products and aerospace systems, including hydraulic and pneumatic components. In 2026, the company focuses on expanding its aerospace segment while sustaining its industrial machinery market share through advanced sealing and filtration technologies.
AMETEK, Inc.: Innovator in Electronic Instruments and Electromechanical Devices
AMETEK is a key player in manufacturing electronic instruments and electromechanical devices serving aerospace, industrial, and process markets. Its Electronic Instruments and Electromechanical segments drive sales with precision instruments and thermal management products. The firm prioritizes technological advancement in power quality monitoring and aviation maintenance services to bolster growth in specialized industrial applications.
Strategic Collision: Similarities & Divergences
Both firms target industrial machinery but diverge in approach—Parker-Hannifin emphasizes integrated motion control solutions, while AMETEK pursues advanced instrumentation and electromechanical innovation. Their competitive battleground lies in aerospace and industrial automation markets. Parker-Hannifin offers a broad industrial footprint with high operational scale; AMETEK focuses on niche, technology-driven segments, defining distinct investment profiles with varied risk and growth dynamics.
Income Statement Comparison
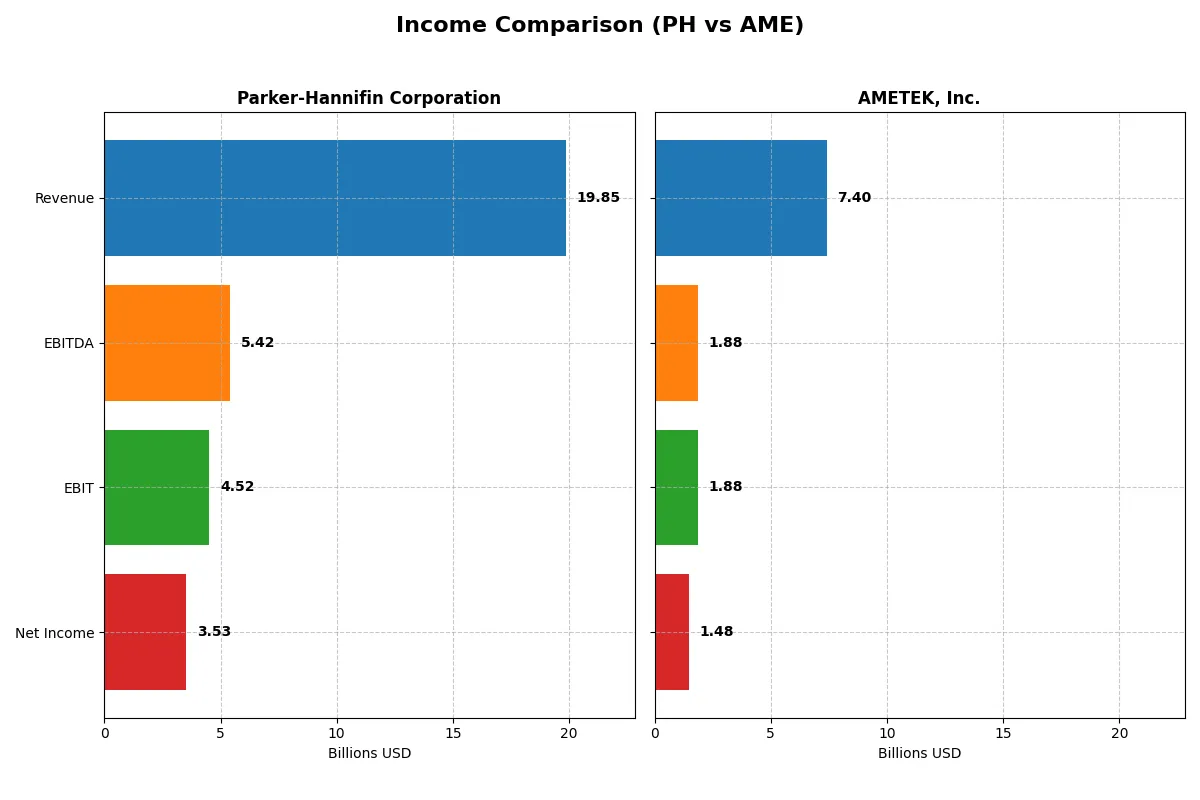
The following data dissects the core profitability and scalability of both corporate engines to reveal who dominates the bottom line:
| Metric | Parker-Hannifin Corporation (PH) | AMETEK, Inc. (AME) |
|---|---|---|
| Revenue | 19.85B | 7.40B |
| Cost of Revenue | 12.54B | 4.71B |
| Operating Expenses | 3.26B | 0.76B |
| Gross Profit | 7.32B | 2.69B |
| EBITDA | 5.42B | 1.88B |
| EBIT | 4.52B | 1.88B |
| Interest Expense | 409M | 81M |
| Net Income | 3.53B | 1.48B |
| EPS | 27.52 | 6.42 |
| Fiscal Year | 2025 | 2025 |
Income Statement Analysis: The Bottom-Line Duel
This income statement comparison reveals which company operates with superior efficiency and sustainable profitability in their sector.
Parker-Hannifin Corporation Analysis
Parker-Hannifin’s revenue remains stable near 19.85B in 2025, showing a slight 0.4% decline from the prior year. Net income surges 24.6% to 3.53B, reflecting strong margin expansion. Gross margin holds favorably at 36.85%, while net margin improves to 17.79%. The company’s operating leverage drives a 10.1% EBIT growth, signaling enhanced profit efficiency despite flat top-line growth.
AMETEK, Inc. Analysis
AMETEK posts steady revenue growth, up 6.6% to 7.4B in 2025, with gross margin at a solid 36.4%. Net income rises 7.9% to 1.48B, maintaining a robust 20% net margin. EBIT margin leads at 25.4%, underscoring operational discipline. However, operating expenses grow in line with revenue, slightly pressuring margin expansion. The company shows consistent profit momentum alongside moderate revenue gains.
Margin Strength vs. Revenue Stability
Parker-Hannifin delivers higher net income and stronger margin improvement, indicating superior operational efficiency. AMETEK grows revenue more consistently with slightly better EBIT margin but lower absolute profits. For investors, Parker-Hannifin’s profile appeals to those valuing margin expansion and bottom-line growth, while AMETEK suits those prioritizing steady top-line increases with solid profitability.
Financial Ratios Comparison
These vital ratios act as a diagnostic tool to expose the underlying fiscal health, valuation premiums, and capital efficiency of the companies compared below:
| Ratios | Parker-Hannifin (PH) | AMETEK (AME) |
|---|---|---|
| ROE | 25.8% | 13.9% |
| ROIC | 13.7% | 11.0% |
| P/E | 25.4x | 32.0x |
| P/B | 6.55x | 4.45x |
| Current Ratio | 1.19 | 1.06 |
| Quick Ratio | 0.71 | 0.67 |
| D/E (Debt to Equity) | 0.69 | 0.21 |
| Debt-to-Assets | 32.2% | 14.2% |
| Interest Coverage | 9.93x | 23.8x |
| Asset Turnover | 0.67 | 0.46 |
| Fixed Asset Turnover | 6.76 | 6.56 |
| Payout Ratio | 24.4% | 19.3% |
| Dividend Yield | 0.96% | 0.60% |
| Fiscal Year | 2025 | 2025 |
Efficiency & Valuation Duel: The Vital Signs
Ratios serve as a company’s DNA, exposing hidden risks and operational strengths crucial for assessing investment quality.
Parker-Hannifin Corporation
Parker-Hannifin demonstrates strong profitability with a 25.8% ROE and a robust 17.8% net margin, signaling operational excellence. Despite this, its valuation appears stretched, with a P/E of 25.4 and a P/B of 6.55, both unfavorable. Shareholder returns lean on modest dividends (0.96% yield), reflecting a cautious reinvestment in growth and R&D.
AMETEK, Inc.
AMETEK posts a solid 20.0% net margin but a more moderate 13.9% ROE, indicating efficient but less aggressive profitability. The company’s valuation is more expensive, with a P/E of 32.0 and P/B of 4.45, also unfavorable. It maintains shareholder value mainly through low dividends (0.6%) and reinvests heavily in innovation to sustain growth.
Operational Strength vs. Valuation Stretch
Parker-Hannifin offers superior profitability and a slightly better balance of operational efficiency against valuation risk than AMETEK. Investors favoring stronger returns and moderate risk may prefer Parker-Hannifin’s profile. AMETEK suits those prioritizing growth potential despite a higher valuation premium.
Which one offers the Superior Shareholder Reward?
I see Parker-Hannifin (PH) delivers a 0.96% dividend yield with a prudent 24% payout ratio and strong free cash flow coverage at 88%. Its buybacks are consistent, enhancing total return sustainably. AMETEK (AME) pays a lower 0.6% yield with an 19% payout ratio but lacks recent free cash flow data, raising sustainability concerns. AMETEK’s buybacks seem less visible, limiting total return upside. I conclude PH offers a superior shareholder reward in 2026 due to balanced dividends, reliable cash flow, and sustained buybacks supporting long-term value.
Comparative Score Analysis: The Strategic Profile
The radar chart reveals the fundamental DNA and trade-offs of Parker-Hannifin Corporation and AMETEK, Inc.:
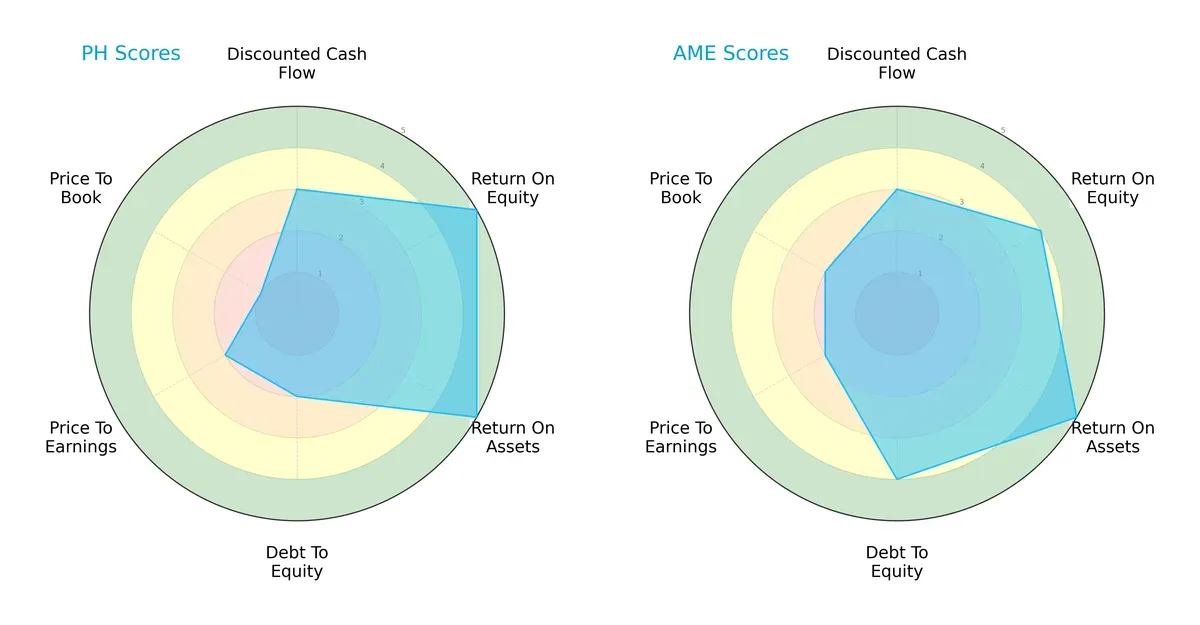
Parker-Hannifin excels in profitability with top ROE and ROA scores (5 each) but shows weakness in valuation, particularly in price-to-book (score 1). AMETEK offers a more balanced profile, scoring well in debt-to-equity (4) and maintaining solid returns. AMETEK’s moderate DCF and valuation scores suggest a stable, less risky investment compared to Parker-Hannifin’s concentrated strengths.
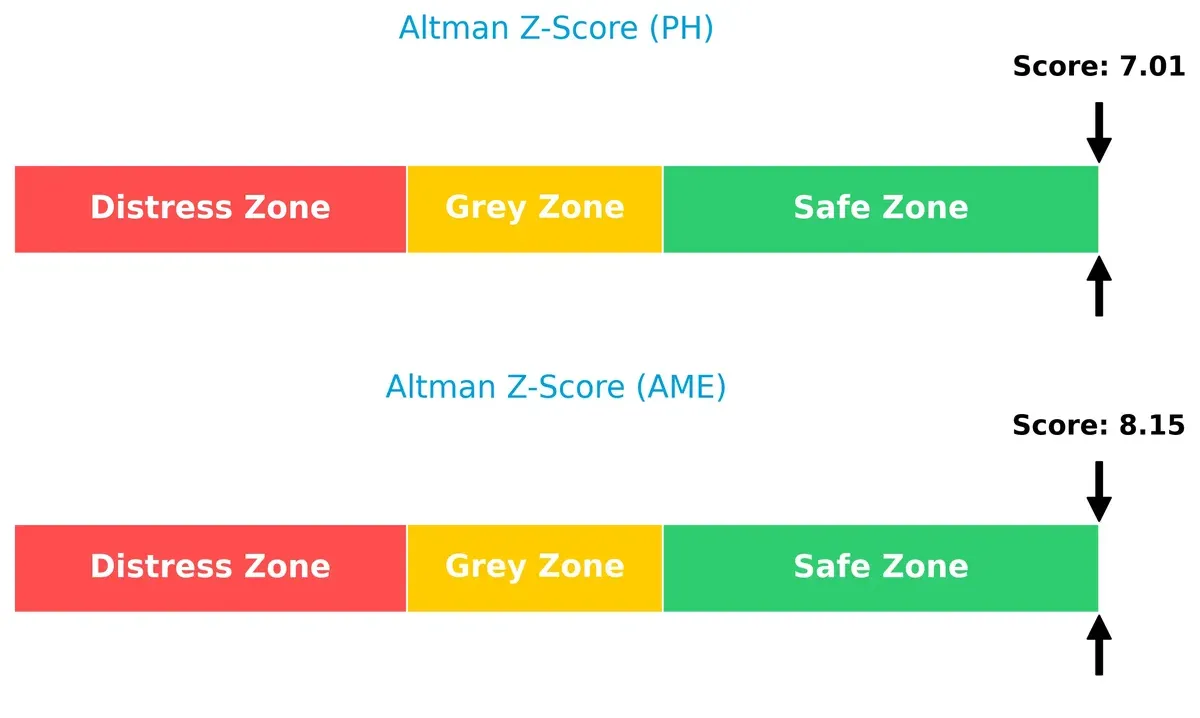
Bankruptcy Risk: Solvency Showdown
AMETEK and Parker-Hannifin both sit comfortably in the safe zone on Altman Z-Score, with scores of 8.15 and 7.01 respectively, signaling strong long-term survival potential in this cycle:
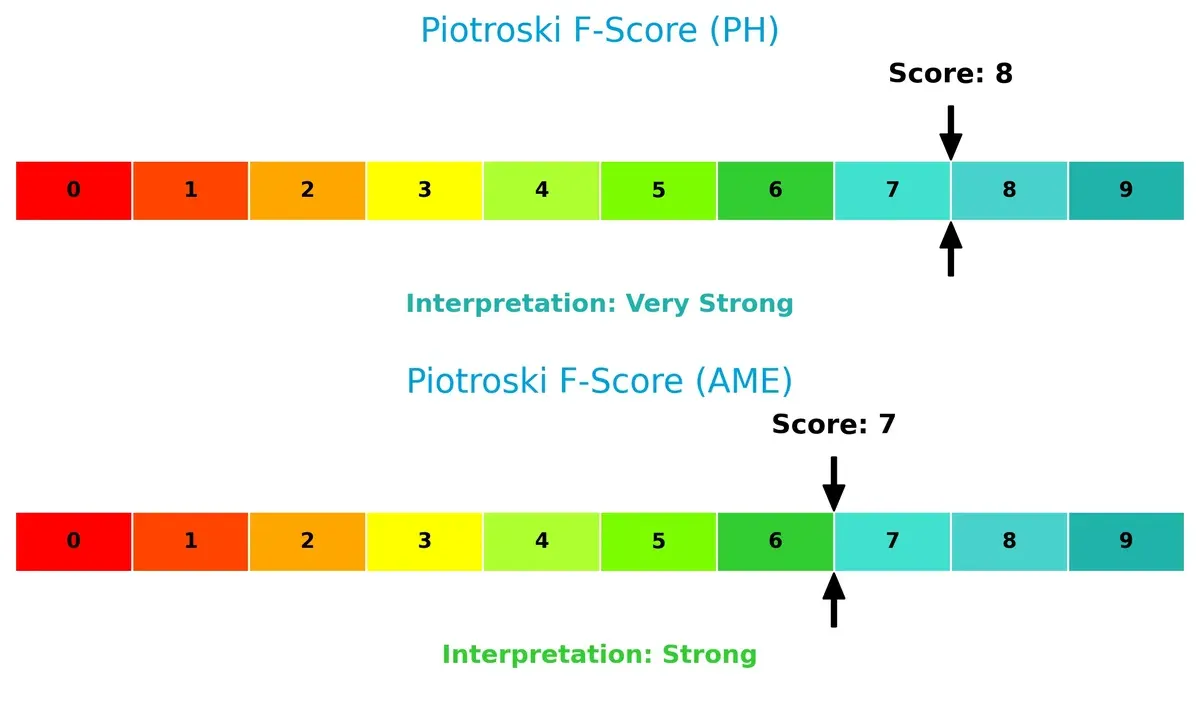
Financial Health: Quality of Operations
Parker-Hannifin leads with a very strong Piotroski F-Score of 8, indicating superior internal financial health. AMETEK’s strong score of 7 is solid but suggests slightly less operational efficiency and financial quality:
How are the two companies positioned?
This section dissects PH and AME’s operational DNA by comparing revenue distribution and internal dynamics. The goal is to confront their economic moats and identify which model delivers the most resilient competitive advantage today.
Revenue Segmentation: The Strategic Mix
This visual comparison dissects how Parker-Hannifin and AMETEK diversify their income streams and where their primary sector bets lie:
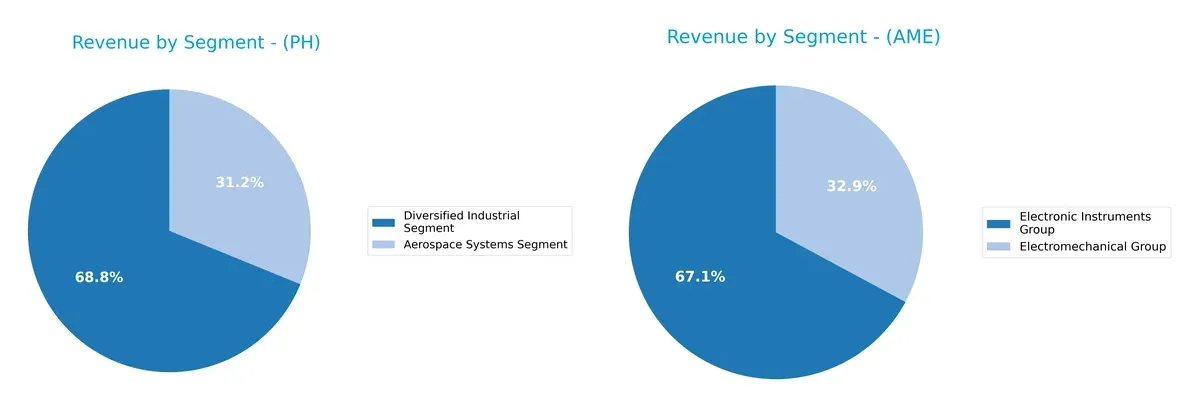
Parker-Hannifin anchors its revenue with a dominant $13.7B Diversified Industrial segment and a strong $6.2B Aerospace Systems segment, showing moderate diversification. AMETEK presents a more balanced mix with $4.7B from Electronic Instruments and $2.3B from Electromechanical Group. Parker-Hannifin’s concentration in industrial systems suggests infrastructure dominance but exposes it to sector cyclicality. AMETEK’s split reduces concentration risk and signals a broader market reach.
Strengths and Weaknesses Comparison
This table compares the strengths and weaknesses of Parker-Hannifin Corporation and AMETEK, Inc.:
PH Strengths
- Diverse industrial and aerospace segments
- Solid net margin of 17.79%
- High ROE at 25.81%
- ROIC exceeds WACC at 13.69%
- Strong interest coverage of 11.04
- High fixed asset turnover at 6.76
- Broad global footprint across North America, Europe, Asia Pacific
AME Strengths
- Favorable net margin at 20%
- ROIC at 11.04% above WACC
- Very strong interest coverage of 23.13
- Low debt-to-equity at 0.21
- Low debt-to-assets at 14.21%
- Solid fixed asset turnover at 6.56
- Diverse geographic presence including US, EU, Asia, and others
PH Weaknesses
- Unfavorable P/E of 25.38
- High P/B at 6.55
- Quick ratio below 1 at 0.71
- Dividend yield under 1% at 0.96%
- Moderate current ratio at 1.19
- Neutral debt level at D/E 0.69
- Neutral asset turnover at 0.67
AME Weaknesses
- Unfavorable high P/E of 31.97
- P/B at 4.45 also unfavorable
- Quick ratio low at 0.67
- Dividend yield low at 0.6%
- Asset turnover weak at 0.46
- Higher proportion of unfavorable ratios at 35.71%
Both companies demonstrate slightly favorable financial profiles with notable strengths in profitability and interest coverage. PH’s higher ROE and broader segment diversification contrast with AME’s lower leverage and stronger interest coverage, highlighting different strategic financial structures. Each faces valuation and liquidity challenges that require prudent risk management.
The Moat Duel: Analyzing Competitive Defensibility
A structural moat shields long-term profits from relentless competitive pressures and market erosion. Let’s dissect how Parker-Hannifin and AMETEK defend their turf:
Parker-Hannifin Corporation: Engineering a Cost and Intangible Asset Fortress
Parker-Hannifin leverages complex motion control tech and deep OEM relationships as its moat. The firm sustains a high ROIC at 4.4% above WACC and margin stability, signaling efficient capital use. Expansion in aerospace and industrial segments in 2026 may deepen this advantage but requires vigilance against tech disruption.
AMETEK, Inc.: Precision Instruments with a Network Effect Moat
AMETEK’s moat stems from specialized electronic instrumentation and a broad customer network. Its ROIC stands 2.5% above WACC with growing profitability, albeit lower than Parker-Hannifin. The company’s diverse end markets offer expansion potential, though rising OPEX growth warrants close monitoring.
Cost and Intangible Assets vs. Network Effects: The Industrial Moat Battle
Parker-Hannifin commands a wider moat with stronger capital efficiency and margin growth. AMETEK maintains a robust but narrower competitive edge reliant on niche instrumentation. Parker-Hannifin is better positioned to defend market share amid evolving industrial demands.
Which stock offers better returns?
Over the past 12 months, both Parker-Hannifin Corporation and AMETEK, Inc. delivered bullish trends with accelerating price gains, reflecting strong upward momentum and buyer dominance in trading activity.
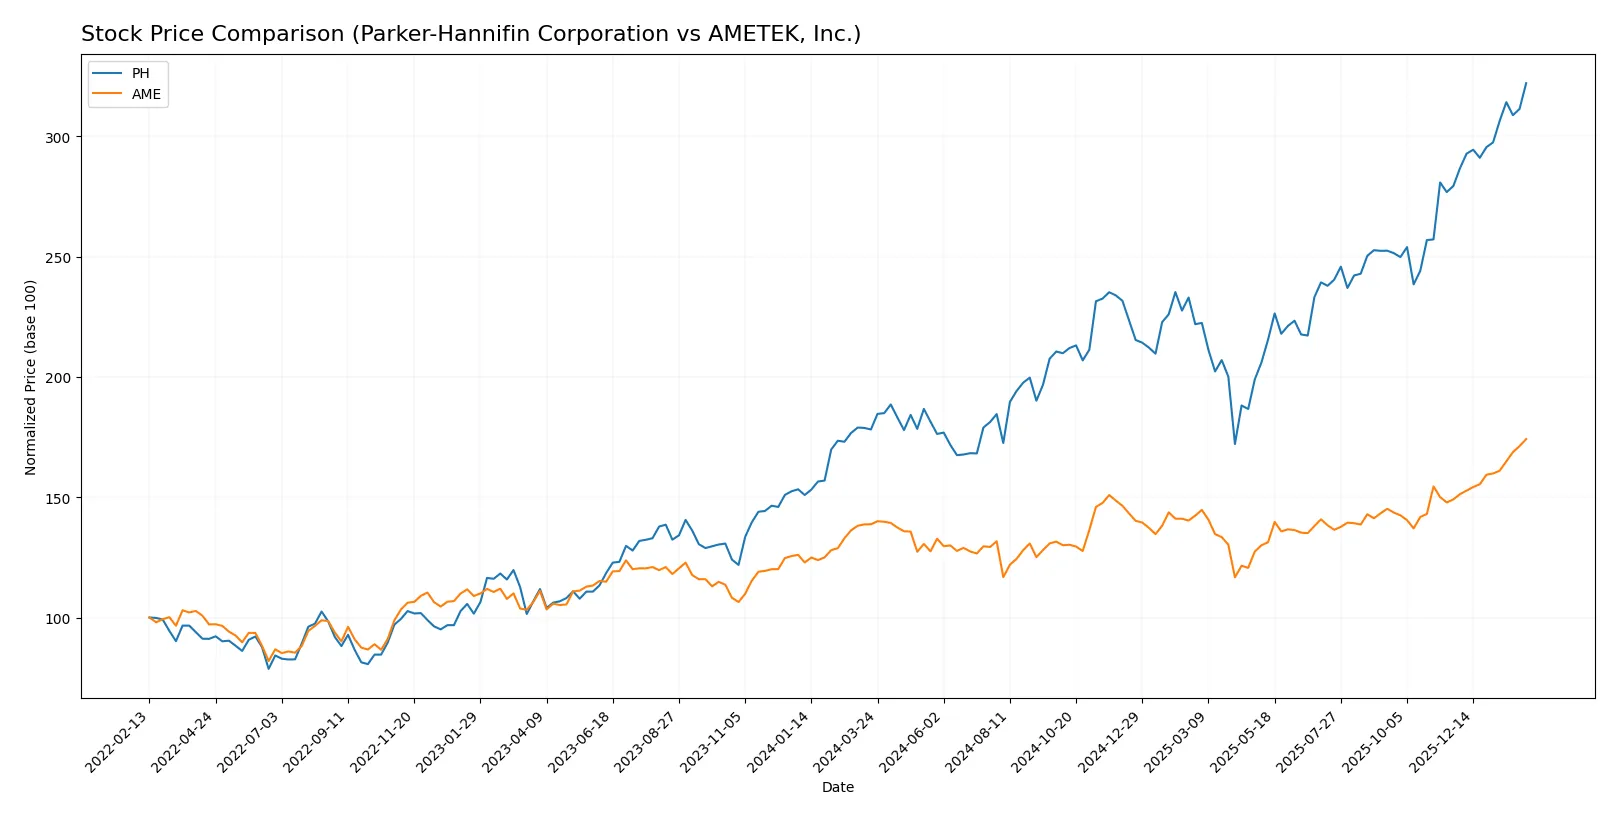
Trend Comparison
Parker-Hannifin’s stock surged 80.79% over the past year, showing acceleration and high volatility with prices ranging from 503.3 to 967.99. This signals strong bullish momentum.
AMETEK’s stock rose 25.51% over the same period, also accelerating but with lower volatility and prices between 152.66 and 227.83, indicating a steadier bullish trend.
Parker-Hannifin outperformed AMETEK with a significantly higher total return and stronger price acceleration over the past year.
Target Prices
Analysts present a bullish consensus for Parker-Hannifin Corporation and AMETEK, Inc., signaling upside potential from current prices.
| Company | Target Low | Target High | Consensus |
|---|---|---|---|
| Parker-Hannifin Corporation | 825 | 1139 | 995.46 |
| AMETEK, Inc. | 204 | 271 | 237.91 |
The consensus target for Parker-Hannifin stands about 3% above its $968 current price, reflecting modest upside. AMETEK’s consensus target exceeds its $228 price by nearly 5%, suggesting positive analyst expectations.

Don’t Let Luck Decide Your Entry Point
Optimize your entry points with our advanced ProRealTime indicators. You’ll get efficient buy signals with precise price targets for maximum performance. Start outperforming now!
How do institutions grade them?
Parker-Hannifin Corporation Grades
The following table lists recent grades from reputable institutions for Parker-Hannifin:
| Grading Company | Action | New Grade | Date |
|---|---|---|---|
| Jefferies | Maintain | Buy | 2026-01-30 |
| Barclays | Maintain | Overweight | 2026-01-30 |
| Stifel | Maintain | Hold | 2026-01-30 |
| JP Morgan | Maintain | Overweight | 2026-01-30 |
| Wells Fargo | Maintain | Overweight | 2026-01-30 |
| Citigroup | Maintain | Buy | 2026-01-30 |
| Stifel | Maintain | Hold | 2026-01-23 |
| JP Morgan | Maintain | Overweight | 2026-01-16 |
| Morgan Stanley | Maintain | Equal Weight | 2026-01-14 |
| Barclays | Maintain | Overweight | 2026-01-07 |
AMETEK, Inc. Grades
The following table lists recent grades from reputable institutions for AMETEK:
| Grading Company | Action | New Grade | Date |
|---|---|---|---|
| Keybanc | Maintain | Overweight | 2026-02-04 |
| DA Davidson | Maintain | Buy | 2026-02-04 |
| Barclays | Maintain | Equal Weight | 2026-02-04 |
| Oppenheimer | Downgrade | Perform | 2026-01-27 |
| Morgan Stanley | Maintain | Equal Weight | 2026-01-12 |
| Barclays | Maintain | Equal Weight | 2026-01-07 |
| Keybanc | Maintain | Overweight | 2026-01-07 |
| Keybanc | Maintain | Overweight | 2026-01-06 |
| Mizuho | Maintain | Outperform | 2026-01-05 |
| TD Cowen | Upgrade | Buy | 2025-12-23 |
Which company has the best grades?
Parker-Hannifin consistently receives Buy and Overweight grades, signaling strong institutional confidence. AMETEK’s ratings are more mixed, with multiple Equal Weight grades and a recent downgrade. Investors may view Parker-Hannifin’s steadier grades as a signal of relative stability.
Risks specific to each company
The 2026 market environment exposes Parker-Hannifin Corporation and AMETEK, Inc. to critical pressure points and systemic threats across seven key risk categories:
1. Market & Competition
Parker-Hannifin Corporation
- Faces intense competition in diversified industrial and aerospace segments, with premium pricing challenges reflected in a high P/E of 25.38.
AMETEK, Inc.
- Operates in specialized electronic instruments and electromechanical devices, with higher P/E at 31.97, indicating market premium but possible overvaluation risk.
2. Capital Structure & Debt
Parker-Hannifin Corporation
- Moderate debt levels (D/E 0.69) with solid interest coverage of 11.04, yet debt-to-assets at 32.16% signals cautious leverage use.
AMETEK, Inc.
- Strong balance sheet with low debt (D/E 0.21), excellent interest coverage of 23.13, and conservative 14.21% debt-to-assets ratio.
3. Stock Volatility
Parker-Hannifin Corporation
- Higher beta at 1.242 suggests increased sensitivity to market swings and higher volatility risk.
AMETEK, Inc.
- Lower beta of 1.036 indicates more stable stock price behavior amid market fluctuations.
4. Regulatory & Legal
Parker-Hannifin Corporation
- Aerospace and industrial sectors face strict regulatory scrutiny, potentially raising compliance costs and operational risks.
AMETEK, Inc.
- Electronic instruments and electromechanical markets also encounter regulatory complexity but benefit from diversified end markets reducing concentrated exposure.
5. Supply Chain & Operations
Parker-Hannifin Corporation
- Global operations in aerospace and industrial machinery expose it to raw material price risks and supply chain disruptions.
AMETEK, Inc.
- Diverse product lines in electronics and precision components may mitigate some supply chain risks but remain vulnerable to semiconductor and specialized material shortages.
6. ESG & Climate Transition
Parker-Hannifin Corporation
- Increasing pressure to reduce carbon footprint in industrial and aerospace systems; ESG compliance costs could rise.
AMETEK, Inc.
- Faces ESG challenges in energy consumption and product lifecycle management, but diversified industrial exposure helps spread risk.
7. Geopolitical Exposure
Parker-Hannifin Corporation
- Aerospace segment’s reliance on military contracts and global supply chains elevates geopolitical risk amid rising tensions.
AMETEK, Inc.
- Global electronic instruments market exposure creates geopolitical uncertainties but less concentrated military dependence.
Which company shows a better risk-adjusted profile?
Parker-Hannifin’s key risk lies in its market valuation and elevated stock volatility, while AMETEK’s greatest strength is a conservative capital structure with low leverage. AMETEK’s lower beta and stronger balance sheet point to a superior risk-adjusted profile. Notably, AMETEK’s interest coverage ratio more than doubles Parker-Hannifin’s, underscoring financial resilience amidst economic cycles.
Final Verdict: Which stock to choose?
Parker-Hannifin’s superpower lies in its exceptional efficiency and expanding profitability, signaled by a robust return on equity and a growing economic moat. Its point of vigilance is a relatively high price-to-book ratio, which may temper valuation appeal. It suits aggressive growth portfolios ready to embrace premium industrial innovators.
AMETEK stands out with a strong strategic moat anchored in conservative debt management and consistent free cash flow generation, offering a safer harbor than Parker-Hannifin. Its lower leverage and steady income growth make it appealing for GARP investors who value stability with moderate upside potential.
If you prioritize aggressive growth backed by expanding profitability and operational efficiency, Parker-Hannifin is the compelling choice due to its superior ROE and a widening moat. However, if you seek a more balanced risk profile with steady cash flow and lower leverage, AMETEK offers better stability and a resilient capital structure. Both are solid, but your risk tolerance defines the optimal fit.
Disclaimer: Investment carries a risk of loss of initial capital. The past performance is not a reliable indicator of future results. Be sure to understand risks before making an investment decision.
Go Further
I encourage you to read the complete analyses of Parker-Hannifin Corporation and AMETEK, Inc. to enhance your investment decisions: