Home > Comparison > Industrials > AME vs OTIS
The strategic rivalry between AMETEK, Inc. and Otis Worldwide Corporation shapes the industrial machinery sector’s future. AMETEK excels as a diversified electronic instruments and electromechanical devices manufacturer. Otis dominates as a leading elevator and escalator systems provider with extensive global service operations. This analysis contrasts their capital allocation and growth models to identify which offers superior risk-adjusted returns for a balanced portfolio navigating industrial market cycles.
Table of contents
Companies Overview
AMETEK, Inc. and Otis Worldwide Corporation are influential players in the industrial machinery sector, each commanding significant market presence.
AMETEK, Inc.: Precision Instruments and Electromechanical Innovator
AMETEK stands as a leader in electronic instruments and electromechanical devices, generating revenue primarily through two segments: Electronic Instruments and Electromechanical. Its latest strategic focus emphasizes advanced instrumentation for aerospace, industrial, and process markets, underpinned by a broad product portfolio that spans from power supplies to sensors and motion control products.
Otis Worldwide Corporation: Elevator and Escalator Specialist
Otis dominates the global elevator and escalator market, earning revenues from new equipment sales and comprehensive service contracts. The company’s 2026 strategy revolves around expanding its extensive service network with 34,000 mechanics and modernizing existing installations, reinforcing its competitive edge in maintenance and modernization services worldwide.
Strategic Collision: Similarities & Divergences
Both companies operate in industrial machinery but diverge in business models; AMETEK delivers diversified instruments and components, while Otis focuses on vertical mobility solutions. They compete on innovation and service quality, with Otis emphasizing customer retention through maintenance, contrasting AMETEK’s technology-driven product breadth. Their investment profiles differ sharply—Otis offers steady service revenues, whereas AMETEK bets on technological diversification and market penetration.
Income Statement Comparison
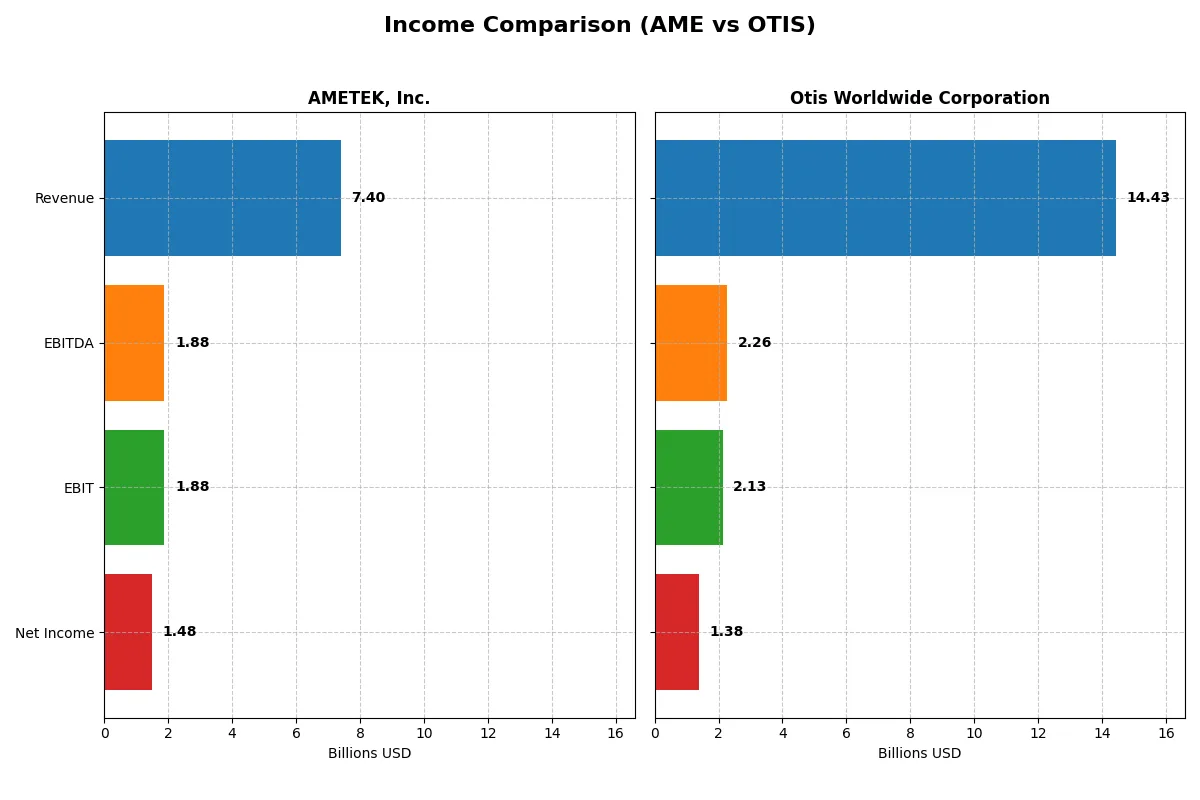
This data dissects the core profitability and scalability of both corporate engines to reveal who dominates the bottom line:
| Metric | AMETEK, Inc. (AME) | Otis Worldwide Corporation (OTIS) |
|---|---|---|
| Revenue | 7.4B | 14.4B |
| Cost of Revenue | 4.7B | 10.0B |
| Operating Expenses | 757M | 2.2B |
| Gross Profit | 2.7B | 4.4B |
| EBITDA | 1.9B | 2.3B |
| EBIT | 1.9B | 2.1B |
| Interest Expense | 81M | 196M |
| Net Income | 1.5B | 1.4B |
| EPS | 6.42 | 3.53 |
| Fiscal Year | 2025 | 2025 |
Income Statement Analysis: The Bottom-Line Duel
This income statement comparison reveals which company runs a more efficient and profitable business engine through recent fiscal years.
AMETEK, Inc. Analysis
AMETEK’s revenue grew steadily from 5.5B in 2021 to 7.4B in 2025, with net income rising from 990M to 1.48B. Its gross margin remains strong around 36%, while net margin hovers at a healthy 20% in 2025. The company shows solid momentum with EBIT and EPS growth above 5%, signaling effective cost control and expanding profitability.
Otis Worldwide Corporation Analysis
Otis’s revenue plateaued near 14.3B from 2021 to 2025, with net income growing moderately from 1.25B to 1.38B. Gross margin sits at a respectable 30%, but net margin is weaker at 9.6% in 2025. Recent EPS and net margin declined, indicating margin pressure despite stable top-line performance, reflecting challenges in balancing operating costs and interest expenses.
Margin Efficiency vs. Revenue Scale
AMETEK outpaces Otis in margin efficiency and profit growth, boasting higher net and EBIT margins with consistent EPS expansion. Otis delivers scale but struggles to convert revenue into proportionate net income gains. For investors, AMETEK’s profile suggests superior operational leverage and bottom-line discipline, while Otis reflects a larger but less margin-resilient business.
Financial Ratios Comparison
These vital ratios act as a diagnostic tool to expose the underlying fiscal health, valuation premiums, and capital efficiency of the companies compared below:
| Ratios | AMETEK, Inc. (AME) | Otis Worldwide Corporation (OTIS) |
|---|---|---|
| ROE | 14.0% | -25.7% |
| ROIC | 11.0% | 40.7% |
| P/E | 32.0 | 24.8 |
| P/B | 4.45 | -6.38 |
| Current Ratio | 1.06 | 0.85 |
| Quick Ratio | 0.67 | 0.77 |
| D/E (Debt-to-Equity) | 0.21 | -1.62 |
| Debt-to-Assets | 14.2% | 82.1% |
| Interest Coverage | 23.8 | 11.2 |
| Asset Turnover | 0.46 | 1.35 |
| Fixed Asset Turnover | 6.56 | 11.13 |
| Payout Ratio | 19.3% | 46.7% |
| Dividend Yield | 0.60% | 1.88% |
| Fiscal Year | 2025 | 2025 |
Efficiency & Valuation Duel: The Vital Signs
Financial ratios act as a company’s DNA, unveiling hidden risks and operational strengths that drive long-term shareholder value.
AMETEK, Inc.
AMETEK posts a solid 13.93% ROE and a strong 20% net margin, signaling efficient profitability. However, its P/E of 31.97 suggests a stretched valuation compared to sector norms. The company offers a modest 0.6% dividend yield, indicating limited shareholder payouts while likely reinvesting in growth and innovation.
Otis Worldwide Corporation
Otis shows a striking 40.74% ROIC, demonstrating efficient capital use, but suffers a negative ROE of -25.67%, reflecting profitability challenges. Its P/E of 24.85 appears fair, with a neutral dividend yield of 1.88%. Otis balances returns with cautious reinvestment amid operational headwinds and high leverage.
Valuation Stretch vs. Capital Efficiency: A Clear Trade-Off
AMETEK’s stable profitability faces premium valuation risks, while Otis delivers superior capital efficiency but struggles with profitability and leverage. Investors seeking steady returns might favor AMETEK’s consistency, whereas those comfortable with operational volatility may consider Otis’s growth potential.
Which one offers the Superior Shareholder Reward?
I see that AMETEK, Inc. (AME) maintains a modest dividend yield around 0.6% with a disciplined payout ratio near 19%, supported by strong free cash flow coverage above 90%. Its buyback program is steady and complements dividends, enhancing total shareholder return sustainably. Otis Worldwide Corporation (OTIS), by contrast, offers a higher dividend yield near 1.8%, but pays out nearly 40-47% of earnings as dividends, exerting pressure on cash flow sustainability. Otis’s heavy leverage and volatile working capital metrics raise red flags about long-term payout reliability. While Otis’s yield attracts income-focused investors, AMETEK’s balanced dividends and consistent buybacks present a more sustainable, total reward profile for 2026 investors. I favor AMETEK for superior shareholder value durability.
Comparative Score Analysis: The Strategic Profile
The radar chart reveals the fundamental DNA and trade-offs of AMETEK, Inc. and Otis Worldwide Corporation, highlighting their financial strengths and weaknesses:
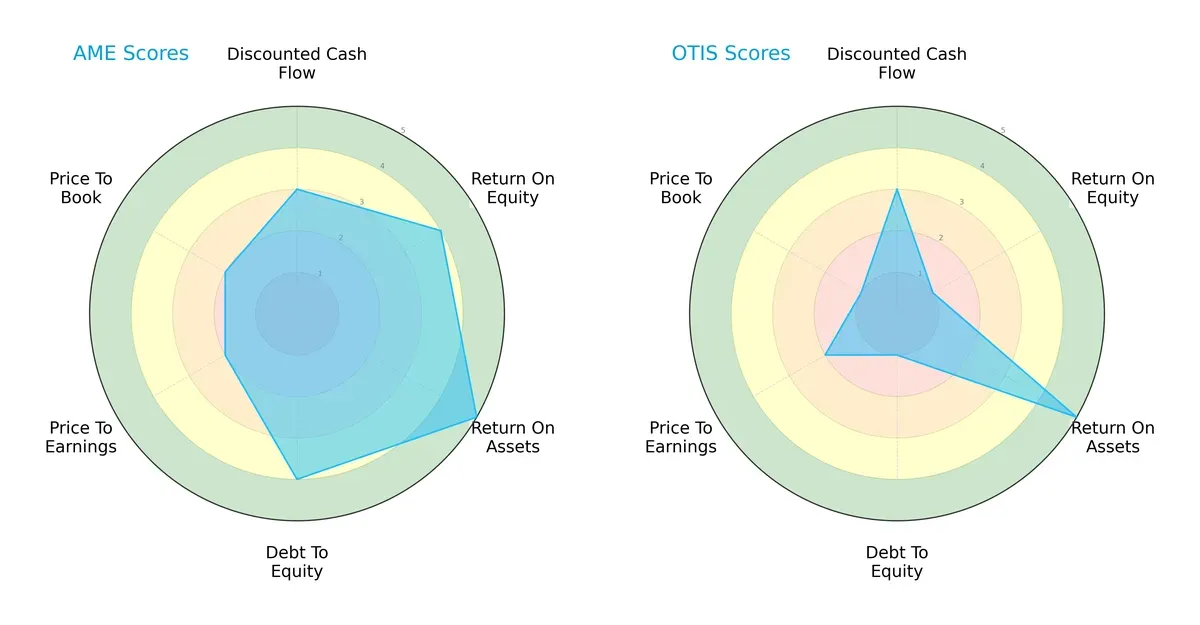
AMETEK displays a balanced profile with strong ROE (4) and ROA (5), alongside a solid debt-to-equity score (4), signaling efficient capital use and controlled leverage. Otis matches AMETEK’s asset efficiency (ROA 5) but lags significantly in ROE (1) and debt management (1), indicating weaker profitability and higher financial risk. Both firms show moderate valuation scores, but AMETEK’s overall higher scores reflect a more stable and diversified advantage.
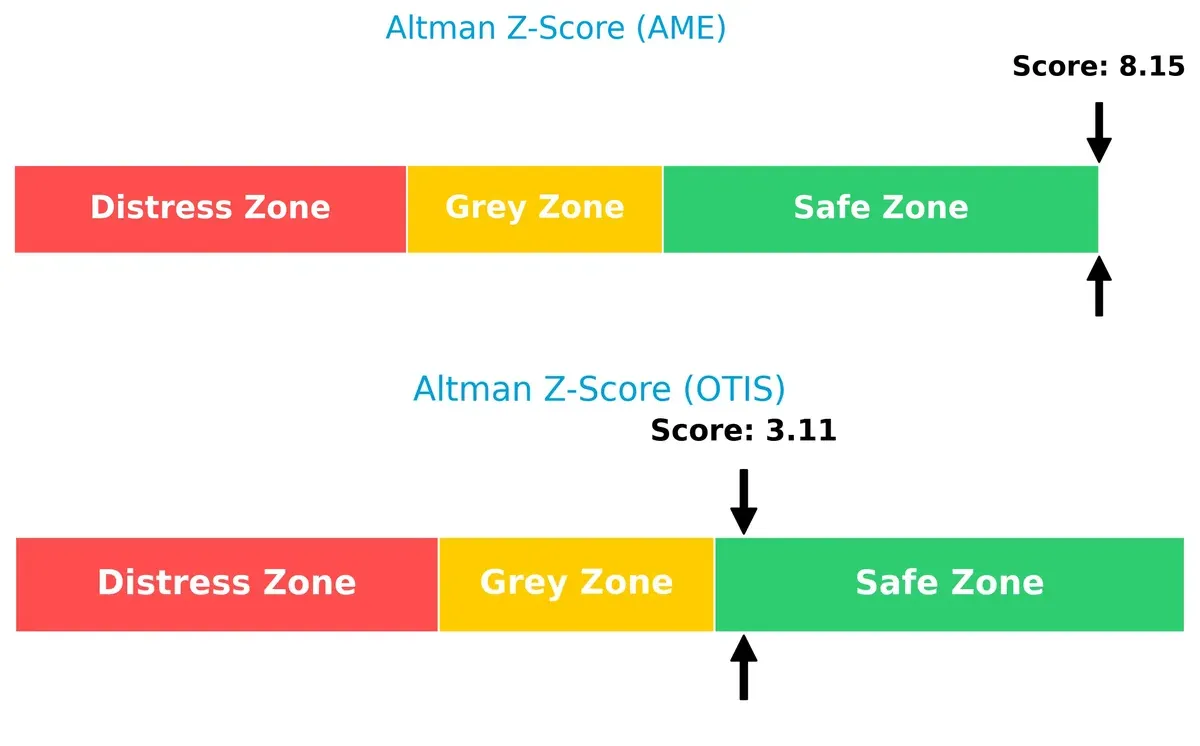
Bankruptcy Risk: Solvency Showdown
AMETEK’s Altman Z-Score of 8.1 far exceeds Otis’s 3.1, confirming AMETEK’s robust financial health and very low bankruptcy risk in this cycle:
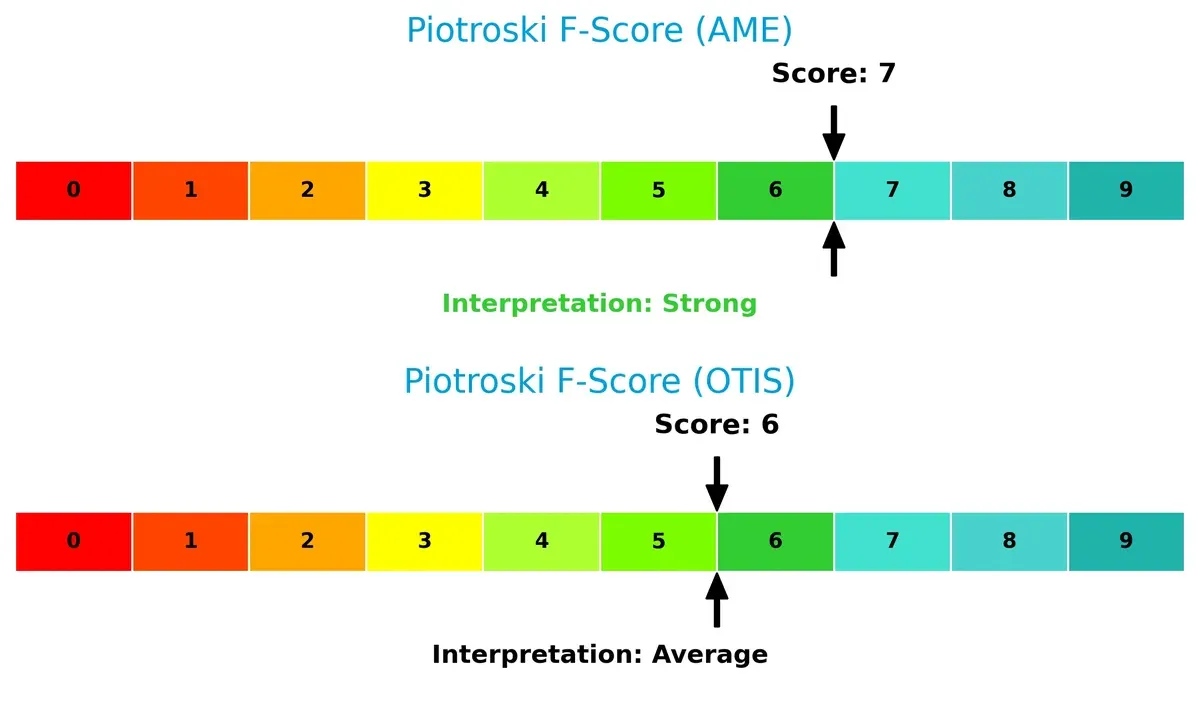
Financial Health: Quality of Operations
AMETEK’s Piotroski F-Score of 7 outperforms Otis’s 6, suggesting stronger internal financial metrics and operational quality. Otis’s lower score flags potential concerns in profitability or efficiency compared to AMETEK:
How are the two companies positioned?
This section dissects AMETEK and Otis by comparing their revenue distribution and internal strengths and weaknesses. The goal is to confront their economic moats to identify which model offers a more resilient, sustainable advantage today.
Revenue Segmentation: The Strategic Mix
This visual comparison dissects how AMETEK, Inc. and Otis Worldwide Corporation diversify their income streams and where their primary sector bets lie:
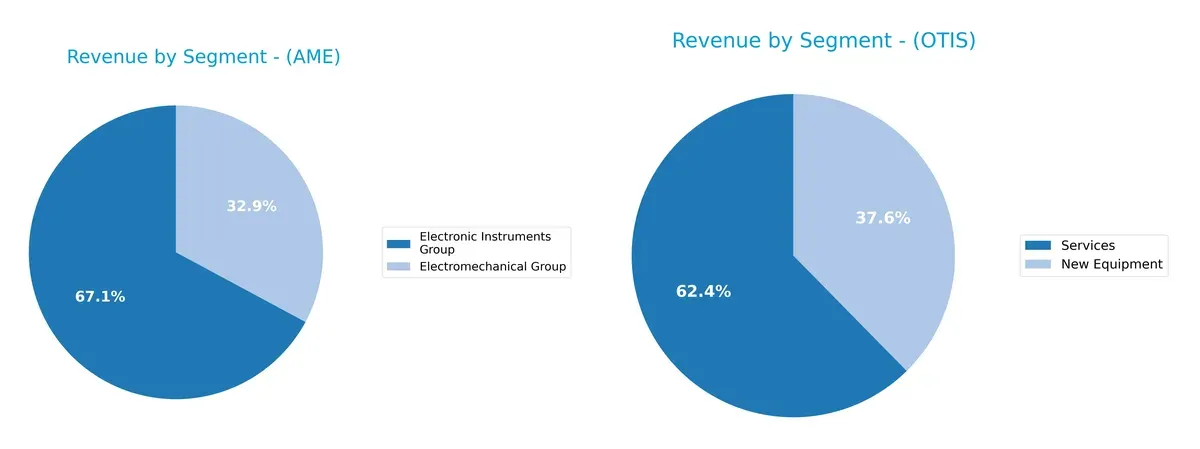
AMETEK’s revenue pivots between its Electromechanical Group ($2.28B) and Electronic Instruments Group ($4.66B) in 2024, showing a balanced but Electronics-heavy mix. Otis leans on Services ($8.89B), dwarfing New Equipment ($5.37B), anchoring its strength in recurring maintenance. AMETEK’s diversification reduces concentration risk, while Otis’s service dominance locks in infrastructure dependency, ensuring steady cash flow but exposing it to sector-specific cycles.
Strengths and Weaknesses Comparison
This table compares the Strengths and Weaknesses of AMETEK, Inc. and Otis Worldwide Corporation:
AMETEK, Inc. Strengths
- Diversified with Electromechanical and Electronic Instruments segments
- Strong net margin at 20%
- Favorable ROIC above WACC
- Low debt-to-assets at 14%
- High interest coverage ratio
- Favorable fixed asset turnover
Otis Worldwide Strengths
- High ROIC at 40.74%, well above WACC
- Favorable price-to-book ratio
- Strong asset turnover ratio
- Good interest coverage
- Solid global sales with large US and China presence
- Balanced revenue from new equipment and services
AMETEK, Inc. Weaknesses
- Unfavorable PE and PB ratios may imply overvaluation
- Low quick ratio at 0.67 signals liquidity risk
- Asset turnover is low at 0.46
- Dividend yield is weak at 0.6%
- Neutral current ratio limits short-term flexibility
Otis Worldwide Weaknesses
- Negative ROE at -25.67% signals poor profitability
- High debt-to-assets ratio at 82% raises solvency concerns
- Current and quick ratios below 1 suggest liquidity issues
- Negative debt-to-equity ratio indicates financial complexity
- Dividend yield only neutral at 1.88%
Both companies show slightly favorable overall financial profiles but differ in capital structure and profitability measures. AMETEK balances moderate leverage with strong margins, while Otis exhibits exceptional returns on invested capital but struggles with profitability and high leverage, influencing their strategic financial priorities.
The Moat Duel: Analyzing Competitive Defensibility
A structural moat is the only shield protecting long-term profits from relentless competitive pressures. Let’s dissect this crucial battleground:
AMETEK, Inc.: Diversified Engineering Moat
AMETEK’s moat stems from its intangible assets and specialized engineering across aerospace and industrial markets. Its 25.4% EBIT margin and 2.5% ROIC premium over WACC confirm strong capital efficiency. New product launches and geographic expansion in Asia could deepen this advantage in 2026.
Otis Worldwide Corporation: Service Network Lock-in
Otis leverages an extensive service network with 34K mechanics, creating switching costs unmatched by AMETEK’s product diversity. Its 14.8% EBIT margin and an impressive 33.3% ROIC premium over WACC signal a robust, growing moat. Continued modernization services offer growth in emerging urban markets.
Network Scale vs. Engineering Breadth: Which Moat Runs Deeper?
Otis’s superior ROIC premium and accelerating profitability reveal a deeper moat anchored in service lock-in. AMETEK’s diversified engineering moat is wide but faces fiercer technological competition. Otis stands better poised to defend market share amid evolving customer demands.
Which stock offers better returns?
The past year shows AMETEK’s stock rising sharply by 25.5%, while Otis Worldwide’s price dropped 8.3%, highlighting contrasting momentum and investor sentiment.
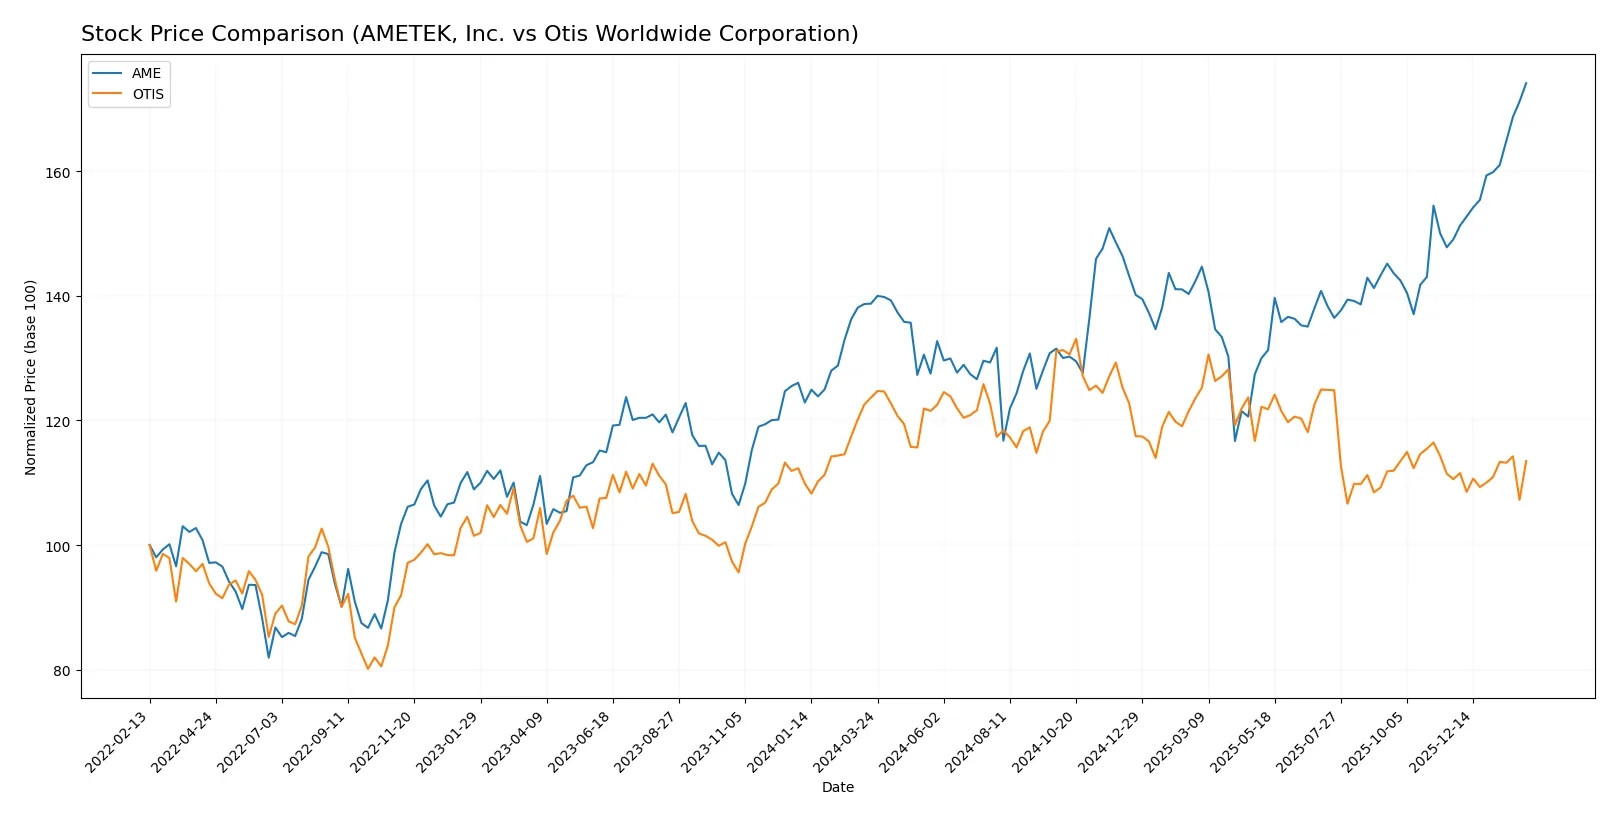
Trend Comparison
AMETEK, Inc. exhibits a bullish trend with a 25.5% gain over 12 months, accelerating upward amid a volatile 14.4% deviation and hitting a high of 227.83. Otis Worldwide Corporation’s stock fell 8.3% in the same period, showing a bearish acceleration with lower volatility at 4.9% and a peak price of 106.01. AMETEK’s strong 25.5% gain outperforms Otis’s 8.3% decline, delivering the higher market return over the year.
Target Prices
Analysts show a positive outlook for AMETEK, Inc. and Otis Worldwide Corporation with well-defined price targets.
| Company | Target Low | Target High | Consensus |
|---|---|---|---|
| AMETEK, Inc. | 204 | 271 | 237.91 |
| Otis Worldwide Corporation | 92 | 109 | 97.75 |
The consensus targets for AMETEK and Otis suggest upside potential compared to current prices of $227.83 and $90.37, respectively. Analysts expect moderate gains, reflecting confidence in their industrial machinery market positions.

Don’t Let Luck Decide Your Entry Point
Optimize your entry points with our advanced ProRealTime indicators. You’ll get efficient buy signals with precise price targets for maximum performance. Start outperforming now!
How do institutions grade them?
AMETEK, Inc. Grades
The following table summarizes recent grades assigned to AMETEK, Inc. by notable institutions.
| Grading Company | Action | New Grade | Date |
|---|---|---|---|
| Keybanc | Maintain | Overweight | 2026-02-04 |
| DA Davidson | Maintain | Buy | 2026-02-04 |
| Barclays | Maintain | Equal Weight | 2026-02-04 |
| Oppenheimer | Downgrade | Perform | 2026-01-27 |
| Morgan Stanley | Maintain | Equal Weight | 2026-01-12 |
| Barclays | Maintain | Equal Weight | 2026-01-07 |
| Keybanc | Maintain | Overweight | 2026-01-07 |
| Keybanc | Maintain | Overweight | 2026-01-06 |
| Mizuho | Maintain | Outperform | 2026-01-05 |
| TD Cowen | Upgrade | Buy | 2025-12-23 |
Otis Worldwide Corporation Grades
Below are recent institutional grades for Otis Worldwide Corporation.
| Grading Company | Action | New Grade | Date |
|---|---|---|---|
| JP Morgan | Maintain | Overweight | 2026-01-16 |
| Wells Fargo | Maintain | Equal Weight | 2025-12-15 |
| Barclays | Maintain | Underweight | 2025-10-30 |
| JP Morgan | Maintain | Overweight | 2025-10-15 |
| Wolfe Research | Upgrade | Outperform | 2025-10-08 |
| Wells Fargo | Maintain | Equal Weight | 2025-10-06 |
| JP Morgan | Maintain | Overweight | 2025-09-18 |
| RBC Capital | Maintain | Outperform | 2025-07-28 |
| Wolfe Research | Upgrade | Peer Perform | 2025-07-25 |
| JP Morgan | Maintain | Overweight | 2025-07-24 |
Which company has the best grades?
AMETEK, Inc. holds a mix of “Buy” and “Overweight” ratings with some “Equal Weight,” reflecting cautious optimism. Otis Worldwide shows a strong “Overweight” and “Outperform” presence but also includes an “Underweight” rating. Investors might see AMETEK’s grades as slightly more consistent in the buy range, potentially suggesting steadier institutional confidence.
Risks specific to each company
The following categories identify the critical pressure points and systemic threats facing AMETEK, Inc. and Otis Worldwide Corporation in the 2026 market environment:
1. Market & Competition
AMETEK, Inc.
- Operates in diverse industrial segments with steady demand but faces intense competition in electronic instruments.
Otis Worldwide Corporation
- Dominates elevator and escalator markets but contends with modernization pressures and infrastructure spending variability.
2. Capital Structure & Debt
AMETEK, Inc.
- Maintains a low debt-to-equity ratio (0.21), signaling financial stability and prudent leverage.
Otis Worldwide Corporation
- Exhibits very high debt-to-assets ratio (82.14%), indicating elevated financial risk and leverage concerns.
3. Stock Volatility
AMETEK, Inc.
- Beta of 1.036 reflects moderate sensitivity to market swings, aligning with sector norms.
Otis Worldwide Corporation
- Beta of 1.012 shows similar volatility, but recent price range is tighter, suggesting slightly less fluctuation.
4. Regulatory & Legal
AMETEK, Inc.
- Subject to environmental and safety regulations across multiple sectors, increasing compliance costs.
Otis Worldwide Corporation
- Faces stringent building codes and safety regulations globally, which can delay projects and increase costs.
5. Supply Chain & Operations
AMETEK, Inc.
- Complex global supply chains with exposure to semiconductor and raw materials shortages risk operational disruptions.
Otis Worldwide Corporation
- Large service network (34,000 mechanics) offers resilience but depends heavily on labor availability and regional stability.
6. ESG & Climate Transition
AMETEK, Inc.
- Increasing pressure to reduce emissions in manufacturing and develop sustainable products.
Otis Worldwide Corporation
- Strong focus on energy-efficient elevators supports ESG goals, but transition costs remain substantial.
7. Geopolitical Exposure
AMETEK, Inc.
- Global footprint exposes it to trade tensions and tariff risks, particularly in Asia.
Otis Worldwide Corporation
- International operations face geopolitical risks, especially in emerging markets with regulatory unpredictability.
Which company shows a better risk-adjusted profile?
AMETEK’s most impactful risk is moderate liquidity ratios and higher valuation multiples, indicating vulnerability if market conditions tighten. Otis faces critical financial leverage concerns with its high debt load and weak return on equity, amplifying default risk. Despite Otis’s strong asset efficiency, AMETEK’s safer capital structure and Altman Z-Score near 8 demonstrate a superior risk-adjusted profile. The data highlight Otis’s elevated debt-to-assets ratio as a red flag, contrasting with AMETEK’s balanced leverage and stable Altman Z-Score.
Final Verdict: Which stock to choose?
AMETEK, Inc. (AME) stands out for its unmatched operational efficiency and robust value creation. Its very favorable moat, demonstrated by a growing ROIC well above WACC, signals a sustainable competitive advantage. A point of vigilance remains its moderate liquidity ratios, which may pressure short-term flexibility. AME fits well in aggressive growth portfolios seeking strong fundamentals and expansion potential.
Otis Worldwide Corporation (OTIS) commands a strategic moat through high ROIC and capital efficiency, reflecting solid asset utilization and industrial niche dominance. Compared to AME, OTIS carries higher financial leverage and weaker equity returns, suggesting a higher risk profile. Its steadier cash flow and moderate valuation suit GARP portfolios prioritizing stability with growth elements.
If you prioritize operational excellence and sustainable value creation, AME is the compelling choice due to its superior efficiency and growth trajectory. However, if you seek a blend of reasonable growth with defensive qualities, OTIS offers better stability and capital discipline despite its elevated leverage. Each presents distinct risk-reward tradeoffs aligned with differing investor profiles.
Disclaimer: Investment carries a risk of loss of initial capital. The past performance is not a reliable indicator of future results. Be sure to understand risks before making an investment decision.
Go Further
I encourage you to read the complete analyses of AMETEK, Inc. and Otis Worldwide Corporation to enhance your investment decisions: