Home > Comparison > Industrials > AME vs NDSN
The strategic rivalry between AMETEK, Inc. and Nordson Corporation shapes the industrial machinery sector’s evolution. AMETEK operates as a diversified electronic instruments and electromechanical products manufacturer with a broad industrial footprint. In contrast, Nordson focuses on precision dispensing and coating systems, emphasizing niche automation technologies. This analysis pits AMETEK’s scale and diversification against Nordson’s specialized innovation to identify the superior risk-adjusted investment for a balanced portfolio.
Table of contents
Companies Overview
AMETEK and Nordson stand as pivotal players in the industrial machinery sector, shaping global manufacturing standards.
AMETEK, Inc.: Global Industrial Instrumentation Leader
AMETEK dominates the industrial machinery market with its diverse electronic instruments and electromechanical devices. Its core revenue derives from two segments: Electronic Instruments serving sectors like aerospace and pharmaceuticals, and Electromechanical providing precision motion controls and metals. In 2026, AMETEK emphasizes expanding aerospace and power market penetration, leveraging advanced sensor and monitoring technologies.
Nordson Corporation: Precision Fluid Dispensing Innovator
Nordson leads with specialized dispensing and coating systems for adhesives, polymers, and biomaterials. Its revenue streams split between Industrial Precision Solutions, focusing on automated adhesive and coating equipment, and Advanced Technology Solutions, serving semiconductor and medical device industries. In 2026, Nordson prioritizes automation and precision enhancements to capture growth in semiconductor and specialty coatings markets.
Strategic Collision: Similarities & Divergences
Both companies anchor their strategies in industrial machinery innovation but diverge in focus: AMETEK offers broad instrumentation and electromechanical solutions, while Nordson specializes in fluid dispensing and surface treatment. They compete primarily in industrial automation and precision manufacturing. AMETEK’s scale and diverse end markets contrast with Nordson’s niche precision technology, defining distinct risk and growth profiles for investors.
Income Statement Comparison
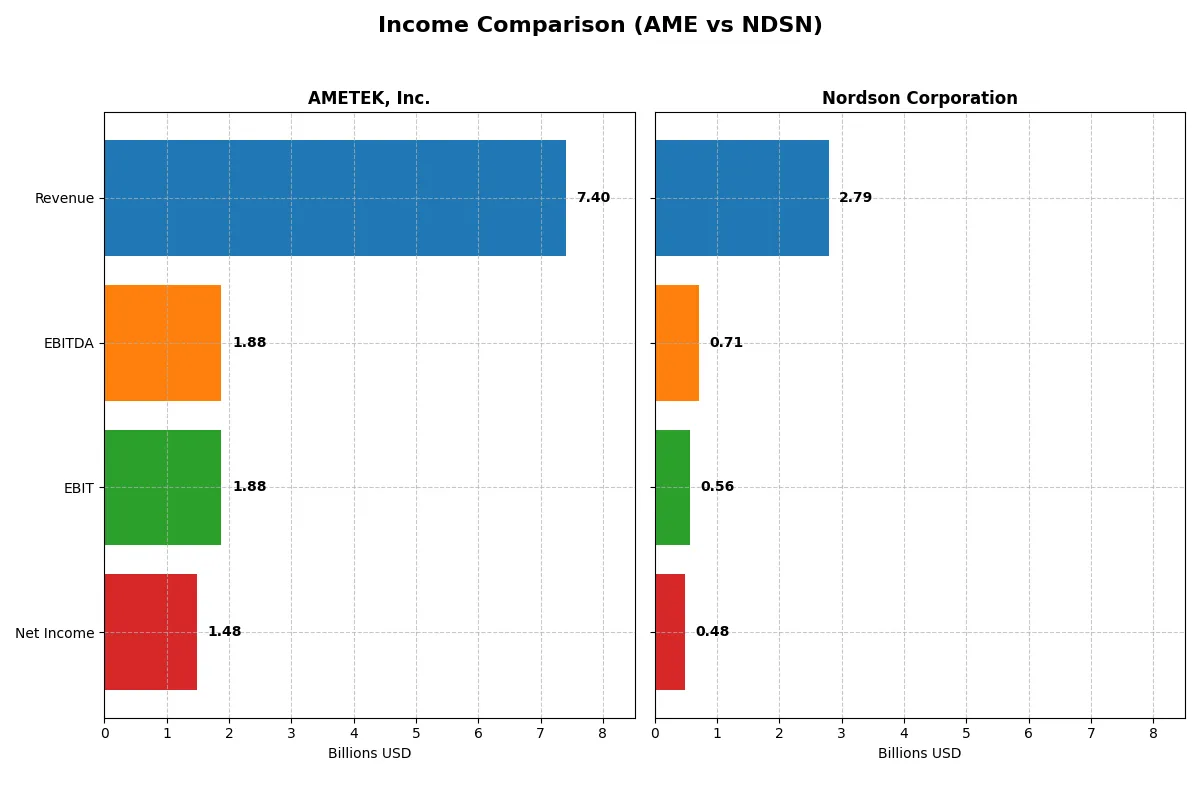
This data dissects the core profitability and scalability of both corporate engines to reveal who dominates the bottom line:
| Metric | AMETEK, Inc. (AME) | Nordson Corporation (NDSN) |
|---|---|---|
| Revenue | 7.4B | 2.8B |
| Cost of Revenue | 4.7B | 1.3B |
| Operating Expenses | 757M | 828M |
| Gross Profit | 2.7B | 1.5B |
| EBITDA | 1.9B | 712M |
| EBIT | 1.9B | 561M |
| Interest Expense | 81M | 101M |
| Net Income | 1.5B | 484M |
| EPS | 6.42 | 8.56 |
| Fiscal Year | 2025 | 2025 |
Income Statement Analysis: The Bottom-Line Duel
This income statement comparison reveals which company drives greater efficiency and returns from its core operations in a competitive industrial landscape.
AMETEK, Inc. Analysis
AMETEK’s revenue climbed steadily from 5.5B in 2021 to 7.4B in 2025, with net income rising 49.5% overall to 1.48B in 2025. Its gross margin holds firm at 36.4%, while net margin expanded to a solid 20%. The 2025 results show efficient cost control despite slight unfavorable operating expense growth, underscoring robust profitability momentum.
Nordson Corporation Analysis
Nordson’s revenue grew modestly from 2.36B in 2021 to 2.79B in 2025, with net income rising 6.6% to 484M. It maintains an impressive 55.2% gross margin but sees a thinner net margin of 17.4%. The 2025 year marks a decline in EBIT by nearly 17%, signaling margin pressures despite stable revenue growth, reflecting some operational challenges.
Margin Strength vs. Growth Resilience
AMETEK outpaces Nordson in both revenue and net income growth, demonstrating stronger margin expansion and operational efficiency. Nordson’s superior gross margin is offset by weaker EBIT and net margin trends. For investors prioritizing growth and margin improvement, AMETEK’s profile offers a more compelling blend of scale and profitability.
Financial Ratios Comparison
These vital ratios act as a diagnostic tool to expose the underlying fiscal health, valuation premiums, and capital efficiency of the companies compared below:
| Ratios | AMETEK, Inc. (AME) | Nordson Corporation (NDSN) |
|---|---|---|
| ROE | 13.9% | 15.9% |
| ROIC | 11.0% | 10.5% |
| P/E | 32.0 | 27.1 |
| P/B | 4.45 | 4.31 |
| Current Ratio | 1.06 | 1.64 |
| Quick Ratio | 0.67 | 1.05 |
| D/E (Debt-to-Equity) | 0.21 | 0.69 |
| Debt-to-Assets | 14.2% | 35.4% |
| Interest Coverage | 23.8 | 7.0 |
| Asset Turnover | 0.46 | 0.47 |
| Fixed Asset Turnover | 6.56 | 4.70 |
| Payout ratio | 19.3% | 37.0% |
| Dividend yield | 0.60% | 1.36% |
| Fiscal Year | 2025 | 2025 |
Efficiency & Valuation Duel: The Vital Signs
Ratios act as the company’s DNA, revealing hidden risks and operational excellence critical for investors to gauge true performance.
AMETEK, Inc.
AMETEK posts a solid 13.9% ROE with a strong 20% net margin, signaling healthy profitability. However, its P/E of 32 and P/B of 4.45 mark the stock as stretched. Dividend yield sits low at 0.6%, suggesting limited income focus while reinvesting in growth areas to sustain long-term value.
Nordson Corporation
Nordson delivers a robust 15.9% ROE and a favorable 17.4% net margin, demonstrating operational strength. Its P/E ratio of 27.1 is high but less stretched than AMETEK. A 1.36% dividend yield combined with solid liquidity ratios reflects balanced shareholder returns and prudent capital allocation.
Premium Valuation vs. Operational Safety
Nordson offers a better blend of profitability and valuation with more favorable liquidity and shareholder returns. AMETEK’s higher valuation multiples carry extra risk. Investors seeking operational safety with dividends may prefer Nordson, while growth-focused profiles might monitor AMETEK’s reinvestment strategy.
Which one offers the Superior Shareholder Reward?
I compare AMETEK, Inc. (AME) and Nordson Corporation (NDSN) on their dividend yields, payout ratios, and buybacks. AME yields ~0.62% with a low payout ratio near 19%, sustaining dividends well with free cash flow. NDSN offers a higher yield around 1.36% but with a payout ratio near 37%, indicating less margin for safety. Both deploy strong buyback programs, but AME’s lower payout and consistent FCF coverage signal more sustainable distributions. NDSN’s higher leverage and payout add risk. I conclude AME offers a more attractive total return profile for 2026 investors, balancing income and capital return prudently.
Comparative Score Analysis: The Strategic Profile
The radar chart reveals the fundamental DNA and trade-offs of AMETEK, Inc. and Nordson Corporation, highlighting their distinct financial strengths and valuation profiles:
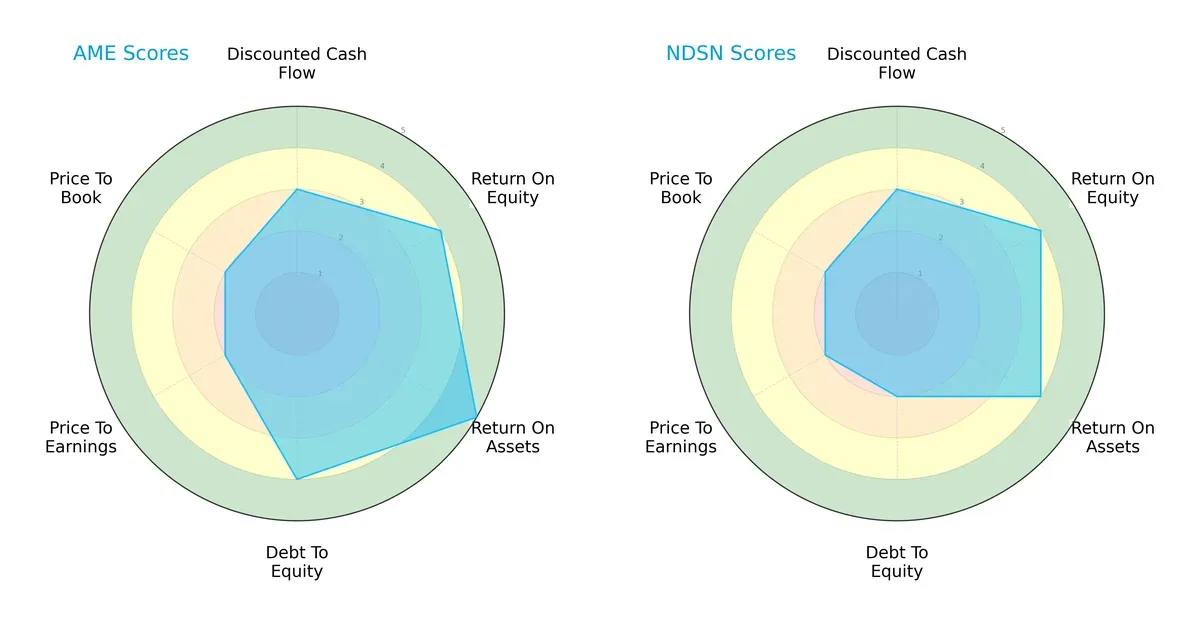
AMETEK shows a more balanced profile with very favorable returns on assets (5) and solid debt management (4). Nordson matches on return on equity (4) but lags in debt-to-equity (2), indicating higher financial risk. Both score moderately on valuation metrics (P/E and P/B at 2). AMETEK leans on operational efficiency, while Nordson depends on equity returns.
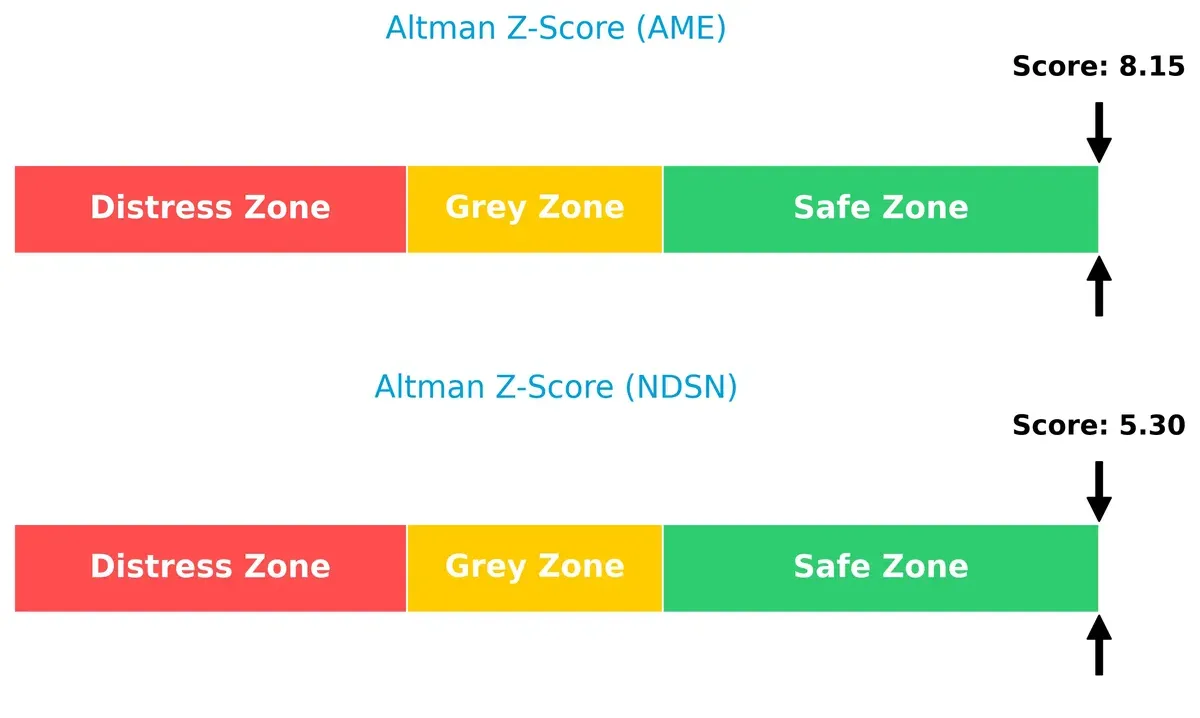
Bankruptcy Risk: Solvency Showdown
AMETEK’s Altman Z-Score of 8.15 far exceeds Nordson’s 5.30, placing both safely above distress thresholds but highlighting AMETEK’s superior long-term solvency strength in this cycle:
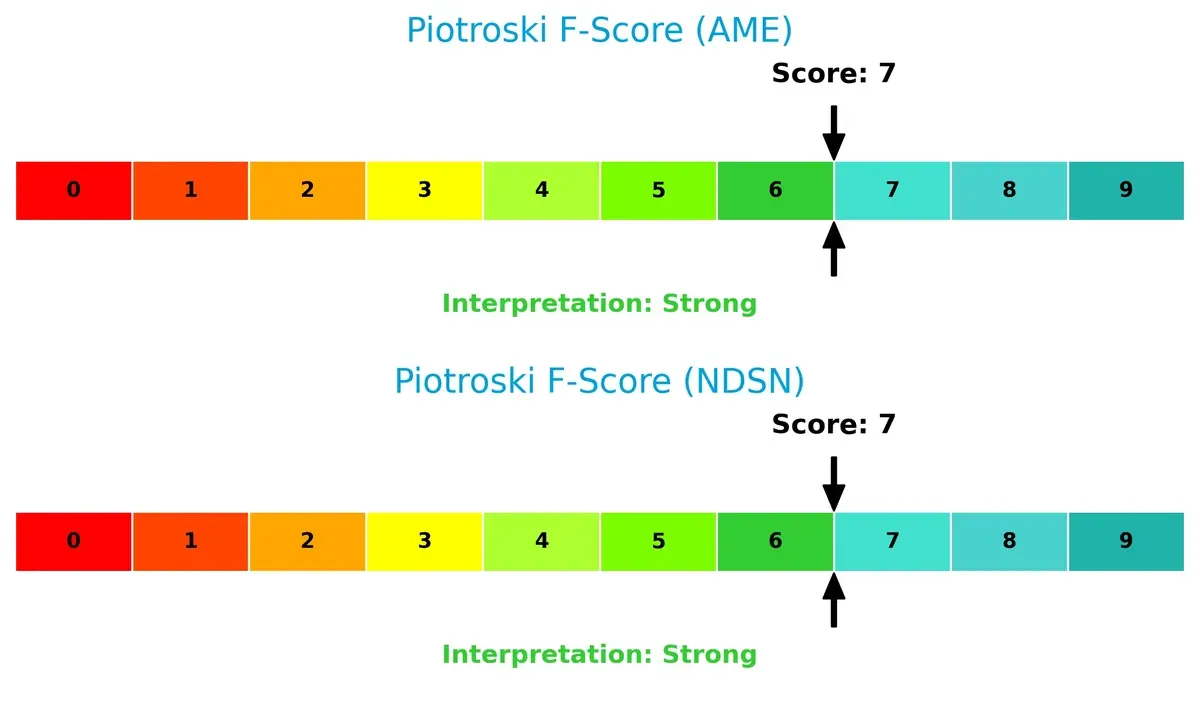
Financial Health: Quality of Operations
Both companies share a Piotroski F-Score of 7, signaling strong financial health without red flags. Their internal metrics suggest robust profitability and efficient operations at similar levels:
How are the two companies positioned?
This section dissects the operational DNA of AMETEK and Nordson by comparing revenue distribution and internal strengths and weaknesses. The goal is to confront their economic moats and reveal which model offers the most resilient competitive advantage today.
Revenue Segmentation: The Strategic Mix
This comparison dissects how AMETEK, Inc. and Nordson Corporation diversify their income streams and highlights where their primary sector bets lie:
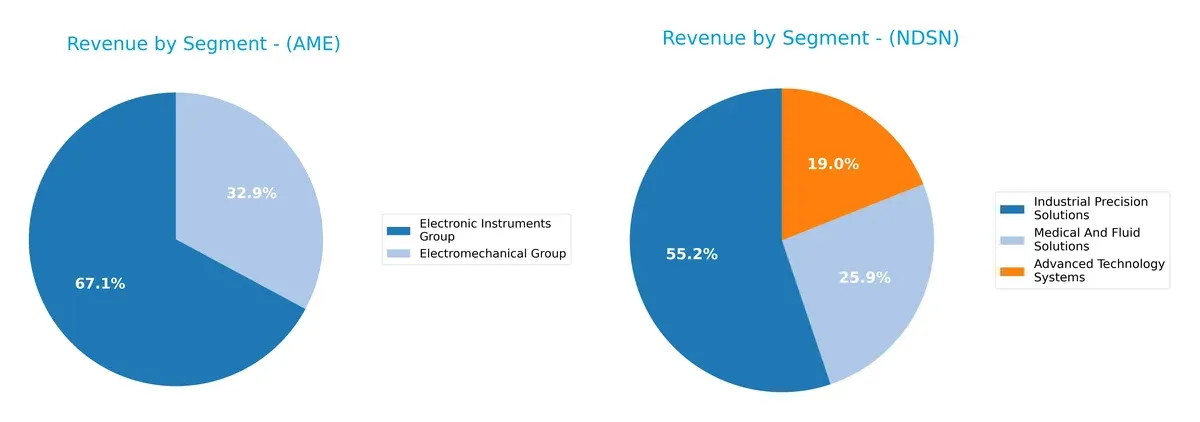
AMETEK anchors its revenue in two clear segments: $4.66B from Electronic Instruments and $2.28B from Electromechanical Group, showing a balanced but concentrated portfolio. Nordson diversifies more with three meaningful segments: $1.48B Industrial Precision, $695M Medical and Fluid, and $510M Advanced Technology Systems. Nordson’s broader mix reduces concentration risk, while AMETEK’s focus suggests stronger ecosystem lock-in in specialized electronic instruments.
Strengths and Weaknesses Comparison
This table compares the strengths and weaknesses of AMETEK and Nordson based on diversification, profitability, financials, innovation, global presence, and market share:
AMETEK Strengths
- Strong profitability with 20% net margin and 11% ROIC
- Low debt-to-assets at 14% and high interest coverage of 23x
- Diverse revenue from Electromechanical and Electronic Instruments segments
- Significant global sales including US, Asia, and Europe
Nordson Strengths
- Favorable profitability with 17% net margin and 16% ROE
- Strong liquidity with 1.64 current and 1.05 quick ratios
- Diversified product lines across Advanced Tech, Industrial, Medical segments
- Balanced global revenue exposure in Americas, Asia, and Europe
AMETEK Weaknesses
- High valuation multiples with PE of 32 and PB of 4.45
- Unfavorable quick ratio at 0.67 and low asset turnover of 0.46
- Low dividend yield at 0.6% may deter income investors
Nordson Weaknesses
- Elevated debt levels with 0.69 debt-to-equity and 35% debt to assets
- PE at 27 and PB above 4 indicate expensive valuation
- Asset turnover also weak at 0.47 limits operational efficiency
AMETEK excels in profitability and capital structure but faces liquidity and valuation concerns. Nordson shows balanced liquidity and profitability but carries higher leverage and valuation risks. Both companies maintain diversified operations and global presence, shaping their strategic priorities.
The Moat Duel: Analyzing Competitive Defensibility
A structural moat is the only reliable shield protecting long-term profits from relentless competitive erosion. Let’s dissect the competitive moats of AMETEK and Nordson Corporation:
AMETEK, Inc.: Diversified Industrial Precision with Growing ROIC
AMETEK’s moat lies in its broad portfolio of electronic instruments and electromechanical devices, driven by engineering expertise and scale. This manifests in a very favorable ROIC premium of 2.55% above WACC and a strong upward ROIC trend (+11.5%), confirming efficient capital use and margin stability. Expansion into aerospace and power markets deepens its moat in 2026, supporting durable profitability.
Nordson Corporation: Specialized Dispensing Systems with Profitability Challenges
Nordson’s moat centers on specialized dispensing and coating systems, a narrower niche compared to AMETEK’s diversified base. While it maintains a positive ROIC premium (+2.47%), its profitability is under pressure with a steep ROIC decline (-26.6%). This signals potential margin compression and challenges in sustaining value creation despite steady revenue growth, posing risks to its moat sustainability.
Verdict: Diversification and ROIC Momentum vs. Niche Focus Under Margin Pressure
AMETEK holds the deeper moat, combining diversified markets with growing returns on capital. Nordson’s narrower moat shows value creation but weakened profitability. AMETEK is better positioned to defend market share amid evolving industrial demands in 2026.
Which stock offers better returns?
Over the past 12 months, AMETEK, Inc. and Nordson Corporation both experienced bullish price trends, with AMETEK showing stronger growth and steadier upward momentum.
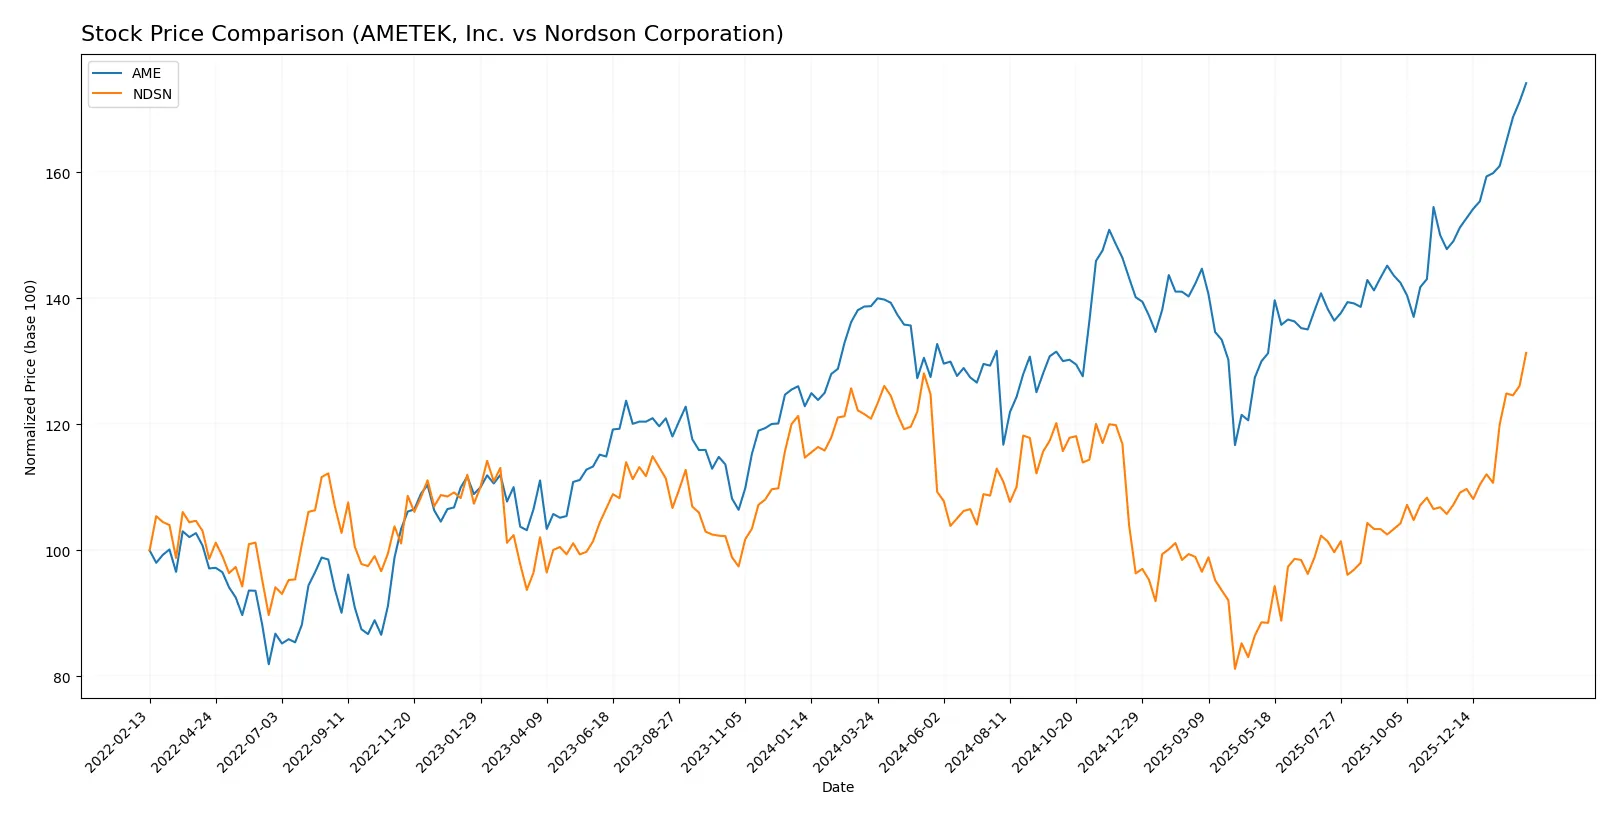
Trend Comparison
AMETEK, Inc. gained 25.51% over the past year, showing an accelerating bullish trend. Its price ranged from 153 to 228, with a standard deviation of 14.42, indicating moderate volatility.
Nordson Corporation’s stock rose 8.64% in the same period, also accelerating upward. Its price fluctuated between 177 and 286, with higher volatility at a 24.04 standard deviation.
AMETEK outperformed Nordson with a stronger total return and steadier price appreciation over the last twelve months.
Target Prices
Analysts show a bullish consensus for AMETEK, Inc. and Nordson Corporation with solid upside potential.
| Company | Target Low | Target High | Consensus |
|---|---|---|---|
| AMETEK, Inc. | 204 | 271 | 237.91 |
| Nordson Corp. | 240 | 295 | 274.17 |
The consensus targets for both stocks exceed their current prices, signaling analyst confidence in further gains. AMETEK trades near $228, below its $238 consensus. Nordson, at $286, is close to its $274 consensus, indicating a more balanced risk-reward.

Don’t Let Luck Decide Your Entry Point
Optimize your entry points with our advanced ProRealTime indicators. You’ll get efficient buy signals with precise price targets for maximum performance. Start outperforming now!
How do institutions grade them?
Institutional analysts provide the following grades for AMETEK, Inc. and Nordson Corporation:
AMETEK, Inc. Grades
The table below summarizes recent institutional grades for AMETEK, Inc.:
| Grading Company | Action | New Grade | Date |
|---|---|---|---|
| Keybanc | maintain | Overweight | 2026-02-04 |
| DA Davidson | maintain | Buy | 2026-02-04 |
| Barclays | maintain | Equal Weight | 2026-02-04 |
| Oppenheimer | downgrade | Perform | 2026-01-27 |
| Morgan Stanley | maintain | Equal Weight | 2026-01-12 |
| Barclays | maintain | Equal Weight | 2026-01-07 |
| Keybanc | maintain | Overweight | 2026-01-07 |
| Keybanc | maintain | Overweight | 2026-01-06 |
| Mizuho | maintain | Outperform | 2026-01-05 |
| TD Cowen | upgrade | Buy | 2025-12-23 |
Nordson Corporation Grades
The following table presents institutional grades for Nordson Corporation:
| Grading Company | Action | New Grade | Date |
|---|---|---|---|
| DA Davidson | maintain | Buy | 2025-12-12 |
| Baird | maintain | Neutral | 2025-12-12 |
| DA Davidson | maintain | Buy | 2025-12-11 |
| Keybanc | maintain | Overweight | 2025-12-11 |
| Oppenheimer | maintain | Outperform | 2025-08-25 |
| Baird | maintain | Neutral | 2025-08-22 |
| Keybanc | maintain | Overweight | 2025-07-15 |
| Oppenheimer | upgrade | Outperform | 2025-05-30 |
| Baird | maintain | Neutral | 2025-05-30 |
| Keybanc | maintain | Overweight | 2025-04-08 |
Which company has the best grades?
AMETEK, Inc. holds a mix of Overweight, Buy, and Equal Weight ratings, with some recent downgrades. Nordson Corporation mostly receives Buy, Overweight, and Outperform ratings. Nordson’s grades slightly surpass AMETEK’s, potentially attracting more bullish investor sentiment.
Risks specific to each company
The following categories pinpoint the critical pressure points and systemic threats facing AMETEK, Inc. and Nordson Corporation in the 2026 market environment:
1. Market & Competition
AMETEK, Inc.
- Operates in diverse industrial segments, facing intense competition from global machinery makers.
Nordson Corporation
- Focuses on precision dispensing and coating systems, competing with specialized industrial technology firms.
2. Capital Structure & Debt
AMETEK, Inc.
- Maintains low debt-to-equity (0.21) and strong interest coverage (23.13), signaling financial stability.
Nordson Corporation
- Higher leverage (debt-to-equity 0.69) and moderate interest coverage (5.55) present elevated financial risk.
3. Stock Volatility
AMETEK, Inc.
- Beta near 1.04 indicates volatility close to the market, with a wide price range up to $234.56.
Nordson Corporation
- Beta around 1.00 suggests market-level volatility, with a price range peaking near $287.49.
4. Regulatory & Legal
AMETEK, Inc.
- Exposure in aerospace and medical sectors increases regulatory scrutiny risks.
Nordson Corporation
- Specialized coatings and medical device markets face evolving safety and environmental regulations.
5. Supply Chain & Operations
AMETEK, Inc.
- Complex global supply chains may suffer from raw material cost fluctuations and logistics disruptions.
Nordson Corporation
- Relies on precision manufacturing; supply chain delays could impact production schedules critically.
6. ESG & Climate Transition
AMETEK, Inc.
- Growing pressure to reduce environmental footprint in manufacturing and aerospace sectors.
Nordson Corporation
- Faces challenges adapting coating technologies to stricter environmental standards and sustainability demands.
7. Geopolitical Exposure
AMETEK, Inc.
- Global operations expose it to trade tensions and tariffs, especially in aerospace markets.
Nordson Corporation
- International sales subject to geopolitical risks in supply chain and regulatory changes abroad.
Which company shows a better risk-adjusted profile?
AMETEK’s strongest risk is supply chain complexity, but it benefits from a conservative capital structure and robust financial health. Nordson’s elevated leverage heightens financial risks, despite strong operational niches. AMETEK’s Altman Z-Score of 8.15 versus Nordson’s 5.30 confirms superior financial safety. Overall, AMETEK exhibits a better risk-adjusted profile amid 2026 uncertainties.
Final Verdict: Which stock to choose?
AMETEK, Inc. (AME) stands out as a powerhouse of sustainable value creation, with a very favorable moat driven by its expanding ROIC above WACC. Its disciplined capital allocation and strong profitability make it a cash-generating machine. The point of vigilance remains its moderate liquidity ratios, which suggest some caution on short-term financial flexibility. AME suits portfolios focused on aggressive growth with resilience.
Nordson Corporation (NDSN) leverages a strategic moat grounded in recurring revenue streams and solid operational efficiency. Its strong liquidity and favorable interest coverage offer a safety profile superior to AME’s, despite a declining ROIC trend signaling challenges ahead. NDSN fits well in a GARP (Growth at a Reasonable Price) portfolio prioritizing stability amid growth prospects.
If you prioritize sustainable value creation and can tolerate moderate liquidity constraints, AMETEK outshines with its robust profitability and upward ROIC trajectory. However, if you seek better balance sheet stability and a more conservative growth approach, Nordson offers better stability but commands caution due to its declining profitability trend. Both present analytical scenarios worth considering within their respective risk tolerance frameworks.
Disclaimer: Investment carries a risk of loss of initial capital. The past performance is not a reliable indicator of future results. Be sure to understand risks before making an investment decision.
Go Further
I encourage you to read the complete analyses of AMETEK, Inc. and Nordson Corporation to enhance your investment decisions: