Home > Comparison > Industrials > AME vs NNE
The strategic rivalry between AMETEK, Inc. and Nano Nuclear Energy Inc defines the current trajectory of industrial machinery innovation. AMETEK is a diversified industrial powerhouse with established electronic instruments and electromechanical segments. In contrast, Nano Nuclear Energy focuses on pioneering microreactor technology with a capital-light, high-risk development model. This analysis assesses which company’s approach offers a superior risk-adjusted opportunity for a diversified industrial portfolio.
Table of contents
Companies Overview
AMETEK and Nano Nuclear Energy both play pivotal roles in the industrial machinery sector with distinct market approaches.
AMETEK, Inc.: Industrial Powerhouse in Electronic Instruments and Electromechanical Devices
AMETEK dominates the industrial machinery space by manufacturing and selling advanced electronic instruments and electromechanical devices globally. Its core revenue derives from two segments: Electronic Instruments, serving aerospace, power, and industrial markets, and Electromechanical, providing precision components and motion control. In 2026, AMETEK focuses strategically on expanding its aerospace sensors and power quality monitoring solutions, leveraging its broad industrial footprint and deep expertise.
Nano Nuclear Energy Inc: Innovator in Microreactor Technology
Nano Nuclear Energy operates in the emerging microreactor technology niche, developing solid-core and low-pressure coolant reactors. Its revenue engine is anchored in advanced nuclear technology development and fuel supply through a high-assay low-enriched uranium fabrication facility. The company’s 2026 strategy centers on advancing its ZEUS and ODIN reactor projects and expanding its nuclear fuel and consultation services, positioning itself at the forefront of next-generation nuclear solutions.
Strategic Collision: Similarities & Divergences
While both companies operate in industrial machinery, AMETEK pursues a diversified, mature portfolio with a broad industrial application focus, contrasting sharply with Nano Nuclear’s highly specialized, innovation-driven microreactor niche. Their primary battleground lies in industrial technology innovation, but AMETEK relies on scale and established markets, whereas Nano Nuclear targets emerging nuclear energy solutions. These differences yield distinct investment profiles: AMETEK offers stability and diversification; Nano Nuclear embodies high-growth, high-volatility potential.
Income Statement Comparison
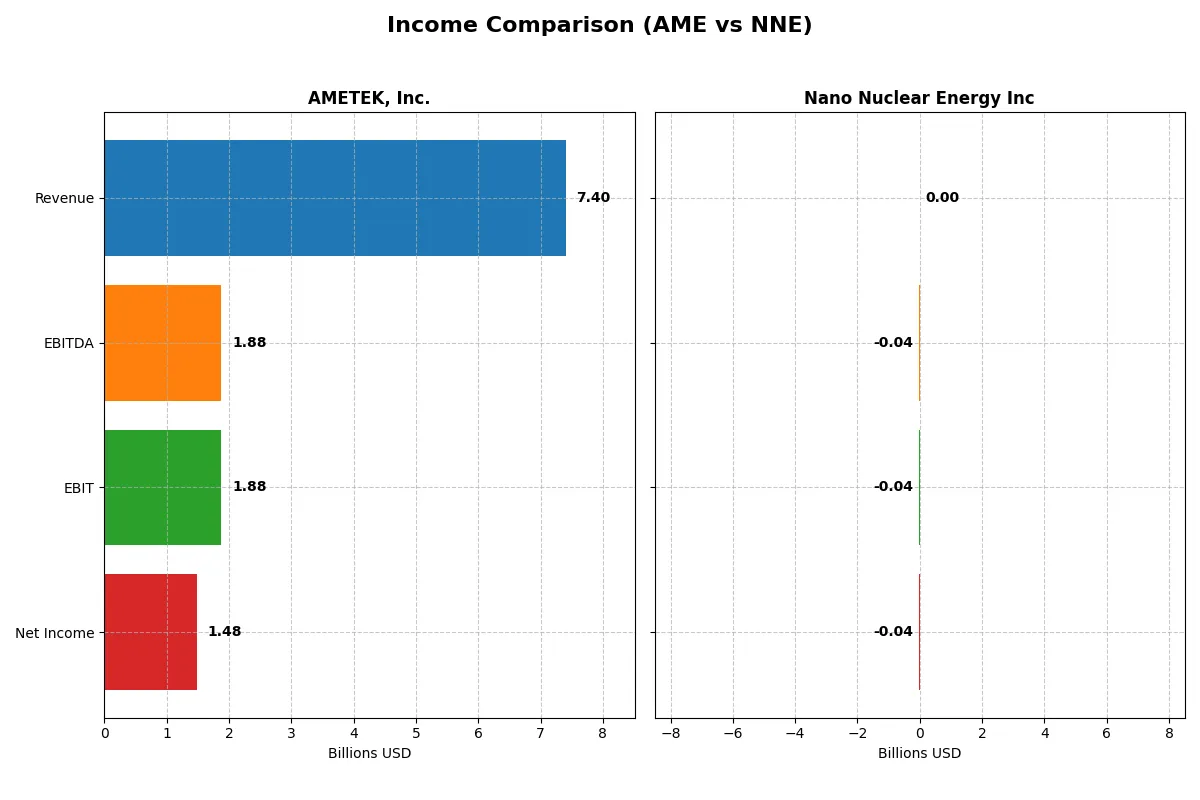
The following data dissects the core profitability and scalability of both corporate engines to reveal who dominates the bottom line:
| Metric | AMETEK, Inc. (AME) | Nano Nuclear Energy Inc (NNE) |
|---|---|---|
| Revenue | 7.4B | 0 |
| Cost of Revenue | 4.7B | 651K |
| Operating Expenses | 757M | 44M |
| Gross Profit | 2.7B | -651K |
| EBITDA | 1.9B | -39M |
| EBIT | 1.9B | -40M |
| Interest Expense | 81M | 0 |
| Net Income | 1.5B | -40M |
| EPS | 6.42 | -1.06 |
| Fiscal Year | 2025 | 2025 |
Income Statement Analysis: The Bottom-Line Duel
This income statement comparison reveals which company operates with superior efficiency and profitability in the current market environment.
AMETEK, Inc. Analysis
AMETEK’s revenue grew steadily to 7.4B in 2025, accompanied by a net income of 1.48B, reflecting solid expansion. Gross margin holds firm at 36.4%, while net margin improved to 20%, demonstrating strong cost control and profitability momentum. The company’s EBIT margin of 25.4% signals operational efficiency and resilience.
Nano Nuclear Energy Inc Analysis
Nano Nuclear Energy shows zero revenue and consistent net losses, reaching -40M in 2025. Gross and net margins remain at 0%, highlighting a lack of revenue generation and ongoing operational inefficiencies. Despite a favorable interest income, the company struggles with heavy operating expenses and widening losses, reflecting a challenging growth trajectory.
Margin Strength vs. Revenue Growth
AMETEK clearly outperforms with robust revenue growth and healthy margins, generating consistent profits and expanding earnings per share. In contrast, Nano Nuclear Energy faces significant losses with no revenue base, undermining its income statement health. For investors, AMETEK’s profile offers a proven, efficient business model with steady profitability.
Financial Ratios Comparison
These vital ratios act as a diagnostic tool to expose the underlying fiscal health, valuation premiums, and capital efficiency of the companies compared below:
| Ratios | AMETEK, Inc. (AME) | Nano Nuclear Energy Inc (NNE) |
|---|---|---|
| ROE | 13.9% | -0.02% |
| ROIC | 11.0% | -0.02% |
| P/E | 31.97 | -36.49 |
| P/B | 4.45 | 0.007 |
| Current Ratio | 1.06 | 53.48 |
| Quick Ratio | 0.67 | 53.48 |
| D/E | 0.21 | 0.01 |
| Debt-to-Assets | 14.2% | 1.2% |
| Interest Coverage | 23.82 | 0 |
| Asset Turnover | 0.46 | 0 |
| Fixed Asset Turnover | 6.56 | 0 |
| Payout Ratio | 19.3% | 0 |
| Dividend Yield | 0.60% | 0 |
| Fiscal Year | 2025 | 2025 |
Efficiency & Valuation Duel: The Vital Signs
Financial ratios act as the company’s DNA, unveiling hidden operational strengths and risks that shape investment decisions.
AMETEK, Inc.
AMETEK delivers solid profitability with a 13.93% ROE and a robust 20% net margin, signaling operational efficiency. Its valuation appears stretched, trading at a high P/E of 31.97 and PB of 4.45. Shareholders receive a modest 0.6% dividend yield, reflecting a cautious payout amid reinvestment for steady growth.
Nano Nuclear Energy Inc
Nano Nuclear Energy posts negative returns with ROE and ROIC near -0.02%, highlighting ongoing losses. Its valuation metrics look cheap, with a P/E of -36.49 and PB of 0.01, but the extremely high current ratio of 53.48 signals potential inefficiency. The company pays no dividend, likely focusing on capital preservation or future development.
Premium Valuation vs. Operational Fragility
AMETEK balances moderate profitability and dividend stability despite elevated valuation multiples. Nano Nuclear Energy’s appealing valuation masks operational weaknesses and severe inefficiencies. Investors prioritizing steady returns may prefer AMETEK, while those seeking speculative upside might consider Nano Nuclear Energy’s riskier profile.
Which one offers the Superior Shareholder Reward?
I see AMETEK, Inc. (AME) pays a steady dividend with a yield near 0.62% and a conservative payout ratio around 19%. It couples dividends with active buybacks, fueling shareholder returns sustainably. Nano Nuclear Energy Inc (NNE) pays no dividends and posts negative free cash flow, relying on reinvestment and growth. However, its financials reveal extreme volatility and no clear cash generation. Historically, AME’s balanced distribution model and positive cash flow outperform growth-only gambles like NNE. I conclude AMETEK offers the superior total shareholder reward in 2026.
Comparative Score Analysis: The Strategic Profile
The radar chart reveals the fundamental DNA and trade-offs of AMETEK, Inc. and Nano Nuclear Energy Inc, highlighting their financial strengths and weaknesses:
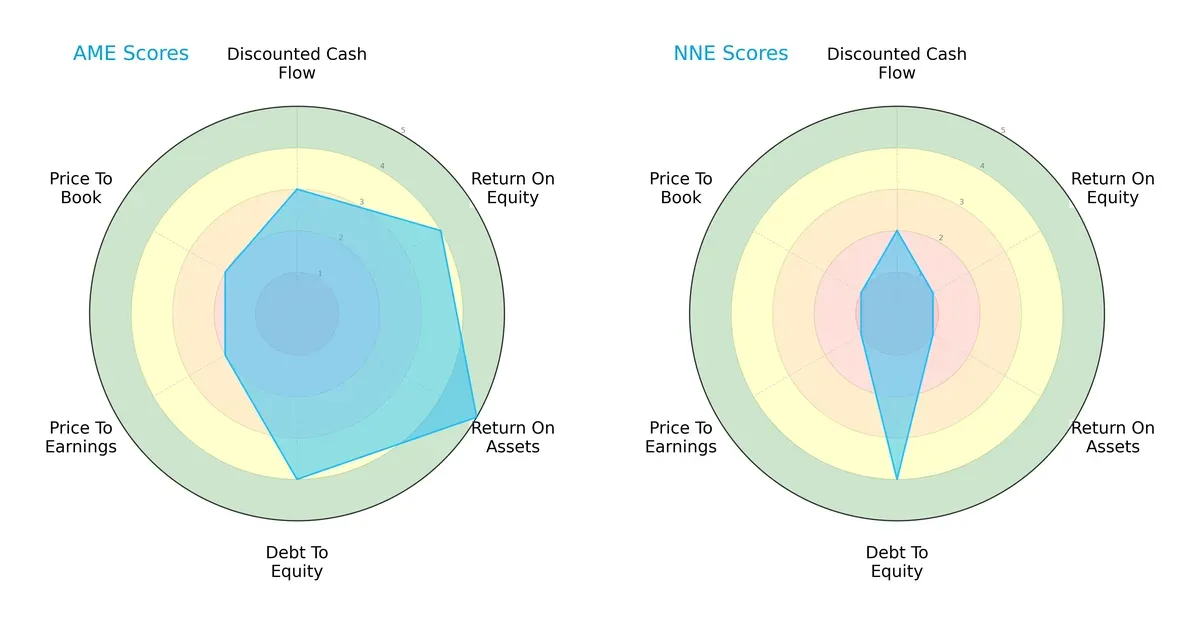
AMETEK displays a well-rounded profile with strong ROE (4) and ROA (5) scores, supported by solid debt management (4). Its valuation metrics (P/E and P/B) are moderate (2), reflecting a balanced but slightly premium stance. Nano Nuclear Energy, by contrast, relies more heavily on conservative debt metrics (4) but scores poorly in profitability (ROE 1, ROA 1) and valuation (P/E 1, P/B 1), indicating a niche or early-stage play with less operational efficiency. AMETEK clearly offers a more balanced and mature financial profile.
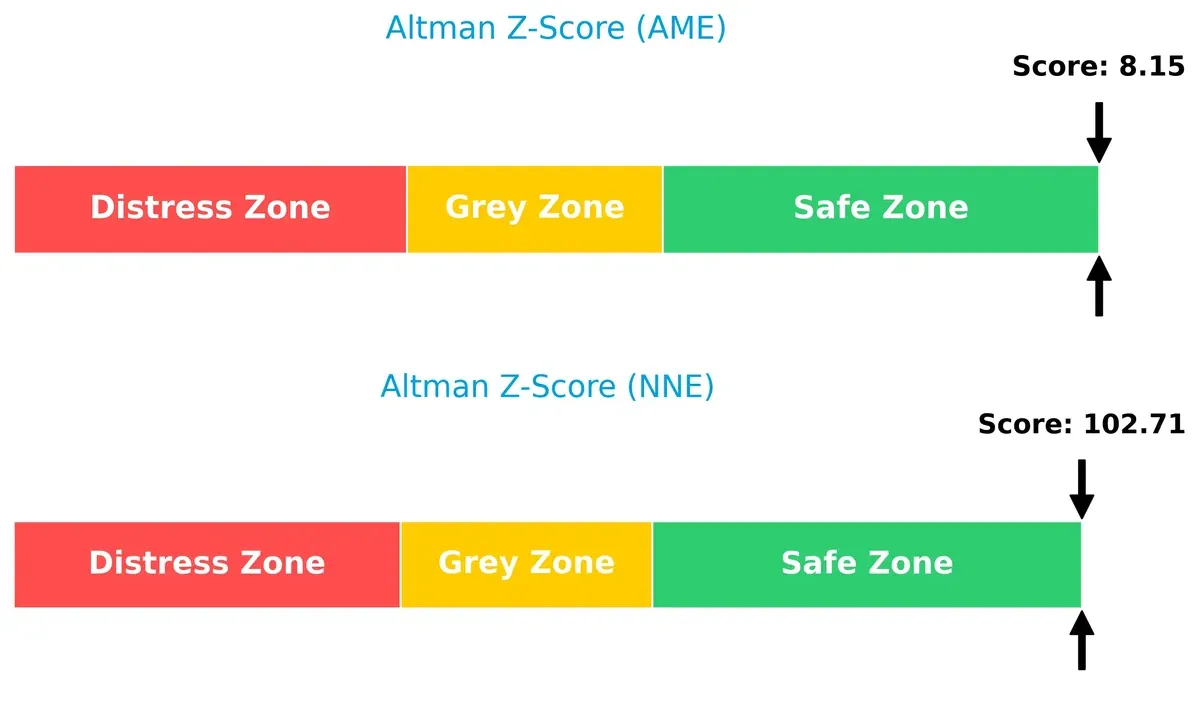
Bankruptcy Risk: Solvency Showdown
AMETEK’s Altman Z-Score of 8.15 versus Nano Nuclear Energy’s 102.71 signals both firms are in the safe zone, though Nano Nuclear’s extreme score suggests exceptional solvency or possibly accounting nuances worth monitoring closely:
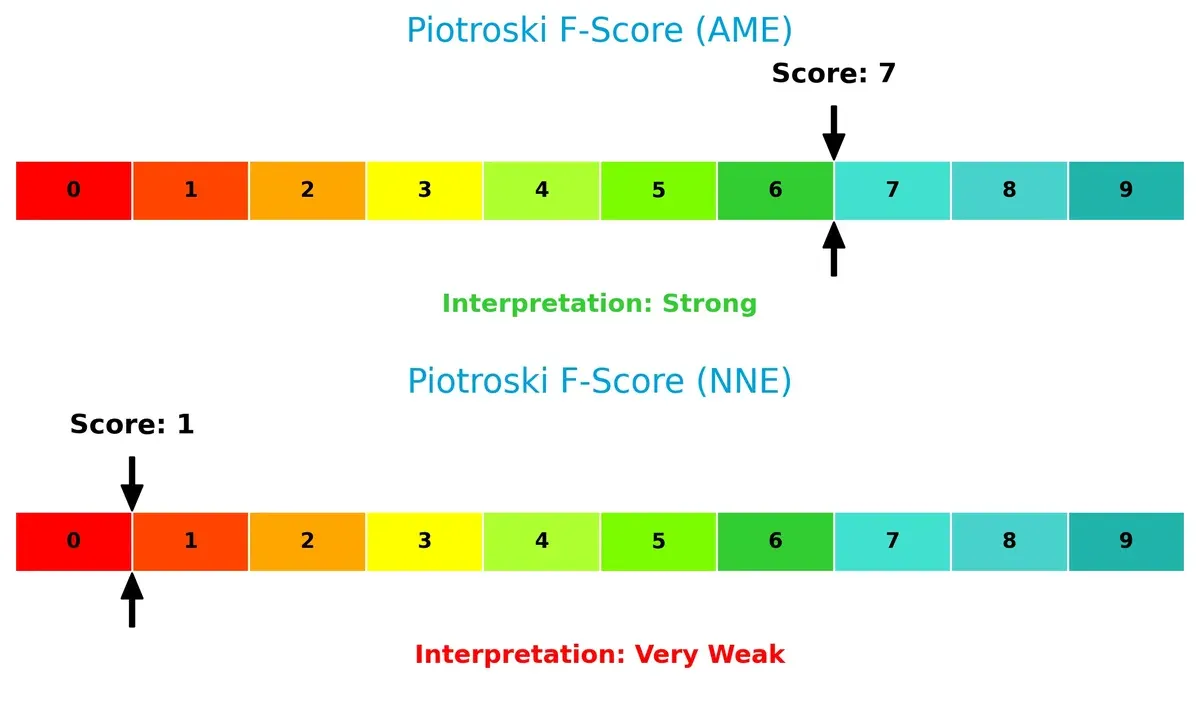
Financial Health: Quality of Operations
AMETEK’s Piotroski F-Score of 7 indicates strong internal financial health, reflecting robust profitability and operational efficiency. Nano Nuclear Energy’s score of 1 reveals significant red flags in financial quality and operational risks, cautioning investors about underlying weaknesses:
How are the two companies positioned?
This section dissects AMETEK and Nano Nuclear Energy’s operational DNA by comparing their revenue distribution and internal strengths and weaknesses. The goal is to confront their economic moats and identify which business model offers a more resilient, sustainable competitive advantage today.
Revenue Segmentation: The Strategic Mix
This visual comparison dissects how AMETEK, Inc. and Nano Nuclear Energy Inc diversify income streams and highlights their primary sector bets:
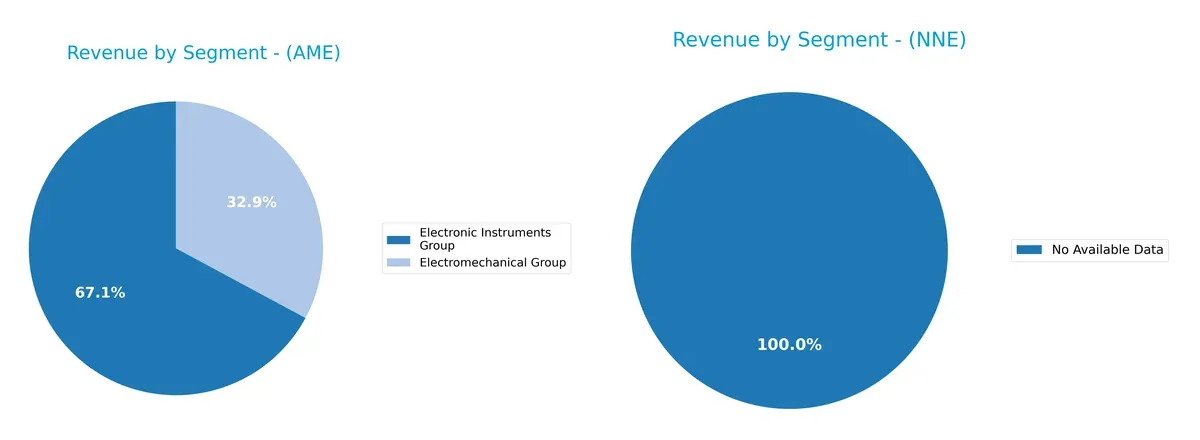
AMETEK, Inc. anchors its revenue in two segments: Electronic Instruments Group generates $4.7B, dwarfing the Electromechanical Group’s $2.3B in 2024. This split shows moderate diversification but leans heavily on electronic instruments. Nano Nuclear Energy Inc lacks available segment data, preventing a comparable analysis. AMETEK’s reliance on a dominant segment suggests exposure to electronic instruments market cycles, with potential concentration risk if sector dynamics shift.
Strengths and Weaknesses Comparison
This table compares the Strengths and Weaknesses of AMETEK, Inc. and Nano Nuclear Energy Inc:
AMETEK, Inc. Strengths
- Consistent revenue from two strong product groups
- Favorable net margin at 20%
- Low debt-to-assets ratio at 14.21%
- High interest coverage ratio at 23.13
- Global presence with diversified geographic sales
Nano Nuclear Energy Inc Strengths
- Low debt-to-assets ratio at 1.22%
- Favorable price-to-book ratio at 0.01
- Favorable price-to-earnings despite negative earnings
- Strong quick ratio at 53.48 supporting liquidity
AMETEK, Inc. Weaknesses
- Unfavorable PE at 31.97 and PB at 4.45 indicating premium valuation
- Low quick ratio at 0.67 signals liquidity risk
- Unfavorable asset turnover at 0.46 and dividend yield at 0.6%
Nano Nuclear Energy Inc Weaknesses
- Negative net margin, ROE, and ROIC indicate unprofitability
- High WACC at 13.51% raises capital cost concerns
- Zero interest coverage and asset turnover show operational inefficiency
AMETEK shows balanced strengths in profitability, capital structure, and geographic diversification but faces valuation and liquidity concerns. Nano Nuclear Energy exhibits financial fragility with negative profitability metrics despite strong liquidity and low leverage, highlighting strategic challenges.
The Moat Duel: Analyzing Competitive Defensibility
A structural moat is the only true shield protecting long-term profits from relentless competition erosion:
AMETEK, Inc.: Proven Efficiency and Scale Moat
AMETEK leverages cost advantages and diversified product lines, reflected in a 25.4% EBIT margin and 2.5% ROIC above WACC. Its expanding aerospace and industrial markets deepen this moat in 2026.
Nano Nuclear Energy Inc: Emerging Innovation Moat
Nano Nuclear’s technological edge in microreactors contrasts AMETEK’s scale but shows zero gross margin and negative value creation. Its growing ROIC trend hints at future potential amid early-stage risks.
Efficiency and Scale vs. Innovation Risk
AMETEK’s wider, proven moat beats Nano Nuclear’s nascent positioning. AMETEK’s consistent value creation and margin stability better defend market share against competitive pressures.
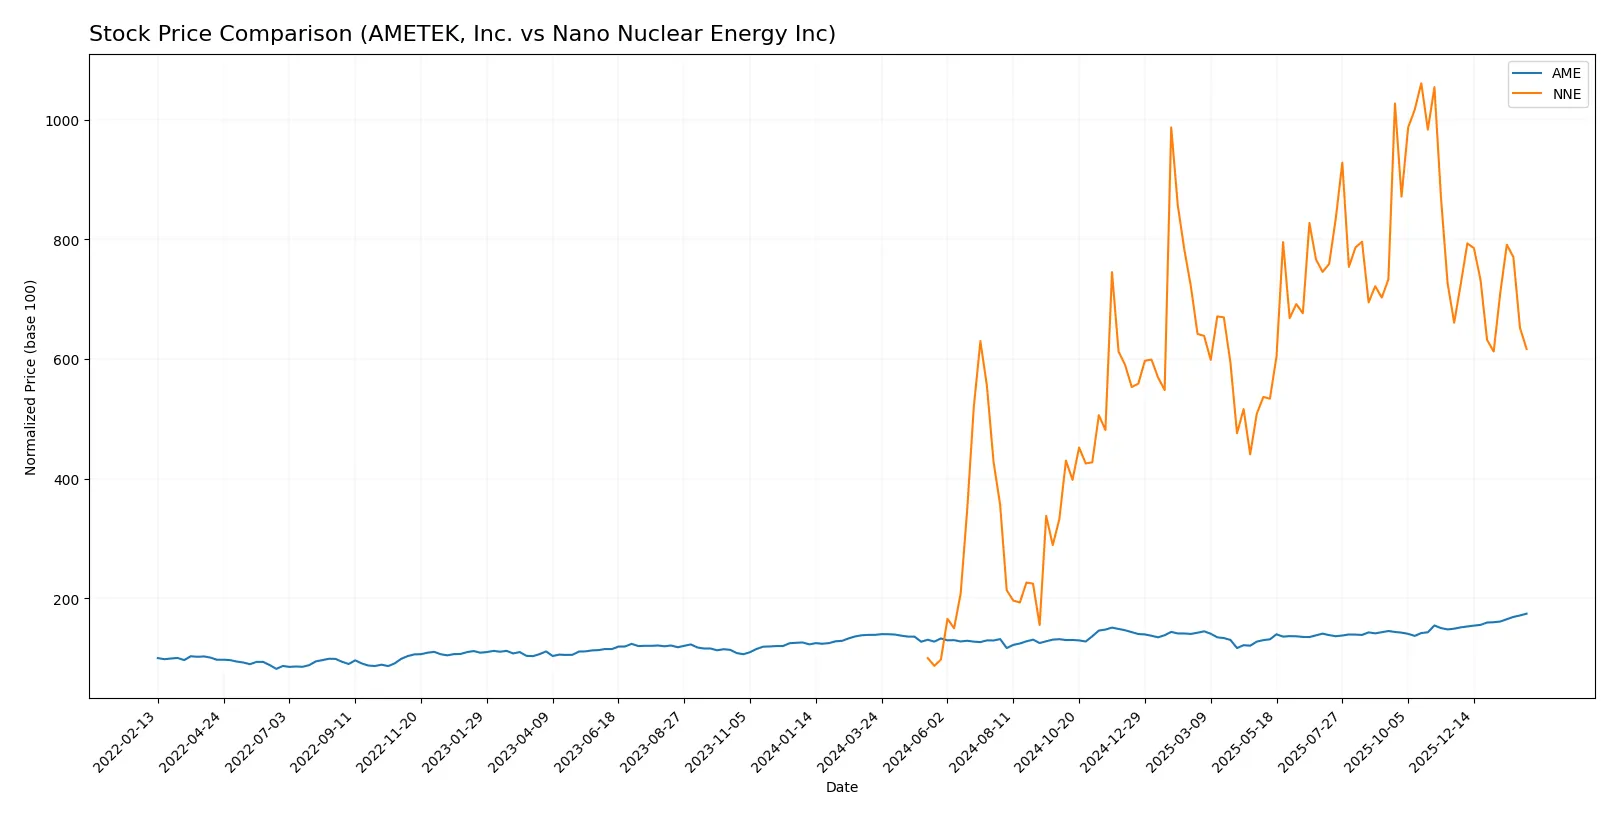
Which stock offers better returns?
The past year reveals contrasting price dynamics: AMETEK, Inc. rallies steadily with accelerating gains, while Nano Nuclear Energy Inc surges massively overall but slows sharply more recently.
Trend Comparison
AMETEK, Inc. posts a bullish 25.51% gain over 12 months with accelerating momentum, hitting a high of 227.83 and a low of 152.66, supported by increasing volume and strong buyer dominance recently.
Nano Nuclear Energy Inc achieves an extraordinary 516.63% rise over the year but shows deceleration and a recent bearish 6.65% drop, with price ranges from 3.92 to 47.84 and declining volume amid seller dominance.
Comparing both, Nano Nuclear Energy’s massive overall gain surpasses AMETEK’s steady rise, though recent weakness suggests caution relative to AMETEK’s stronger short-term momentum.
Target Prices
Analysts present a clear consensus on target prices for AMETEK, Inc. and Nano Nuclear Energy Inc.
| Company | Target Low | Target High | Consensus |
|---|---|---|---|
| AMETEK, Inc. | 204 | 271 | 237.91 |
| Nano Nuclear Energy Inc | 50 | 50 | 50 |
The consensus target for AMETEK, Inc. sits approximately 4.6% above its current price of $227.83, indicating moderate upside. Nano Nuclear Energy’s target price is nearly double its current trading price of $27.81, reflecting high growth expectations but also elevated risk.

Don’t Let Luck Decide Your Entry Point
Optimize your entry points with our advanced ProRealTime indicators. You’ll get efficient buy signals with precise price targets for maximum performance. Start outperforming now!
How do institutions grade them?
AMETEK, Inc. Grades
The following table summarizes recent institutional grades for AMETEK, Inc.:
| Grading Company | Action | New Grade | Date |
|---|---|---|---|
| Keybanc | Maintain | Overweight | 2026-02-04 |
| DA Davidson | Maintain | Buy | 2026-02-04 |
| Barclays | Maintain | Equal Weight | 2026-02-04 |
| Oppenheimer | Downgrade | Perform | 2026-01-27 |
| Morgan Stanley | Maintain | Equal Weight | 2026-01-12 |
| Barclays | Maintain | Equal Weight | 2026-01-07 |
| Keybanc | Maintain | Overweight | 2026-01-07 |
| Keybanc | Maintain | Overweight | 2026-01-06 |
| Mizuho | Maintain | Outperform | 2026-01-05 |
| TD Cowen | Upgrade | Buy | 2025-12-23 |
Nano Nuclear Energy Inc Grades
The following table summarizes recent institutional grades for Nano Nuclear Energy Inc:
| Grading Company | Action | New Grade | Date |
|---|---|---|---|
| HC Wainwright & Co. | Maintain | Buy | 2025-08-19 |
| Ladenburg Thalmann | Downgrade | Sell | 2025-08-18 |
| HC Wainwright & Co. | Maintain | Buy | 2025-08-15 |
| HC Wainwright & Co. | Maintain | Buy | 2025-03-31 |
| HC Wainwright & Co. | Maintain | Buy | 2025-01-29 |
| HC Wainwright & Co. | Maintain | Buy | 2024-11-27 |
| Benchmark | Maintain | Buy | 2024-11-07 |
| Benchmark | Maintain | Buy | 2024-07-15 |
| Benchmark | Maintain | Buy | 2024-06-25 |
Which company has the best grades?
AMETEK, Inc. shows a mix of “Buy,” “Overweight,” and “Equal Weight” grades with only one recent downgrade. Nano Nuclear Energy Inc has mostly “Buy” ratings but includes a notable “Sell” downgrade. AMETEK’s more balanced and higher-tier grades could signal stronger institutional confidence for investors.
Risks specific to each company
The following categories identify critical pressure points and systemic threats facing AMETEK, Inc. and Nano Nuclear Energy Inc in the 2026 market environment:
1. Market & Competition
AMETEK, Inc.
- Established industrial machinery player with broad product lines and steady market presence.
Nano Nuclear Energy Inc
- Early-stage microreactor tech firm facing intense competition and uncertain market adoption.
2. Capital Structure & Debt
AMETEK, Inc.
- Low debt-to-equity (0.21), strong interest coverage (23.13), signaling financial stability.
Nano Nuclear Energy Inc
- Nearly debt-free (0.01 D/E) but zero interest coverage due to lack of operating profits.
3. Stock Volatility
AMETEK, Inc.
- Moderate beta (1.04) reflects typical industrial sector volatility.
Nano Nuclear Energy Inc
- Extremely high beta (7.49) indicates high stock price volatility and investor risk.
4. Regulatory & Legal
AMETEK, Inc.
- Operates in diverse regulated industrial markets but with long experience managing compliance.
Nano Nuclear Energy Inc
- Nuclear energy sector faces stringent regulations, licensing risks, and public scrutiny.
5. Supply Chain & Operations
AMETEK, Inc.
- Established supply chains with some inefficiencies (low asset turnover 0.46) but operational scale.
Nano Nuclear Energy Inc
- Nascent operations with high uncertainty in supply chain reliability and scale-up risks.
6. ESG & Climate Transition
AMETEK, Inc.
- Moderate ESG exposure; industrial footprint with ongoing initiatives in power quality and efficiency.
Nano Nuclear Energy Inc
- Positioned in clean energy niche but faces technology and adoption risks amid climate policy shifts.
7. Geopolitical Exposure
AMETEK, Inc.
- US-based with global operations; moderately exposed to trade and geopolitical tensions.
Nano Nuclear Energy Inc
- Concentrated US operations but nuclear supply chain may face geopolitical constraints.
Which company shows a better risk-adjusted profile?
AMETEK’s key risk lies in market competition and operational efficiency, yet it sustains strong financial health and stable cash flow. Nano Nuclear Energy faces existential risks from regulatory hurdles and extreme stock volatility, offset slightly by low leverage. AMETEK’s solid Altman Z-score and Piotroski score confirm superior financial stability. Recent data highlights Nano Nuclear’s volatile stock price (-7% intraday change) and zero profitability as red flags. Overall, AMETEK offers a more balanced risk-adjusted profile for cautious investors.
Final Verdict: Which stock to choose?
AMETEK, Inc. wields unmatched operational efficiency and a robust economic moat, driving consistent value creation. Its main point of vigilance lies in moderate valuation multiples and tight liquidity ratios. This stock suits investors seeking disciplined, value-driven exposure within an aggressive growth portfolio.
Nano Nuclear Energy Inc boasts a strategic moat rooted in its innovative niche and minimal debt load, offering a safety cushion compared to AMETEK. Yet, it faces substantial profitability challenges and cash flow volatility. It fits well in a GARP portfolio focused on high-risk, potential turnaround stories.
If you prioritize steady value creation and operational excellence, AMETEK outshines with sustainable profitability and a proven moat. However, if you seek speculative growth with asymmetric upside, Nano Nuclear Energy offers better stability in capital structure despite its current losses. Both require careful risk tolerance aligned with your investment strategy.
Disclaimer: Investment carries a risk of loss of initial capital. The past performance is not a reliable indicator of future results. Be sure to understand risks before making an investment decision.
Go Further
I encourage you to read the complete analyses of AMETEK, Inc. and Nano Nuclear Energy Inc to enhance your investment decisions: