Home > Comparison > Industrials > AME vs KAI
The strategic rivalry between AMETEK, Inc. and Kadant Inc. shapes the industrial machinery sector’s competitive landscape. AMETEK operates as a diversified, capital-intensive manufacturer with broad exposure to electronic instruments and electromechanical devices. Kadant focuses on engineered systems within niche industrial processing and material handling markets. This analysis will dissect their distinct business models and growth vectors to identify which offers the superior risk-adjusted return for a balanced portfolio in 2026.
Table of contents
Companies Overview
AMETEK, Inc. and Kadant Inc. command significant niches in the industrial machinery sector, each shaping global markets with specialized technologies.
AMETEK, Inc.: Global Industrial Instrumentation Leader
AMETEK dominates with its diverse portfolio of electronic instruments and electromechanical devices. Its revenue flows from two segments: Electronic Instruments serving aerospace, power, and industrial markets, and Electromechanical products including precision motion control and thermal management. In 2026, AMETEK focuses on expanding its aerospace sensor technology and power quality monitoring to cement its competitive edge.
Kadant Inc.: Engineered Systems Specialist
Kadant stands out by delivering engineered systems across Flow Control, Industrial Processing, and Material Handling segments. Its income is largely driven by fluid-handling systems, industrial automation, and biodegradable absorbent granules. Kadant’s 2026 strategy emphasizes innovation in steam systems and recycling equipment, reinforcing its role in sustainable industrial solutions.
Strategic Collision: Similarities & Divergences
Both companies excel in industrial machinery but adopt contrasting philosophies: AMETEK invests heavily in precision instrumentation and aerospace, while Kadant prioritizes eco-friendly engineered systems and material handling. Their competitive battlefield lies in process efficiency solutions for industrial clients. AMETEK’s broad industrial reach contrasts with Kadant’s focused niche, presenting distinct risk-return profiles for investors.
Income Statement Comparison
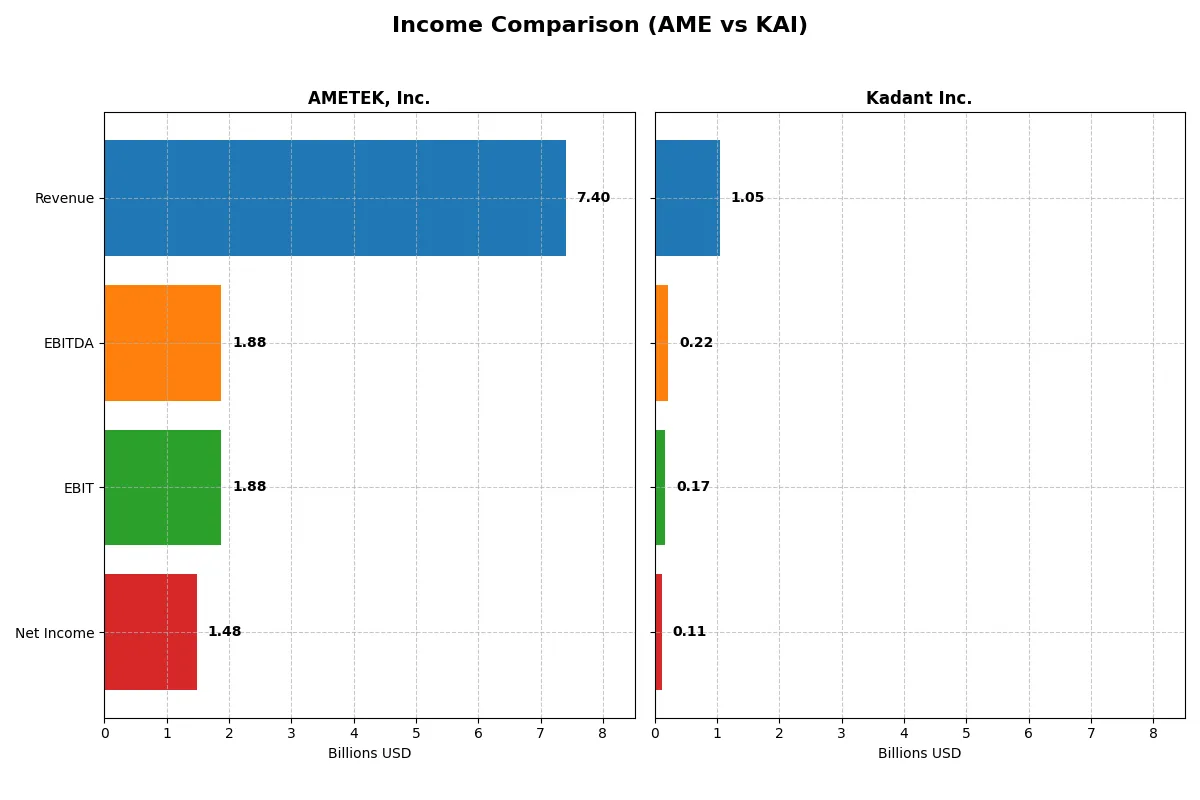
This data dissects the core profitability and scalability of both corporate engines to reveal who dominates the bottom line:
| Metric | AMETEK, Inc. (AME) | Kadant Inc. (KAI) |
|---|---|---|
| Revenue | 7.4B | 1.1B |
| Cost of Revenue | 4.7B | 587M |
| Operating Expenses | 757M | 294M |
| Gross Profit | 2.7B | 466M |
| EBITDA | 1.9B | 223M |
| EBIT | 1.9B | 173M |
| Interest Expense | 81M | 20M |
| Net Income | 1.5B | 112M |
| EPS | 6.42 | 9.51 |
| Fiscal Year | 2025 | 2024 |
Income Statement Analysis: The Bottom-Line Duel
The income statement comparison reveals which company runs a more efficient and profitable business engine over recent years.
AMETEK, Inc. Analysis
AMETEK’s revenue climbed steadily from 5.55B in 2021 to 7.4B in 2025, with net income growing from 990M to 1.48B. Its gross margin remains strong at 36.4%, while net margin holds a favorable 20% in 2025. The company shows solid margin expansion and efficiency gains, signaling healthy operational momentum.
Kadant Inc. Analysis
Kadant’s revenue increased from 635M in 2020 to 1.05B in 2024, with net income rising from 55M to 112M. It maintains a higher gross margin of 44.3% but a lower net margin of 10.6%. Despite robust revenue growth, recent net margin and EPS trends show some softness, indicating margin pressures amid expanding scale.
Margin Power vs. Revenue Scale
AMETEK delivers more robust net margins and consistent profitability growth, while Kadant emphasizes faster top-line expansion but faces recent margin compression. AMETEK’s profile offers stronger bottom-line efficiency. For investors prioritizing steady profit quality and margin resilience, AMETEK presents the more compelling income statement strength.
Financial Ratios Comparison
These vital ratios act as a diagnostic tool to expose the underlying fiscal health, valuation premiums, and capital efficiency of the companies compared below:
| Ratios | AMETEK, Inc. (AME) | Kadant Inc. (KAI) |
|---|---|---|
| ROE | 13.93% | 13.17% |
| ROIC | 11.04% | 10.08% |
| P/E | 31.97 | 36.90 |
| P/B | 4.45 | 4.86 |
| Current Ratio | 1.06 | 2.31 |
| Quick Ratio | 0.67 | 1.55 |
| D/E | 0.21 | 0.38 |
| Debt-to-Assets | 14.21% | 22.57% |
| Interest Coverage | 23.82 | 8.55 |
| Asset Turnover | 0.46 | 0.74 |
| Fixed Asset Turnover | 6.56 | 6.18 |
| Payout ratio | 19.31% | 13.15% |
| Dividend yield | 0.60% | 0.36% |
| Fiscal Year | 2025 | 2024 |
Efficiency & Valuation Duel: The Vital Signs
Financial ratios act as a company’s DNA, exposing hidden risks and operational strengths that shape investor decisions.
AMETEK, Inc.
AMETEK delivers solid profitability with a 13.9% ROE and a strong 20% net margin, signaling operational competence. However, its high P/E of 31.97 and P/B of 4.45 mark the stock as expensive and somewhat stretched. Shareholders receive a modest 0.6% dividend yield, indicating limited income focus and potential reinvestment in growth.
Kadant Inc.
Kadant shows a comparable ROE of 13.2% but with a lower net margin of 10.6%, reflecting leaner profitability. Its valuation appears more stretched, with a P/E of 36.9 and P/B of 4.86, suggesting premium pricing. Kadant’s 0.36% dividend yield is low, implying a strategy leaning towards cautious reinvestment or capital preservation.
Premium Valuation vs. Operational Safety
Kadant’s ratios suggest a more favorable balance of financial health and liquidity, yet it trades at a higher valuation multiple than AMETEK. AMETEK offers stronger margins and a steadier dividend, fitting investors prioritizing operational efficiency and income stability. Kadant suits those comfortable with higher valuation risk for potential growth.
Which one offers the Superior Shareholder Reward?
I see AMETEK, Inc. (AME) delivers a consistent dividend yield near 0.62% with a steady payout ratio around 19%. AME supplements dividends with moderate buybacks, supporting sustainable shareholder returns. Kadant Inc. (KAI) offers a lower dividend yield near 0.36% and a lighter 13% payout ratio, favoring reinvestment and growth. However, KAI’s free cash flow supports aggressive buybacks, enhancing total returns. Historically, AME’s balanced distribution and durable margins suggest a more reliable income stream, while KAI’s growth focus and buybacks create upside but with higher risk. In 2026, I favor AME for a superior total return profile due to its disciplined capital allocation and dividend sustainability.
Comparative Score Analysis: The Strategic Profile
The radar chart reveals the fundamental DNA and trade-offs of AMETEK, Inc. and Kadant Inc., highlighting their financial strengths and valuation nuances:
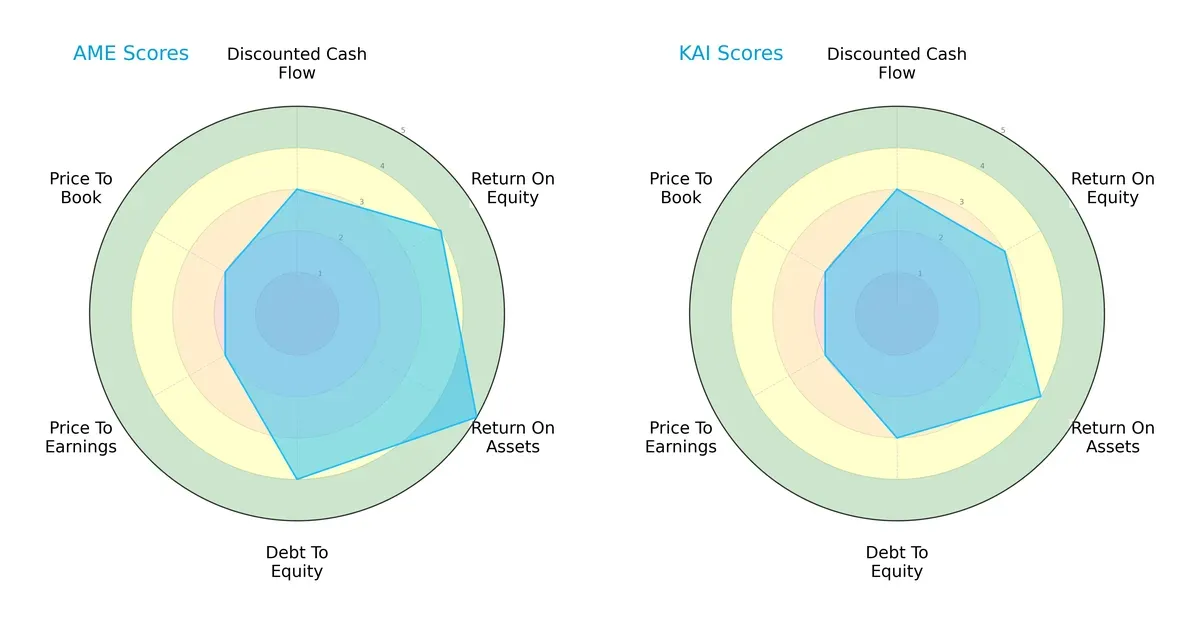
AMETEK exhibits a more balanced profile, excelling in ROE, ROA, and Debt/Equity with scores of 4, 5, and 4 respectively. Kadant lags slightly with moderate scores, particularly in ROE and Debt/Equity. Both firms share moderate valuation scores (P/E and P/B), indicating similar market pricing challenges. AMETEK’s edge lies in operational efficiency, while Kadant relies more on asset utilization.
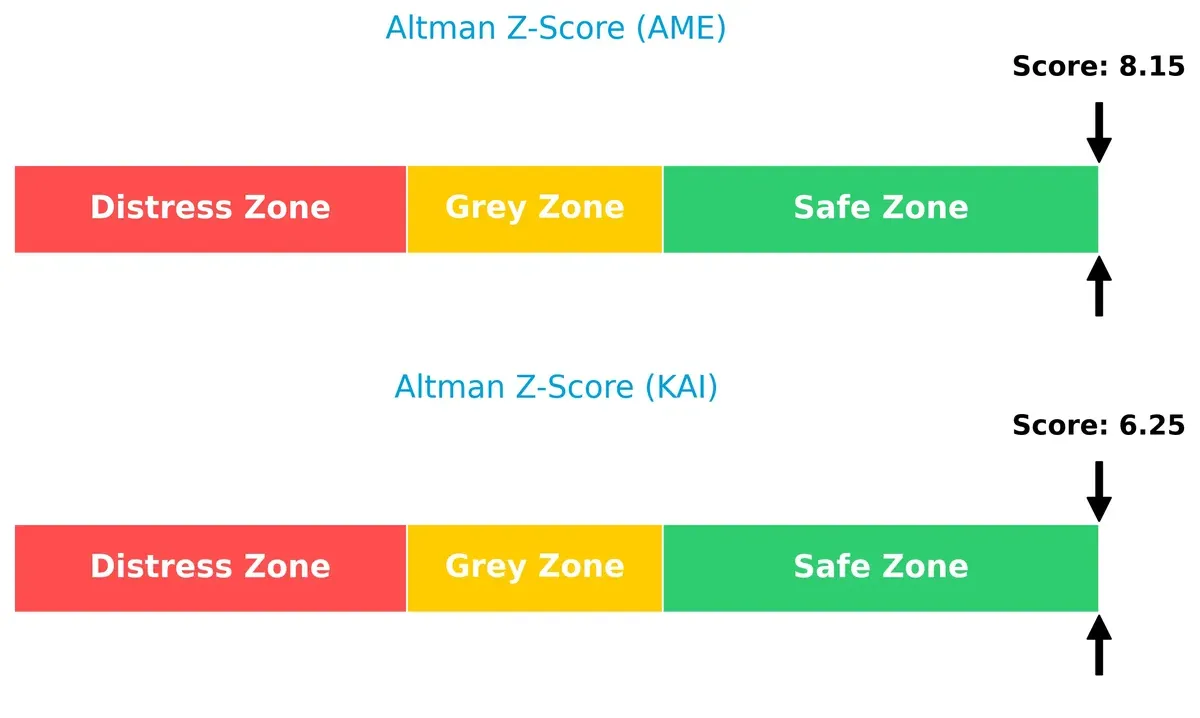
Bankruptcy Risk: Solvency Showdown
AMETEK’s Altman Z-Score of 8.15 versus Kadant’s 6.25 places both comfortably in the safe zone, but AMETEK shows a stronger buffer against bankruptcy risk in this cycle:
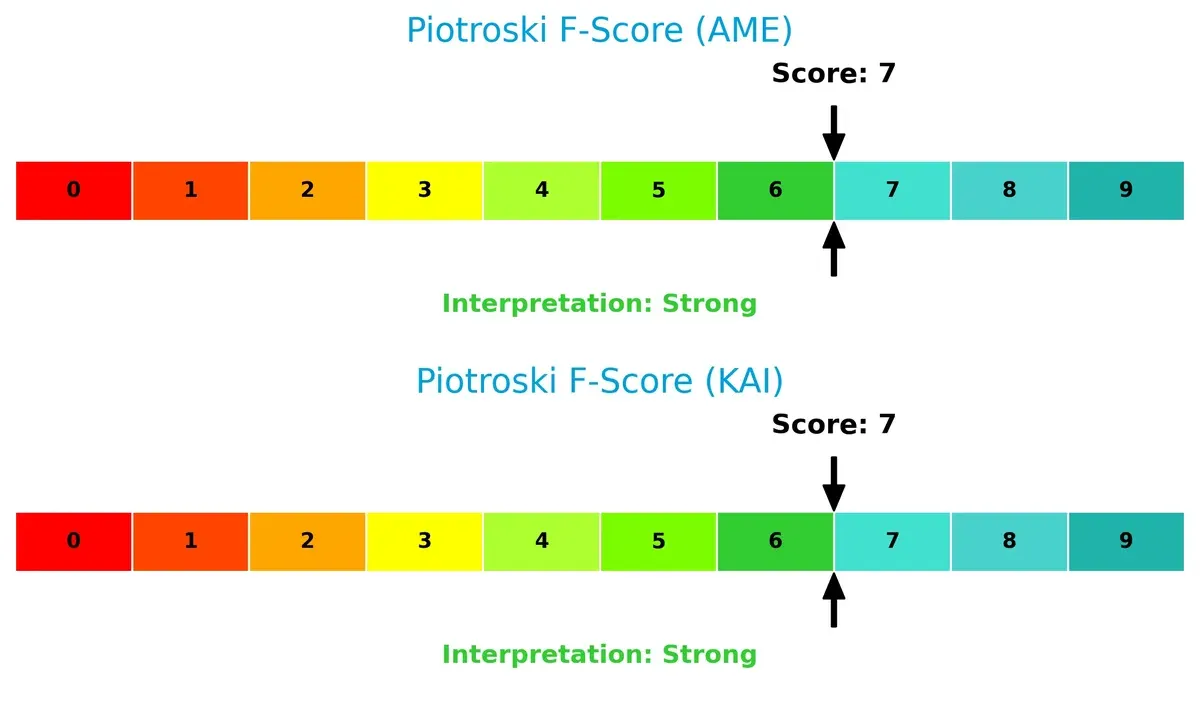
Financial Health: Quality of Operations
Both companies score a solid 7 on the Piotroski F-Score, signaling strong financial health. Neither shows immediate red flags in profitability, leverage, or liquidity metrics:
How are the two companies positioned?
This section dissects AMETEK and Kadant’s operational DNA by comparing revenue distribution and internal strengths and weaknesses. The goal is to confront their economic moats and identify which business model delivers the most resilient competitive advantage today.
Revenue Segmentation: The Strategic Mix
This visual comparison dissects how AMETEK, Inc. and Kadant Inc. diversify their income streams and where their primary sector bets lie:
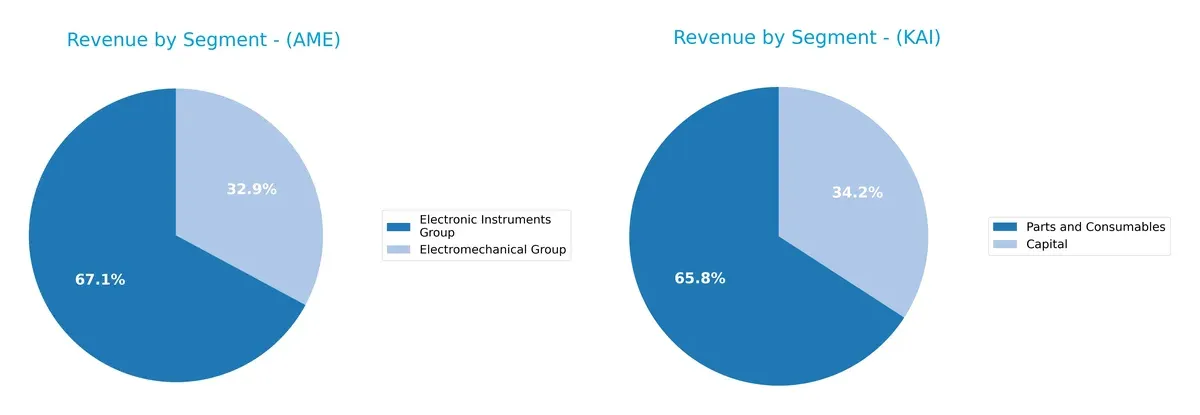
AMETEK’s revenue pivots mainly on two large segments: Electronic Instruments Group at $4.66B and Electromechanical Group at $2.28B, showing a balanced but Electronics-heavy portfolio. Kadant leans on Parts and Consumables at $694M, nearly doubling its Capital segment at $360M, signaling moderate diversification. AMETEK’s mix suggests ecosystem lock-in benefits, while Kadant’s reliance on consumables hints at steady aftermarket demand but carries concentration risk.
Strengths and Weaknesses Comparison
This table compares the strengths and weaknesses of AMETEK, Inc. and Kadant Inc. based on diversification, profitability, financials, innovation, global presence, and market share:
AMETEK Strengths
- Strong product diversification with Electromechanical and Electronic Instruments groups
- Favorable net margin at 20% indicating high profitability
- Low debt-to-equity ratio at 0.21 enhances financial stability
- High interest coverage ratio of 23.13 signals robust earnings
- Solid global presence with major revenues from US, Asia, and Europe
- Favorable fixed asset turnover at 6.56 reflecting efficient asset use
Kadant Strengths
- Favorable net margin at 10.59% supporting profitability
- Strong liquidity shown by current ratio 2.31 and quick ratio 1.55
- Favorable debt metrics with debt-to-assets at 22.57% and interest coverage 8.64
- Diversified geographic revenue across North America, Europe, and Asia
- Favorable fixed asset turnover at 6.18 indicates good operational efficiency
- Higher percentage of favorable financial ratios (57.14%) than AMETEK
AMETEK Weaknesses
- Unfavorable valuation multiples: PE at 31.97 and PB at 4.45 suggest overvaluation risk
- Quick ratio at 0.67 signals weaker short-term liquidity
- Unfavorable asset turnover at 0.46 implies lower sales efficiency
- Dividend yield low at 0.6% may deter income-focused investors
- Relatively lower percentage of favorable financial ratios (42.86%)
Kadant Weaknesses
- Unfavorable valuation multiples: PE at 36.9 and PB at 4.86 imply overvaluation concerns
- Lower net margin at 10.59% compared to AMETEK’s 20%
- Dividend yield low at 0.36% limits income potential
- Neutral asset turnover at 0.74 indicates average operational efficiency
Overall, AMETEK benefits from stronger profitability and financial stability but faces valuation and liquidity challenges. Kadant shows better liquidity and a higher ratio of favorable financial metrics, though its profitability and valuation multiples warrant caution. These factors shape each company’s strategic positioning within their sectors.
The Moat Duel: Analyzing Competitive Defensibility
A structural moat is the only thing protecting long-term profits from relentless competitive erosion. Let’s dissect the moats of AMETEK and Kadant:
AMETEK, Inc.: Diversified Industrial Precision with Cost Advantage
AMETEK leverages a cost advantage rooted in scale and engineering excellence, reflected in a robust 25.4% EBIT margin and growing ROIC above WACC by 2.5%. Its broad market reach and innovative instrumentation deepen this moat in 2026.
Kadant Inc.: Niche Engineering and Process Expertise with Intangible Assets
Kadant’s moat hinges on intangible assets like specialized technologies and client relationships, supporting a solid 44.3% gross margin but a weaker ROIC below WACC by 0.8%. Its expanding automation and fluid systems offer growth, though value creation remains uncertain.
Moat Strength: Cost Leadership vs. Intangible Asset Specialization
AMETEK’s wider moat stands on proven value creation and margin stability, unlike Kadant’s narrower moat hampered by sub-WACC returns despite innovation. AMETEK is better positioned to defend market share through scale and efficiency.
Which stock offers better returns?
Over the past year, AMETEK, Inc. and Kadant Inc. show distinct bullish trends with notable price gains and accelerating momentum in recent months.
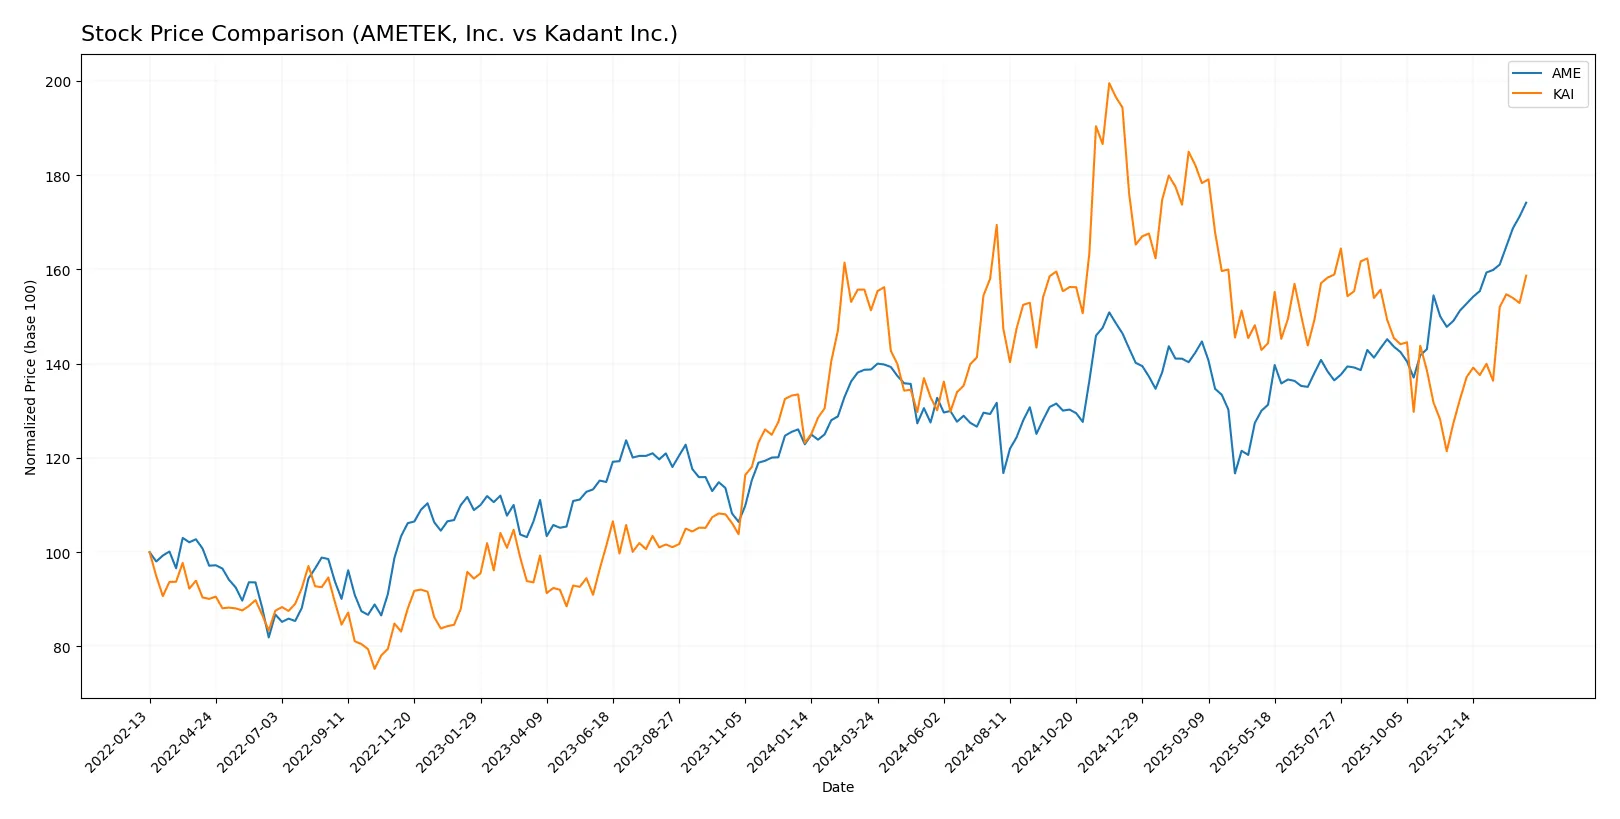
Trend Comparison
AMETEK, Inc. (AME) posts a 25.51% gain over 12 months with accelerating bullish momentum and a price range between 153 and 228. Its recent 16.82% increase confirms sustained strength.
Kadant Inc. (KAI) registers a 4.84% gain over the same period with acceleration but higher volatility, ranging from 255 to 419. Recent gains of 24.57% indicate strong short-term momentum.
Between the two, AMETEK delivers the highest total market return over the year, despite Kadant’s sharper recent surge. AME’s steadier growth dominates overall performance.
Target Prices
Analysts present a confident consensus on target prices for AMETEK, Inc. and Kadant Inc.
| Company | Target Low | Target High | Consensus |
|---|---|---|---|
| AMETEK, Inc. | 204 | 271 | 237.91 |
| Kadant Inc. | 275 | 410 | 342.5 |
The consensus targets imply upside potential: AMETEK’s target is about 4.6% above its current 228 price. Kadant’s target suggests roughly 2.8% upside from 333. These reflect solid market confidence.

Don’t Let Luck Decide Your Entry Point
Optimize your entry points with our advanced ProRealTime indicators. You’ll get efficient buy signals with precise price targets for maximum performance. Start outperforming now!
How do institutions grade them?
AMETEK, Inc. Grades
Here are recent institutional grades for AMETEK, Inc. from recognized analysts:
| Grading Company | Action | New Grade | Date |
|---|---|---|---|
| Keybanc | Maintain | Overweight | 2026-02-04 |
| DA Davidson | Maintain | Buy | 2026-02-04 |
| Barclays | Maintain | Equal Weight | 2026-02-04 |
| Oppenheimer | Downgrade | Perform | 2026-01-27 |
| Morgan Stanley | Maintain | Equal Weight | 2026-01-12 |
| Barclays | Maintain | Equal Weight | 2026-01-07 |
| Keybanc | Maintain | Overweight | 2026-01-07 |
| Keybanc | Maintain | Overweight | 2026-01-06 |
| Mizuho | Maintain | Outperform | 2026-01-05 |
| TD Cowen | Upgrade | Buy | 2025-12-23 |
Kadant Inc. Grades
Below are the recent grades issued by institutional research firms for Kadant Inc.:
| Grading Company | Action | New Grade | Date |
|---|---|---|---|
| Barrington Research | Maintain | Outperform | 2026-02-03 |
| Barrington Research | Maintain | Outperform | 2025-10-30 |
| Barrington Research | Maintain | Outperform | 2025-10-29 |
| Barrington Research | Maintain | Outperform | 2025-10-27 |
| Barrington Research | Maintain | Outperform | 2025-10-10 |
| Barrington Research | Maintain | Outperform | 2025-09-23 |
| DA Davidson | Maintain | Neutral | 2025-08-04 |
| Barrington Research | Maintain | Outperform | 2025-07-30 |
| Barrington Research | Maintain | Outperform | 2025-07-29 |
| Barrington Research | Maintain | Outperform | 2025-05-01 |
Which company has the best grades?
Kadant Inc. consistently receives “Outperform” ratings, indicating stronger analyst conviction than AMETEK’s mixed “Overweight,” “Buy,” and “Equal Weight” grades. This suggests Kadant may enjoy higher institutional confidence, potentially influencing investor sentiment positively.
Risks specific to each company
The following categories identify the critical pressure points and systemic threats facing both firms in the 2026 market environment:
1. Market & Competition
AMETEK, Inc.
- Operates in diverse industrial markets with strong presence but faces margin pressure from competition and innovation demands.
Kadant Inc.
- Niche industrial segments with less scale, facing aggressive competition and pricing pressure.
2. Capital Structure & Debt
AMETEK, Inc.
- Low debt-to-equity (0.21), strong interest coverage (23.13x) indicates a conservative and stable capital structure.
Kadant Inc.
- Higher debt-to-equity (0.38) with moderate interest coverage (8.64x) suggests greater leverage risk but manageable.
3. Stock Volatility
AMETEK, Inc.
- Beta of 1.04 shows stock moves roughly with market, moderate volatility.
Kadant Inc.
- Higher beta of 1.23 implies greater price swings and sensitivity to market changes.
4. Regulatory & Legal
AMETEK, Inc.
- Exposure to aerospace and power sectors increases regulatory scrutiny and compliance costs.
Kadant Inc.
- Industrial processing and material handling face environmental regulations, but limited exposure to high-risk legal areas.
5. Supply Chain & Operations
AMETEK, Inc.
- Global operations expose it to supply chain disruptions but diversified sourcing mitigates risks.
Kadant Inc.
- Smaller scale and specialized products increase vulnerability to supplier disruptions and logistical challenges.
6. ESG & Climate Transition
AMETEK, Inc.
- Advanced instrumentation in energy and aerospace demands strong ESG compliance; climate transition pressures may impact costs.
Kadant Inc.
- Focus on sustainable industrial processing and biodegradable products aligns with ESG trends but transition costs remain.
7. Geopolitical Exposure
AMETEK, Inc.
- Broad global footprint exposes it to geopolitical tensions affecting supply chains and aerospace contracts.
Kadant Inc.
- More US-centric operations reduce geopolitical risk but limit growth in emerging markets.
Which company shows a better risk-adjusted profile?
AME’s conservative capital structure and robust interest coverage reduce financial risk significantly. However, its high valuation multiples and moderate liquidity ratios raise caution. KAI’s stronger liquidity and favorable debt metrics improve resilience, but higher stock volatility and smaller scale increase operational risk. AME’s broad market diversification and superior Altman Z-score (8.15 vs. 6.25) signal stronger financial health. I see AME as having a better risk-adjusted profile despite its valuation premium. The key risk for AME lies in competitive margin pressures, while KAI’s vulnerability centers on stock volatility and scale-related supply chain risks. This analysis reflects AME’s strong balance sheet and diversified revenue as critical strengths in 2026’s uncertain industrial landscape.
Final Verdict: Which stock to choose?
AMETEK, Inc. (AME) excels as a cash-generating powerhouse with a very favorable economic moat, signaling disciplined capital allocation and growing profitability. Its moderate liquidity calls for vigilance, but its strong returns fit well within an aggressive growth portfolio aiming for sustained value creation.
Kadant Inc. (KAI) leverages a strategic moat grounded in improving profitability and solid balance sheet strength, offering a safer harbor with favorable liquidity metrics. While it trails AME in moat robustness, KAI suits GARP investors who appreciate steady growth combined with prudent financial management.
If you prioritize robust value creation and proven competitive advantages, AMETEK outshines due to its very favorable moat and consistent cash flow. However, if you seek better balance sheet safety and moderate growth with less volatility, Kadant provides better stability and a more conservative growth profile. Both present valid scenarios depending on your risk tolerance and portfolio strategy.
Disclaimer: Investment carries a risk of loss of initial capital. The past performance is not a reliable indicator of future results. Be sure to understand risks before making an investment decision.
Go Further
I encourage you to read the complete analyses of AMETEK, Inc. and Kadant Inc. to enhance your investment decisions: