Home > Comparison > Industrials > AME vs JBTM
The strategic rivalry between AMETEK, Inc. and JBT Marel Corporation defines the current trajectory of the industrial machinery sector. AMETEK operates as a diversified capital-intensive manufacturer serving aerospace and process industries. In contrast, JBT Marel focuses on high-tech automation solutions for food processing and packaging. This analysis pits industrial breadth against specialized innovation to reveal which offers superior risk-adjusted returns for a diversified portfolio in 2026.
Table of contents
Companies Overview
AMETEK and JBT Marel Corporation both hold significant roles in the industrial machinery sector, shaping diverse segments globally.
AMETEK, Inc.: Industrial Electronics and Electromechanical Leader
AMETEK dominates as a manufacturer of electronic instruments and electromechanical devices. Its revenue stems from two segments: Electronic Instruments serving aerospace, industrial, and process markets, and Electromechanical providing precision components and motors. In 2026, AMETEK focuses on expanding advanced instrumentation and thermal management solutions, reinforcing its broad industrial footprint.
JBT Marel Corporation: Innovative Food Processing Technology Provider
JBT Marel specializes in technology solutions for the food and beverage industry worldwide. Its core revenue comes from value-added processing equipment and automated material handling systems. In 2026, the company emphasizes enhancing automation and integrated systems across diverse food sectors, aiming to innovate production efficiency and safety.
Strategic Collision: Similarities & Divergences
Both companies excel in industrial machinery but diverge in their end markets—AMETEK leans into aerospace and precision electronics, while JBT Marel targets food processing automation. Their primary battleground is technological innovation and global market penetration. AMETEK offers a diversified industrial portfolio with steady cash flow; JBT Marel presents growth potential via specialized automation in evolving food industries.
Income Statement Comparison
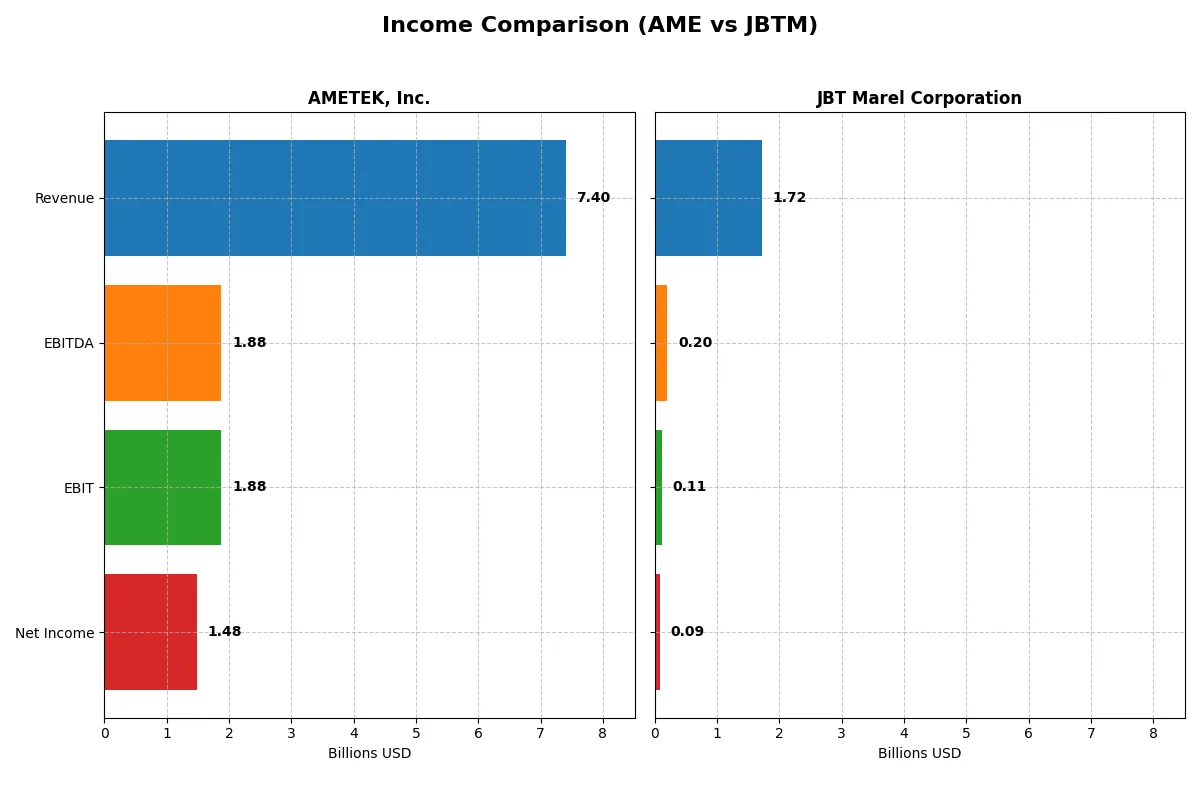
This data dissects the core profitability and scalability of both corporate engines to reveal who dominates the bottom line:
| Metric | AMETEK, Inc. (AME) | JBT Marel Corporation (JBTM) |
|---|---|---|
| Revenue | 7.4B | 1.7B |
| Cost of Revenue | 4.7B | 1.1B |
| Operating Expenses | 757M | 508M |
| Gross Profit | 2.7B | 627M |
| EBITDA | 1.9B | 204M |
| EBIT | 1.9B | 115M |
| Interest Expense | 81M | 19M |
| Net Income | 1.5B | 85M |
| EPS | 6.42 | 2.67 |
| Fiscal Year | 2025 | 2024 |
Income Statement Analysis: The Bottom-Line Duel
This income statement comparison exposes how each company’s operational efficiency and profitability have evolved, revealing their true corporate engines.
AMETEK, Inc. Analysis
AMETEK’s revenue grew steadily from 5.5B in 2021 to 7.4B in 2025, with net income rising from 990M to 1.48B. Its gross margin holds strong at 36.4%, while net margin climbs to 20%, indicating robust profitability. The 2025 results highlight solid momentum and efficient cost control despite moderate revenue growth.
JBT Marel Corporation Analysis
JBT Marel’s revenue showed modest volatility, peaking at 1.7B in 2020 and settling at 1.7B in 2024. Net income fell from 119M in 2021 to 85M in 2024, with net margin near 5%. Despite a favorable gross margin of 36.5%, EBIT and net margin contracted sharply in 2024, reflecting weaker operational efficiency and earnings pressure.
Margin Strength vs. Earnings Resilience
AMETEK outperforms with superior margin expansion and consistent net income growth, whereas JBT Marel struggles with declining profitability and volatile earnings. AMETEK’s high and improving margins offer a clearer fundamental edge. Investors seeking stable profit growth will find AMETEK’s profile more compelling.
Financial Ratios Comparison
These vital ratios act as a diagnostic tool to expose the underlying fiscal health, valuation premiums, and capital efficiency of the companies compared below:
| Ratios | AMETEK, Inc. (AME) | JBT Marel Corporation (JBTM) |
|---|---|---|
| ROE | 13.9% | 5.5% |
| ROIC | 11.0% | 3.7% |
| P/E | 32.0 | 47.6 |
| P/B | 4.45 | 2.63 |
| Current Ratio | 1.06 | 3.48 |
| Quick Ratio | 0.67 | 3.04 |
| D/E | 0.21 | 0.81 |
| Debt-to-Assets | 14.2% | 36.7% |
| Interest Coverage | 23.8 | 6.1 |
| Asset Turnover | 0.46 | 0.50 |
| Fixed Asset Turnover | 6.56 | 7.34 |
| Payout ratio | 19.3% | 15.3% |
| Dividend yield | 0.60% | 0.32% |
| Fiscal Year | 2025 | 2024 |
Efficiency & Valuation Duel: The Vital Signs
Financial ratios act as a company’s DNA, uncovering hidden risks and operational strengths that shape investment decisions.
AMETEK, Inc.
AME delivers solid profitability with a 13.93% ROE and a favorable 20% net margin. Its valuation appears stretched, trading at a high P/E of 31.97 and a P/B of 4.45. Despite a modest 0.6% dividend yield, AME’s capital allocation favors debt management and operational efficiency, balancing growth and shareholder return cautiously.
JBT Marel Corporation
JBTM struggles with lower profitability, posting a 5.53% ROE and a weak 4.98% net margin. The stock looks expensive with a P/E ratio of 47.63, reflecting stretched valuation concerns. The company shows limited dividend yield at 0.32% and prioritizes liquidity and asset turnover, but operational efficiency remains challenged amid elevated debt levels.
Premium Valuation vs. Operational Safety
AME offers better profitability and a more balanced risk profile despite a higher valuation. JBTM’s weaker returns and stretched P/E raise caution. Investors seeking stability and operational efficiency may lean toward AME, while those favoring liquidity might consider JBTM’s cautious asset management.
Which one offers the Superior Shareholder Reward?
I compare AMETEK, Inc. (AME) and JBT Marel Corporation (JBTM) by their dividend yields, payout ratios, and share buyback intensity. AME yields ~0.62% with a consistent payout ratio near 19%, supported by strong free cash flow. JBTM offers a lower 0.32% yield and a ~15% payout but retains substantial cash (38/share) to fund acquisitions and growth. Both run buybacks, yet AME’s buyback program is more aggressive and sustainable given its stable margins (~20% net) and moderate leverage (debt/equity ~0.21). JBTM’s higher debt ratio (~0.81) and thinner margins (~5%) raise concerns over distribution sustainability. I see AME as delivering superior total returns in 2026, blending steady dividends with disciplined capital returns and operational resilience.
Comparative Score Analysis: The Strategic Profile
The radar chart reveals the fundamental DNA and trade-offs of AMETEK, Inc. and JBT Marel Corporation, highlighting their financial strengths and weaknesses:
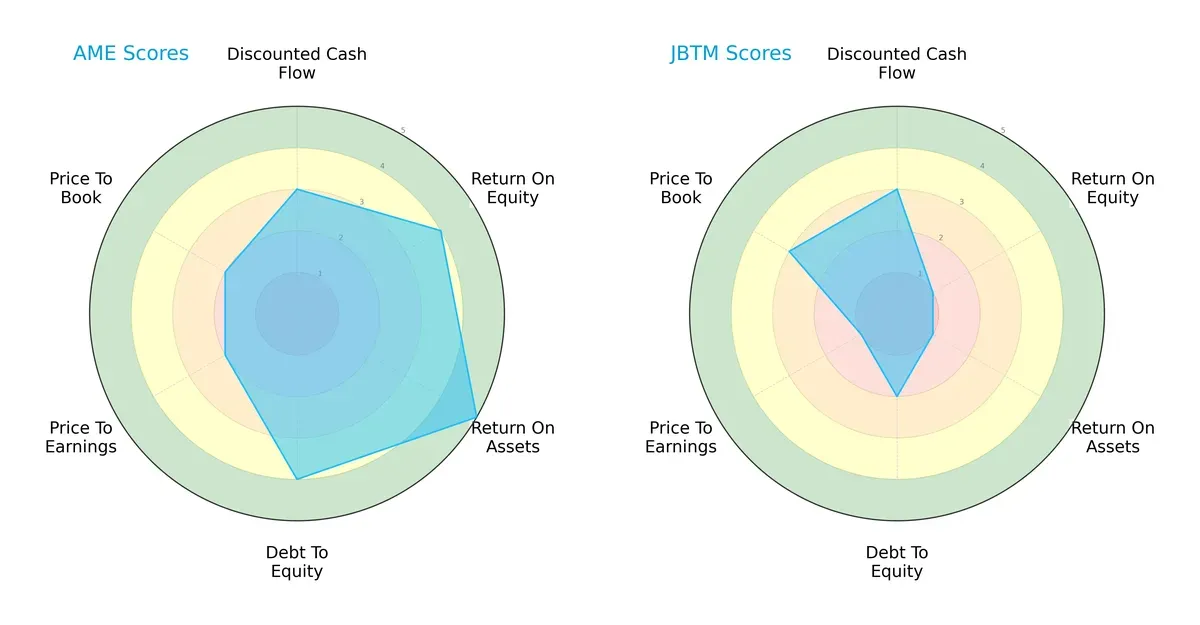
AMETEK displays a balanced profile with strong ROA (5) and ROE (4), and solid debt management (4). Its valuation scores (PE/PB at 2) suggest moderate pricing discipline. JBT relies heavily on moderate DCF (3) but suffers from weak profitability scores (ROE and ROA at 1) and less robust debt control (2). AMETEK’s profile suggests operational efficiency and financial stability, while JBT depends more on valuation bargains and faces profitability challenges.
Bankruptcy Risk: Solvency Showdown
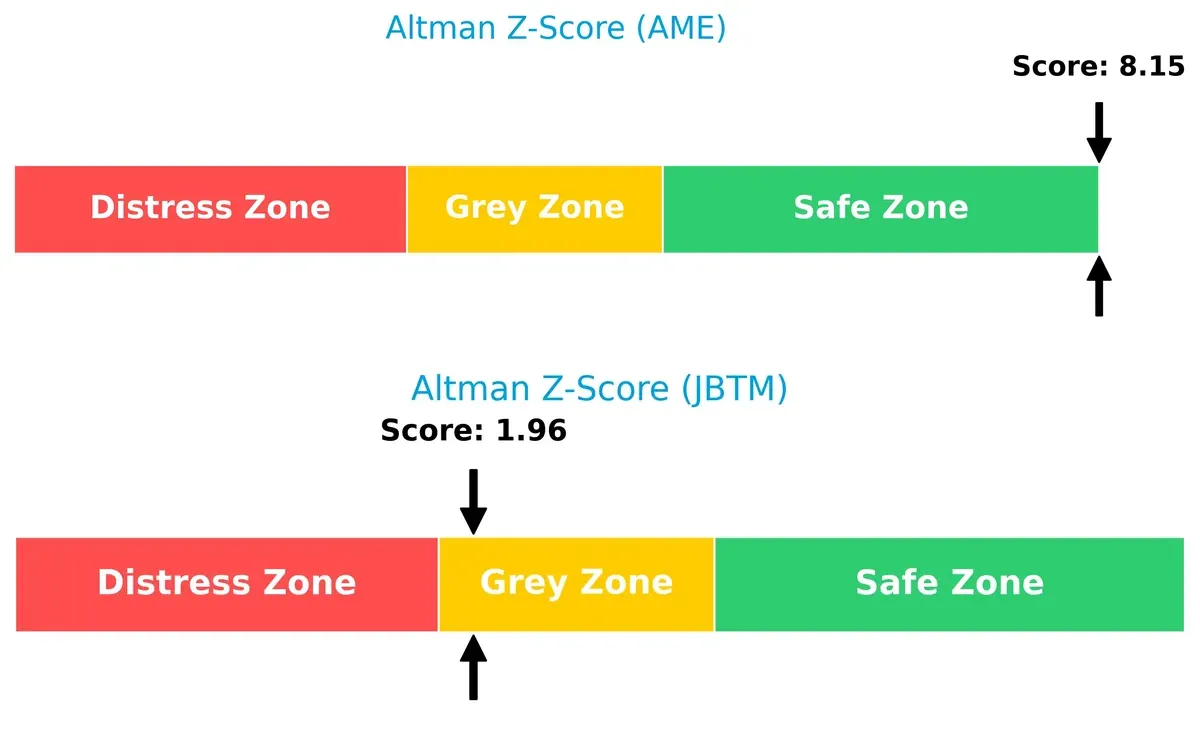
AMETEK’s Altman Z-Score of 8.15 places it firmly in the safe zone, signaling strong long-term solvency. JBT’s score of 1.96 lands in the grey zone, indicating moderate bankruptcy risk and financial caution is warranted:
Financial Health: Quality of Operations
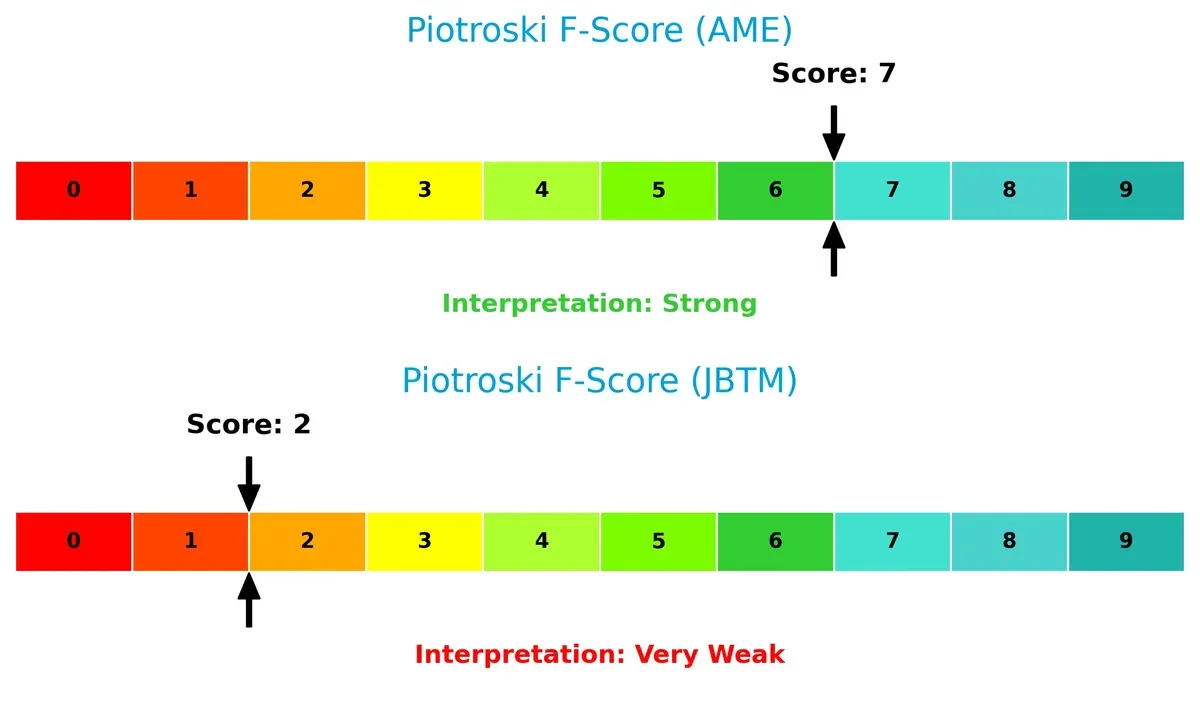
AMETEK’s Piotroski F-Score of 7 reflects strong internal financial health and operational quality. JBT’s low score of 2 signals red flags and potential weakness in profitability and efficiency metrics:
How are the two companies positioned?
This section dissects AMETEK and JBT Marel’s operational DNA by comparing their revenue distribution and internal dynamics. The goal is to confront their economic moats to reveal which model offers the most resilient, sustainable advantage today.
Revenue Segmentation: The Strategic Mix
The following visual comparison dissects how AMETEK, Inc. and JBT Marel Corporation diversify their income streams and reveals their primary sector bets:
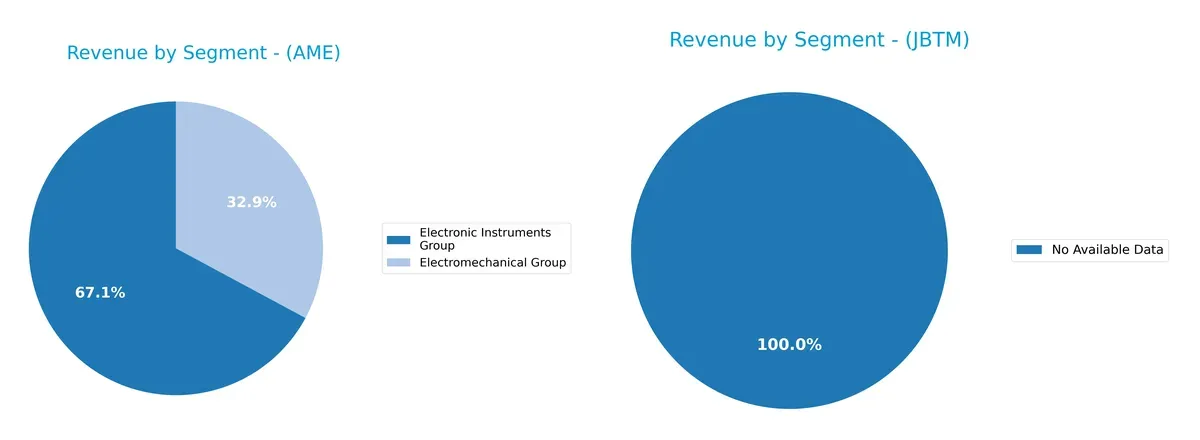
AMETEK, Inc. anchors revenue in two segments: $4.66B from Electronic Instruments and $2.28B from Electromechanical Group in 2024. This blend shows moderate diversification, reducing dependence risk. By contrast, JBT Marel lacks available data, preventing segmentation comparison. AMETEK’s focus on instrumentation suggests strong ecosystem lock-in and resilience, while its balanced mix limits volatility from any single market downturn.
Strengths and Weaknesses Comparison
This table compares the Strengths and Weaknesses of AMETEK, Inc. and JBT Marel Corporation:
AMETEK, Inc. Strengths
- Strong net margin at 20%
- Favorable ROIC at 11.04% over WACC
- Low debt-to-equity at 0.21
- High interest coverage ratio at 23.13
- Diversified revenue from Electromechanical and Electronic Instruments groups
- Global presence with significant US, Asia, and EU sales
JBT Marel Corporation Strengths
- Favorable WACC at 7.5%
- Good quick ratio at 3.04 indicating liquidity
- Favorable interest coverage at 5.92
- Strong fixed asset turnover at 7.34
- Neutral debt-to-equity at 0.81
- Moderate asset turnover at 0.5
AMETEK, Inc. Weaknesses
- Unfavorable PE at 31.97 and PB at 4.45 suggest high valuation
- Quick ratio at 0.67 may indicate liquidity issues
- Low dividend yield at 0.6%
- Asset turnover at 0.46 is relatively weak
- Neutral current ratio at 1.06
- ROE at 13.93% only neutral
JBT Marel Corporation Weaknesses
- Low profitability with net margin of 4.98%
- Weak ROE at 5.53% and ROIC at 3.65%
- Unfavorable PE at 47.63
- High current ratio at 3.48 may indicate inefficient capital use
- Low dividend yield at 0.32%
- Neutral debt-to-assets at 36.68%
AMETEK shows solid profitability and strong financial health but faces valuation and liquidity concerns. JBT Marel struggles with profitability and valuation, offset slightly by liquidity and asset efficiency, highlighting contrasting strategic challenges.
The Moat Duel: Analyzing Competitive Defensibility
A structural moat is the crucial barrier protecting long-term profits from relentless competition erosion. Let’s dissect how it applies to these industrial machinery leaders:
AMETEK, Inc.: Precision Engineering and Diverse End Markets
AMETEK’s moat stems from its intangible assets and diversified portfolio across aerospace, industrial, and electronic instruments. This shows in its very favorable ROIC exceeding WACC by 2.5%, with growing profitability and stable margins in 2025. Expansion into advanced process controls and aerospace sensors may further deepen its moat in 2026.
JBT Marel Corporation: Specialized Food Processing Technology
JBT Marel relies on niche technology solutions and customer relationships in food and beverage processing, contrasting AMETEK’s broader industrial reach. However, its ROIC lags below WACC by nearly 3.9%, with a steep decline over recent years. The company faces risks but could leverage automation trends in food tech for potential rebound in 2026.
Moat Strength: Diversification and Intangible Assets vs. Specialized Technology
AMETEK possesses the deeper, more durable moat, with consistent value creation and margin resilience. JBT Marel’s narrowing competitive edge and declining ROIC highlight vulnerability. AMETEK stands better equipped to defend and grow its market share amid evolving industrial demands.
Which stock offers better returns?
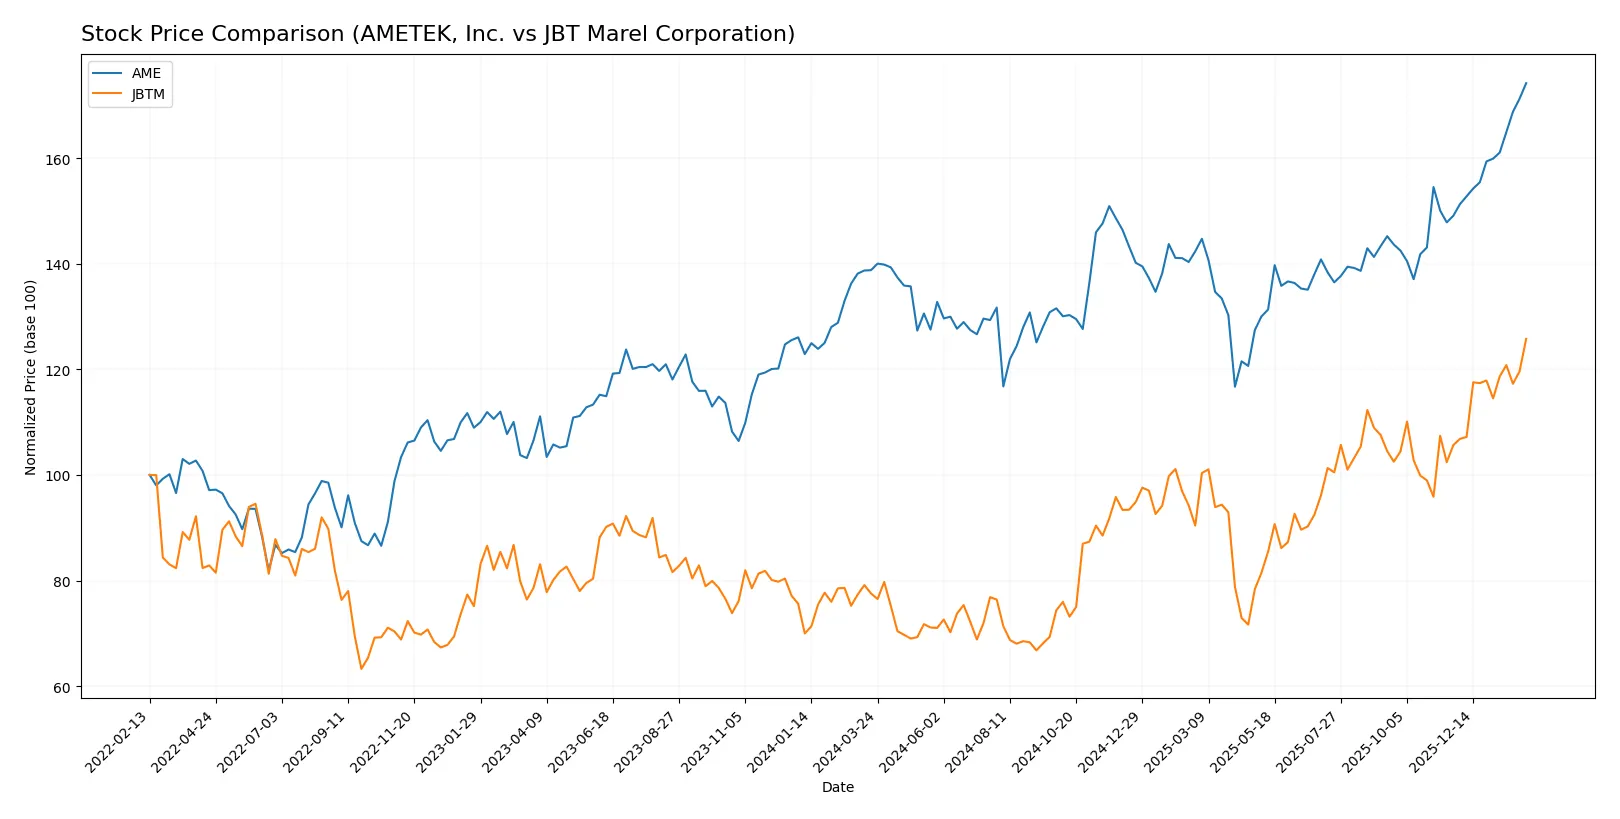
The past year shows pronounced bullish trends for both stocks, with JBT Marel’s price surging sharply and AMETEK steadily accelerating its gains amid rising trading volumes.
Trend Comparison
AMETEK, Inc. (AME) posted a 25.51% price increase over the past 12 months, confirming a bullish, accelerating trend with notable volatility (14.42 std dev) between $153 and $228. Recent months sustained momentum with a 16.82% gain.
JBT Marel Corporation (JBTM) delivered a more robust 62.14% rise over the same period, also accelerating and more volatile (20.71 std dev), with prices ranging from $88 to $165. Recent advances slowed slightly but remain strong at 19.04%.
JBTM’s stock outperformed AME by a wide margin in market returns, despite higher volatility, delivering the strongest price appreciation over the last year.
Target Prices
Analyst consensus suggests moderate upside potential for both AMETEK, Inc. and JBT Marel Corporation.
| Company | Target Low | Target High | Consensus |
|---|---|---|---|
| AMETEK, Inc. | 204 | 271 | 237.91 |
| JBT Marel Corporation | 169 | 180 | 174.5 |
For AMETEK, the consensus target price of $237.91 implies an upside of roughly 4.6% from the current $227.83. JBT Marel’s consensus target of $174.5 suggests a 5.5% increase from its current $165.43. Both stocks reflect moderate analyst optimism relative to current prices.

Don’t Let Luck Decide Your Entry Point
Optimize your entry points with our advanced ProRealTime indicators. You’ll get efficient buy signals with precise price targets for maximum performance. Start outperforming now!
How do institutions grade them?
Here is a summary of recent institutional grades for AMETEK, Inc. and JBT Marel Corporation:
AMETEK, Inc. Grades
The table below lists recent grades and rating actions from reputable institutions for AMETEK, Inc.:
| Grading Company | Action | New Grade | Date |
|---|---|---|---|
| Keybanc | Maintain | Overweight | 2026-02-04 |
| DA Davidson | Maintain | Buy | 2026-02-04 |
| Barclays | Maintain | Equal Weight | 2026-02-04 |
| Oppenheimer | Downgrade | Perform | 2026-01-27 |
| Morgan Stanley | Maintain | Equal Weight | 2026-01-12 |
| Barclays | Maintain | Equal Weight | 2026-01-07 |
| Keybanc | Maintain | Overweight | 2026-01-07 |
| Keybanc | Maintain | Overweight | 2026-01-06 |
| Mizuho | Maintain | Outperform | 2026-01-05 |
| TD Cowen | Upgrade | Buy | 2025-12-23 |
JBT Marel Corporation Grades
Below are the latest grades and rating changes from established institutions for JBT Marel Corporation:
| Grading Company | Action | New Grade | Date |
|---|---|---|---|
| Jefferies | Upgrade | Buy | 2025-12-10 |
| William Blair | Upgrade | Outperform | 2025-08-06 |
Which company has the best grades?
AMETEK, Inc. shows a wider range of grades with multiple firms maintaining Overweight and Buy ratings, despite a recent downgrade. JBT Marel holds fewer but consistently positive upgrades to Buy and Outperform. Investors may find AMETEK’s broader institutional coverage more informative but should consider the recent downgrade risk.
Risks specific to each company
The following categories identify the critical pressure points and systemic threats facing both firms in the 2026 market environment:
1. Market & Competition
AMETEK, Inc.
- Operates diverse industrial markets, faces broad competition in machinery and instruments.
JBT Marel Corporation
- Focused on food and beverage processing technology, competing in a niche but global market.
2. Capital Structure & Debt
AMETEK, Inc.
- Low debt-to-equity ratio (0.21), strong interest coverage (23.13), indicating robust financial stability.
JBT Marel Corporation
- Higher leverage (debt-to-equity 0.81), moderate interest coverage (5.92), suggesting increased financial risk.
3. Stock Volatility
AMETEK, Inc.
- Beta near market average (1.04) implies typical sensitivity to market swings.
JBT Marel Corporation
- Slightly lower beta (0.98) reflects marginally less volatility but still sensitive to market changes.
4. Regulatory & Legal
AMETEK, Inc.
- Subject to standard industrial and aerospace regulations, with no significant legal issues reported.
JBT Marel Corporation
- Faces food safety and health regulations globally, adding compliance complexity and risk.
5. Supply Chain & Operations
AMETEK, Inc.
- Broad global supply chain with potential exposure to raw material price fluctuations.
JBT Marel Corporation
- Dependence on food industry inputs and specialized technology supply chains increases operational risk.
6. ESG & Climate Transition
AMETEK, Inc.
- Industrial footprint requires ongoing adaptation to environmental regulations and energy transition.
JBT Marel Corporation
- Food processing focus demands sustainable practices and responsiveness to climate-related supply constraints.
7. Geopolitical Exposure
AMETEK, Inc.
- US-based but with global operations, exposed to trade tensions and geopolitical shifts.
JBT Marel Corporation
- International footprint in diverse regions increases exposure to geopolitical instability and currency risks.
Which company shows a better risk-adjusted profile?
AMETEK’s strongest risk lies in market competition amid diverse industrial sectors, while JBT Marel faces capital structure vulnerability with higher debt. AMETEK’s safe-zone Altman Z-score and stronger Piotroski score indicate superior financial resilience. Recent data showing AMETEK’s robust interest coverage contrasts with JBT’s moderate coverage, confirming AMETEK’s better risk-adjusted profile.
Final Verdict: Which stock to choose?
AMETEK, Inc. stands out as a cash-generating powerhouse with a robust economic moat. Its strength lies in consistent value creation through efficient capital allocation and improving profitability. A point of vigilance is its relatively high valuation multiples, which could temper near-term upside. It suits portfolios focused on disciplined, long-term growth.
JBT Marel Corporation boasts a strategic moat rooted in operational niche specialization, offering some balance sheet safety with strong liquidity ratios. However, it struggles with declining profitability and value destruction, signaling caution. JBTM fits investors seeking exposure to turnaround stories or speculative growth at a reasonable price.
If you prioritize stable value creation and proven capital efficiency, AMETEK outshines as the compelling choice due to its sustainable competitive advantage. However, if you seek speculative growth with a higher risk tolerance, JBT Marel offers potential upside despite weaker profitability metrics. Each scenario demands careful risk assessment aligned with investor profile.
Disclaimer: Investment carries a risk of loss of initial capital. The past performance is not a reliable indicator of future results. Be sure to understand risks before making an investment decision.
Go Further
I encourage you to read the complete analyses of AMETEK, Inc. and JBT Marel Corporation to enhance your investment decisions: