Home > Comparison > Industrials > AME vs IR
The strategic rivalry between AMETEK, Inc. and Ingersoll Rand Inc. shapes the industrial machinery sector’s future. AMETEK excels as a diversified electronic instruments and electromechanical devices manufacturer, whereas Ingersoll Rand focuses on mission-critical air, fluid, and precision technologies. This clash highlights a battle between broad-based innovation and specialized industrial solutions. This analysis aims to identify which corporate strategy offers superior risk-adjusted returns for a diversified portfolio in 2026.
Table of contents
Companies Overview
AMETEK and Ingersoll Rand stand as pivotal industrial machinery players, shaping multiple global markets.
AMETEK, Inc.: Advanced Instruments and Electromechanical Solutions
AMETEK dominates the industrial instruments space with two segments: Electronic Instruments and Electromechanical. It generates revenue by selling precision instruments for aerospace, power, and industrial sectors, alongside engineered electrical connectors and motion control products. In 2026, AMETEK’s strategic focus centers on expanding its aerospace and power quality monitoring offerings to strengthen its competitive advantage in high-precision markets.
Ingersoll Rand Inc.: Mission-Critical Air and Fluid Technologies
Ingersoll Rand excels in air, fluid, energy, and medical technologies through its Industrial Technologies and Precision Science segments. Its core revenue driver is manufacturing air compressors, fluid transfer systems, and specialized pumps for industrial and medical applications. The 2026 strategy emphasizes innovation in energy-efficient solutions and expanding aftermarket services to capture greater market share in sustainable industrial equipment.
Strategic Collision: Similarities & Divergences
Both firms emphasize mission-critical industrial equipment but diverge in approach: AMETEK focuses on precision instruments and aerospace, while Ingersoll Rand invests heavily in energy-efficient air and fluid systems. Their primary battleground is industrial technology innovation, especially in sustainability and efficiency. This contrast creates distinct investment profiles: AMETEK appeals to precision-focused growth, Ingersoll Rand to energy-conscious industrial modernization.
Income Statement Comparison
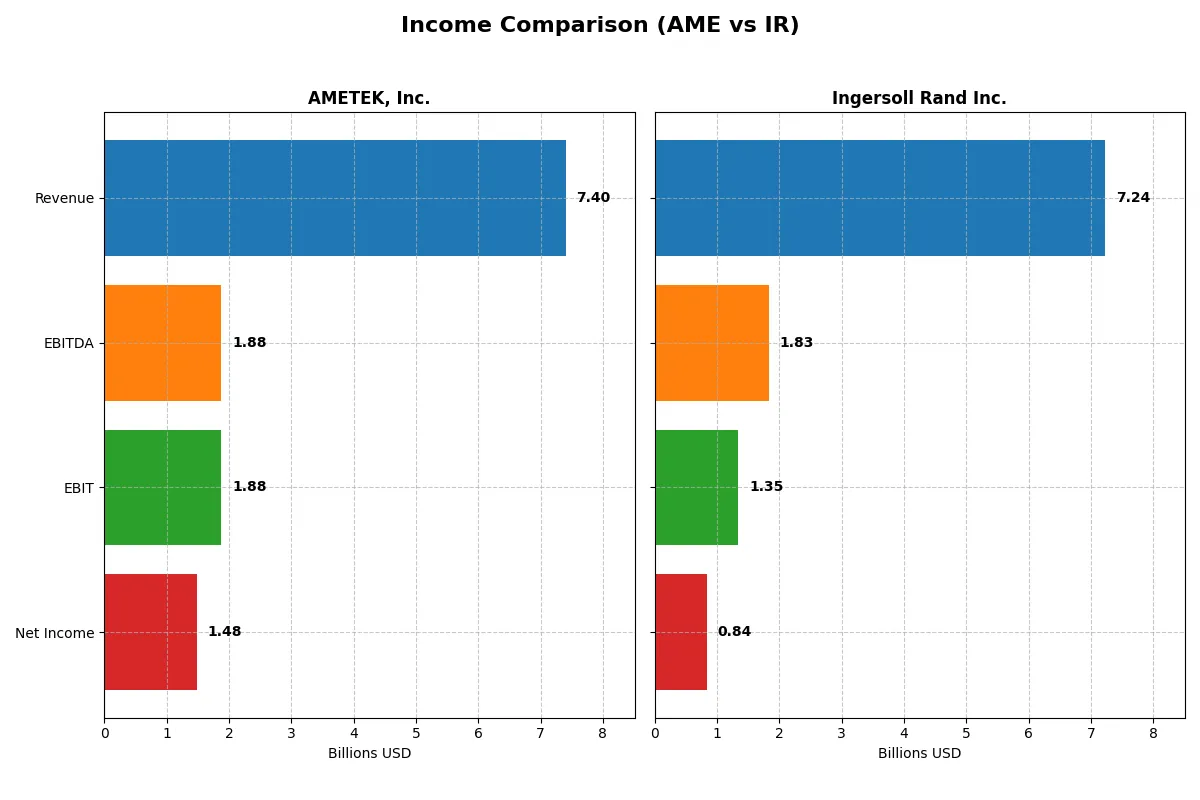
The following data dissects the core profitability and scalability of both corporate engines to reveal who dominates the bottom line:
| Metric | AMETEK, Inc. (AME) | Ingersoll Rand Inc. (IR) |
|---|---|---|
| Revenue | 7.4B | 7.2B |
| Cost of Revenue | 4.7B | 4.1B |
| Operating Expenses | 757M | 1.9B |
| Gross Profit | 2.7B | 3.2B |
| EBITDA | 1.9B | 1.8B |
| EBIT | 1.9B | 1.3B |
| Interest Expense | 81M | 213M |
| Net Income | 1.5B | 839M |
| EPS | 6.42 | 2.08 |
| Fiscal Year | 2025 | 2024 |
Income Statement Analysis: The Bottom-Line Duel
This income statement comparison reveals how efficiently AMETEK, Inc. and Ingersoll Rand Inc. convert revenue into profits and sustain margin strength.
AMETEK, Inc. Analysis
AMETEK’s revenue grew steadily to 7.4B in 2025, with net income rising to 1.48B. The company maintains a strong gross margin of 36.4% and net margin of 20%, reflecting disciplined cost control. Its EBIT margin of 25.4% and favorable EPS growth underline ongoing operational efficiency and momentum.
Ingersoll Rand Inc. Analysis
Ingersoll Rand posted 7.2B revenue in 2024, with net income at 839M. It boasts a higher gross margin of 43.8% but a lower net margin of 11.6%. EBIT margin stands at 18.6%, indicating room for margin improvement despite solid top-line growth and robust net income expansion over the period.
Margin Strength vs. Revenue Growth
AMETEK delivers superior net and EBIT margins, showcasing operational efficiency and consistent profit conversion. Ingersoll Rand leads in revenue growth and gross margin but lags in net profitability. For investors prioritizing margin quality and steady earnings, AMETEK’s profile appears more attractive amidst the income statement duel.
Financial Ratios Comparison
These vital ratios act as a diagnostic tool to expose the underlying fiscal health, valuation premiums, and capital efficiency of the companies compared below:
| Ratios | AMETEK, Inc. (AME) | Ingersoll Rand Inc. (IR) |
|---|---|---|
| ROE | 13.93% | 8.24% |
| ROIC | 11.04% | 6.11% |
| P/E | 31.97 | 43.51 |
| P/B | 4.45 | 3.58 |
| Current Ratio | 1.06 | 2.29 |
| Quick Ratio | 0.67 | 1.71 |
| D/E (Debt/Equity) | 0.21 | 0.49 |
| Debt-to-Assets | 14.21% | 27.65% |
| Interest Coverage | 23.82 | 6.10 |
| Asset Turnover | 0.46 | 0.40 |
| Fixed Asset Turnover | 6.56 | 8.59 |
| Payout Ratio | 19.31% | 3.85% |
| Dividend Yield | 0.60% | 0.09% |
| Fiscal Year | 2025 | 2024 |
Efficiency & Valuation Duel: The Vital Signs
Financial ratios act as the company’s DNA, uncovering hidden risks and revealing operational excellence essential for investment assessment.
AMETEK, Inc.
AMETEK delivers solid profitability with a 13.9% ROE and a strong 20% net margin, signaling operational efficiency. However, its valuation is stretched, with a high P/E of 31.97 and P/B at 4.45. The company offers a modest 0.6% dividend yield, suggesting limited income return but potential reinvestment in growth areas.
Ingersoll Rand Inc.
Ingersoll Rand shows a favorable 11.6% net margin but a weaker 8.2% ROE, indicating less efficient equity use. Its valuation is more stretched with a P/E of 43.5 and a P/B of 3.58. The dividend yield is minimal at 0.09%, reflecting limited shareholder cash returns amid ongoing reinvestment needs.
Premium Valuation vs. Operational Safety
AMETEK balances stronger profitability with a high but justified valuation, while Ingersoll Rand faces greater equity inefficiency despite similar valuation pressures. Investors favoring operational robustness and modest income may lean towards AMETEK; those accepting higher risk for potential growth might consider Ingersoll Rand.
Which one offers the Superior Shareholder Reward?
I see AMETEK offers a higher dividend yield (~0.62%) with a sustainable payout ratio (~19%). Its free cash flow comfortably covers dividends, supporting steady distributions. AMETEK also runs active buybacks, enhancing shareholder returns. Ingersoll Rand’s yield is negligible (~0.09%) with a low payout (~4%), signaling a reinvestment focus. Yet, its buyback intensity lags AMETEK’s. Historically, AMETEK balances yield and buybacks more effectively. I conclude AMETEK delivers the superior total shareholder reward in 2026.
Comparative Score Analysis: The Strategic Profile
The radar chart reveals the fundamental DNA and trade-offs of AMETEK, Inc. and Ingersoll Rand Inc., highlighting their core strengths and vulnerabilities:
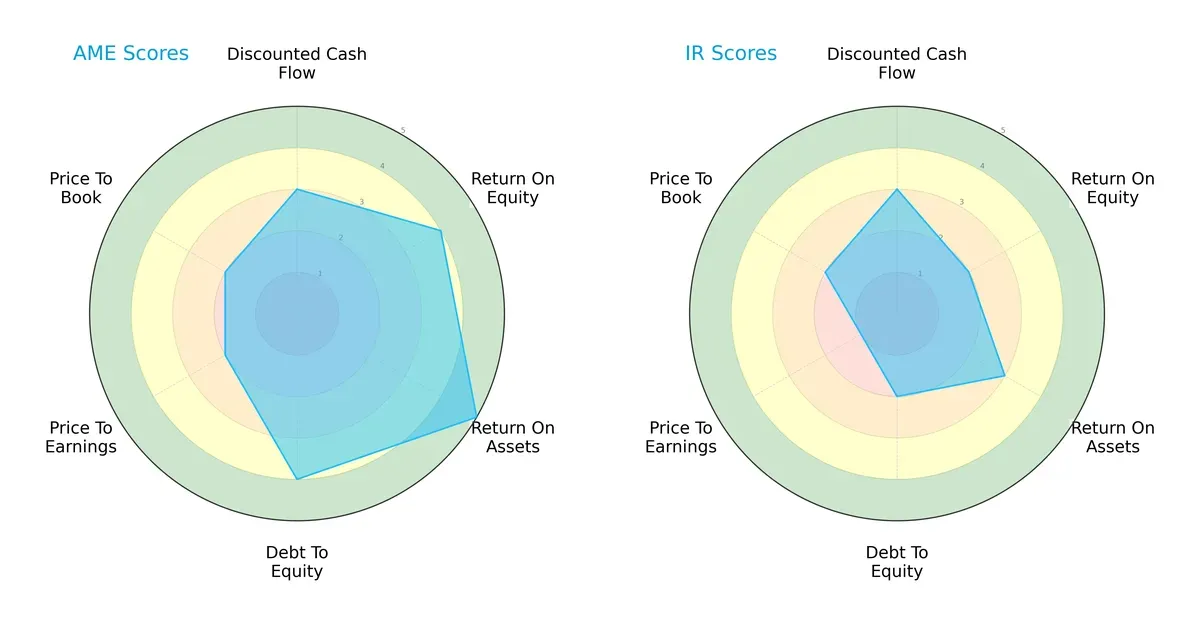
AMETEK exhibits a more balanced financial profile, excelling in ROE (4 vs. 2) and ROA (5 vs. 3), signaling superior profitability and asset efficiency. It also maintains stronger debt discipline (4 vs. 2). In contrast, Ingersoll Rand relies on a moderate DCF score (3 both) but suffers from weak valuation metrics, especially P/E (1 vs. 2). AMETEK’s profile suggests robust operational fundamentals; Ingersoll Rand’s edge is less pronounced and more valuation-driven.
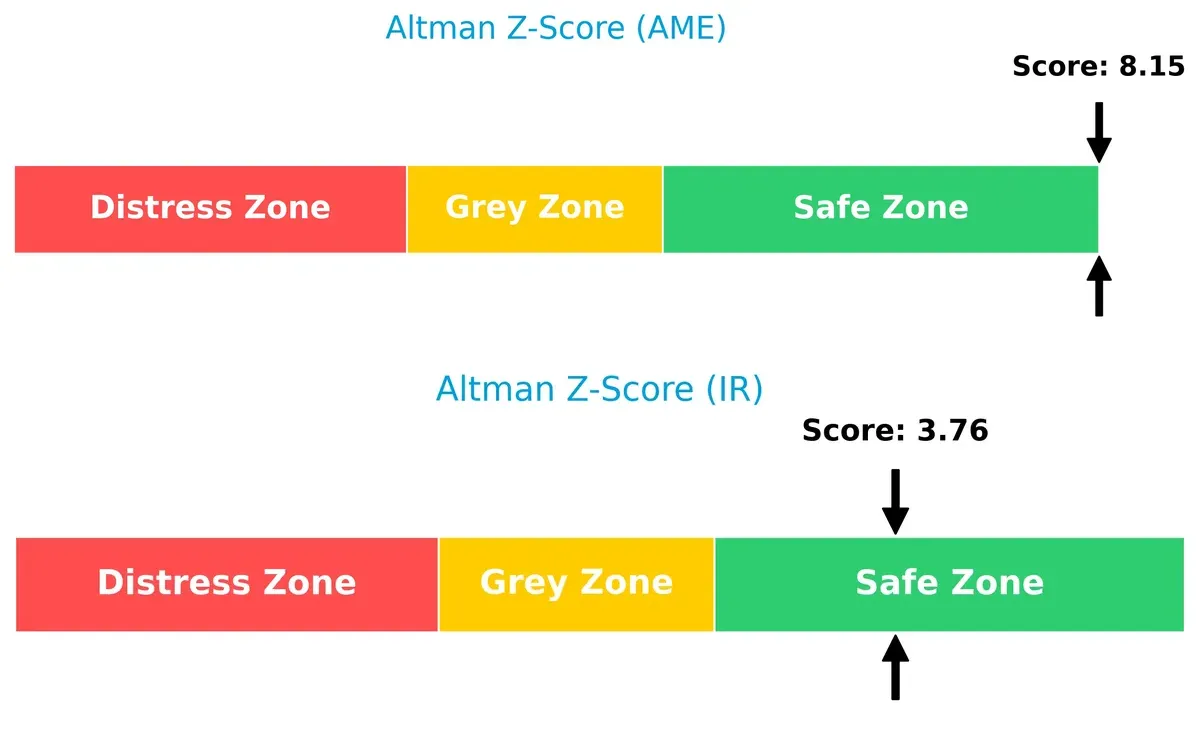
Bankruptcy Risk: Solvency Showdown
AMETEK’s Altman Z-Score (8.15) far exceeds Ingersoll Rand’s (3.76), indicating a much safer financial position. Both are in the safe zone, but AMETEK’s buffer against bankruptcy risk in this cycle is significantly stronger:
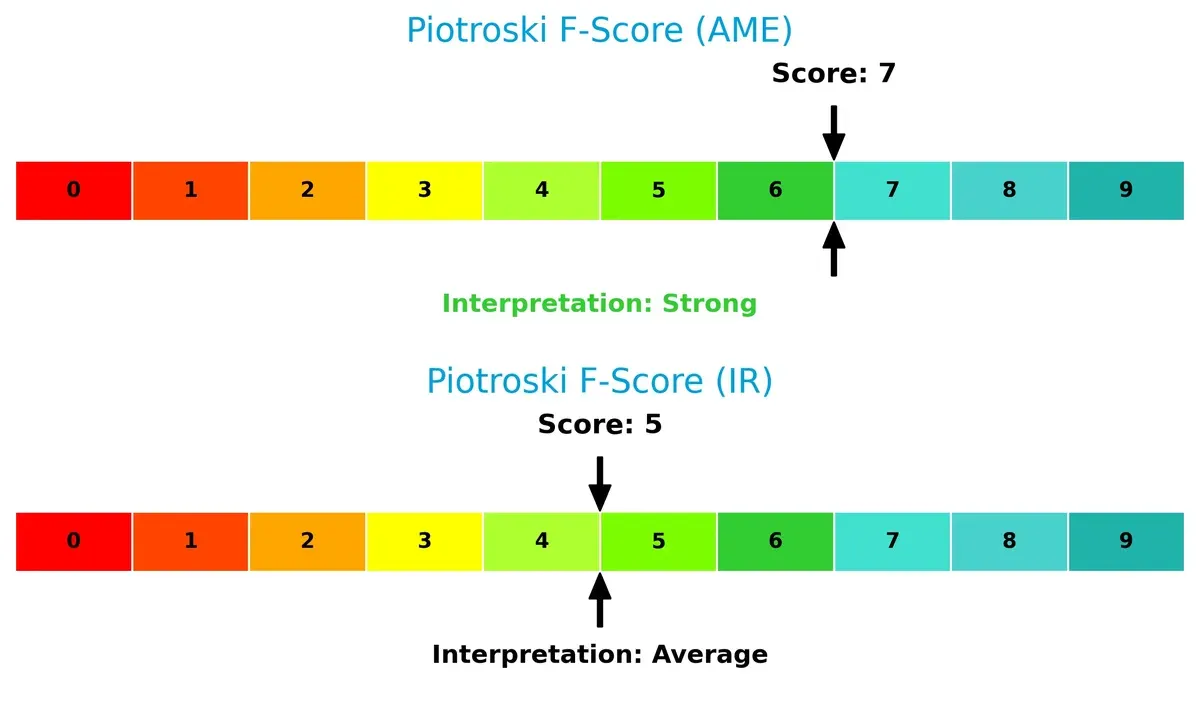
Financial Health: Quality of Operations
AMETEK’s Piotroski F-Score of 7 shows strong operational quality, compared to Ingersoll Rand’s moderate score of 5. AMETEK demonstrates healthier internal metrics and fewer red flags, underscoring superior financial discipline and execution:
How are the two companies positioned?
This section dissects AMETEK and Ingersoll Rand’s operational DNA by comparing revenue distribution and internal dynamics. Our goal is to confront their economic moats and identify which model offers the most resilient competitive advantage today.
Revenue Segmentation: The Strategic Mix
This visual comparison dissects how AMETEK, Inc. and Ingersoll Rand Inc. diversify their income streams and where their primary sector bets lie:
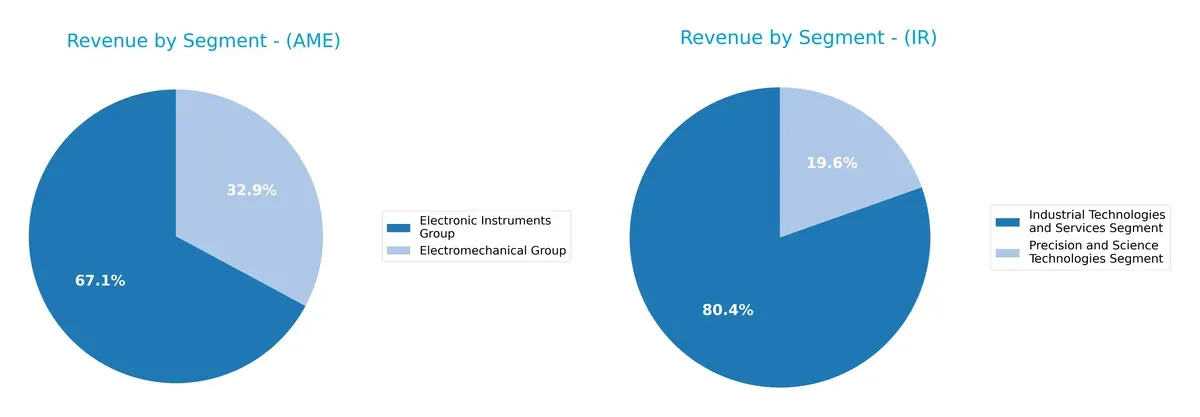
AMETEK anchors its revenue on two balanced pillars: $4.66B from Electronic Instruments and $2.28B from Electromechanical Group. In contrast, Ingersoll Rand pivots heavily on Industrial Technologies and Services at $5.82B, dwarfing its $1.42B Precision and Science segment. AMETEK’s evenly split mix limits concentration risk, while Ingersoll Rand’s dominance in industrial tech suggests infrastructure strength but higher exposure to sector cyclicality.
Strengths and Weaknesses Comparison
This table compares the Strengths and Weaknesses of AMETEK and Ingersoll Rand:
AME Strengths
- Strong profitability with 20% net margin
- Favorable ROIC at 11.04% exceeding WACC
- Low debt-to-equity ratio at 0.21 indicates conservative leverage
- Global revenue diversification across US, Europe, and Asia
- Balanced product segments with Electromechanical and Electronic Instruments
IR Strengths
- Higher current and quick ratios signal strong liquidity
- Favorable interest coverage at 6.31 supports debt servicing
- Greater revenue scale in Industrial Technologies
- Diverse geographic presence with significant Americas and EMEA sales
- Favorable fixed asset turnover at 8.59 indicates efficient use of assets
AME Weaknesses
- Unfavorable valuation multiples with high P/E at 31.97 and P/B at 4.45
- Low quick ratio at 0.67 may constrain short-term flexibility
- Asset turnover at 0.46 lags efficiency benchmarks
- Dividend yield at 0.6% is low for income investors
IR Weaknesses
- Lower profitability with 11.59% net margin and unfavorable ROE at 8.24%
- High P/E ratio of 43.51 and low dividend yield at 0.09%
- Higher debt-to-equity at 0.49 increases financial risk
- Asset turnover at 0.4 indicates weak asset utilization
Both companies show slightly favorable overall financial profiles with contrasting liquidity and leverage approaches. AMETEK’s higher profitability and lower leverage contrast with Ingersoll Rand’s stronger liquidity but weaker returns. These factors influence strategic priorities around capital allocation and operational efficiency.
The Moat Duel: Analyzing Competitive Defensibility
A structural moat is the only shield protecting long-term profits from relentless competitive erosion. Let’s dissect how AMETEK and Ingersoll Rand defend their turf:
AMETEK, Inc.: Precision Engineering with Consistent Value Creation
AMETEK’s moat stems from intangible assets and complex electromechanical designs. It sustains high ROIC at 2.5% above WACC, underpinning margin stability and 12% net margin growth. In 2026, expanding aerospace and industrial markets could deepen this advantage.
Ingersoll Rand Inc.: Turnaround Potential in Industrial Tech
Ingersoll Rand relies on scale and brand in mission-critical air and fluid systems, yet its ROIC lags below WACC, signaling current value destruction despite a sharp ROIC rebound. Its growth in Asia-Pacific and EMEA markets could disrupt competitors if efficiency improves.
Value Creation vs. Turnaround: AMETEK’s Durable Edge
AMETEK exhibits a deeper moat with sustained economic profit and rising ROIC. Ingersoll Rand shows promising recovery but remains a value destroyer. AMETEK is better equipped to defend and extend market share in 2026.
Which stock offers better returns?
Both AMETEK, Inc. (AME) and Ingersoll Rand Inc. (IR) display bullish price momentum over the past year, with notable acceleration phases and rising trading volumes indicating strong investor interest.
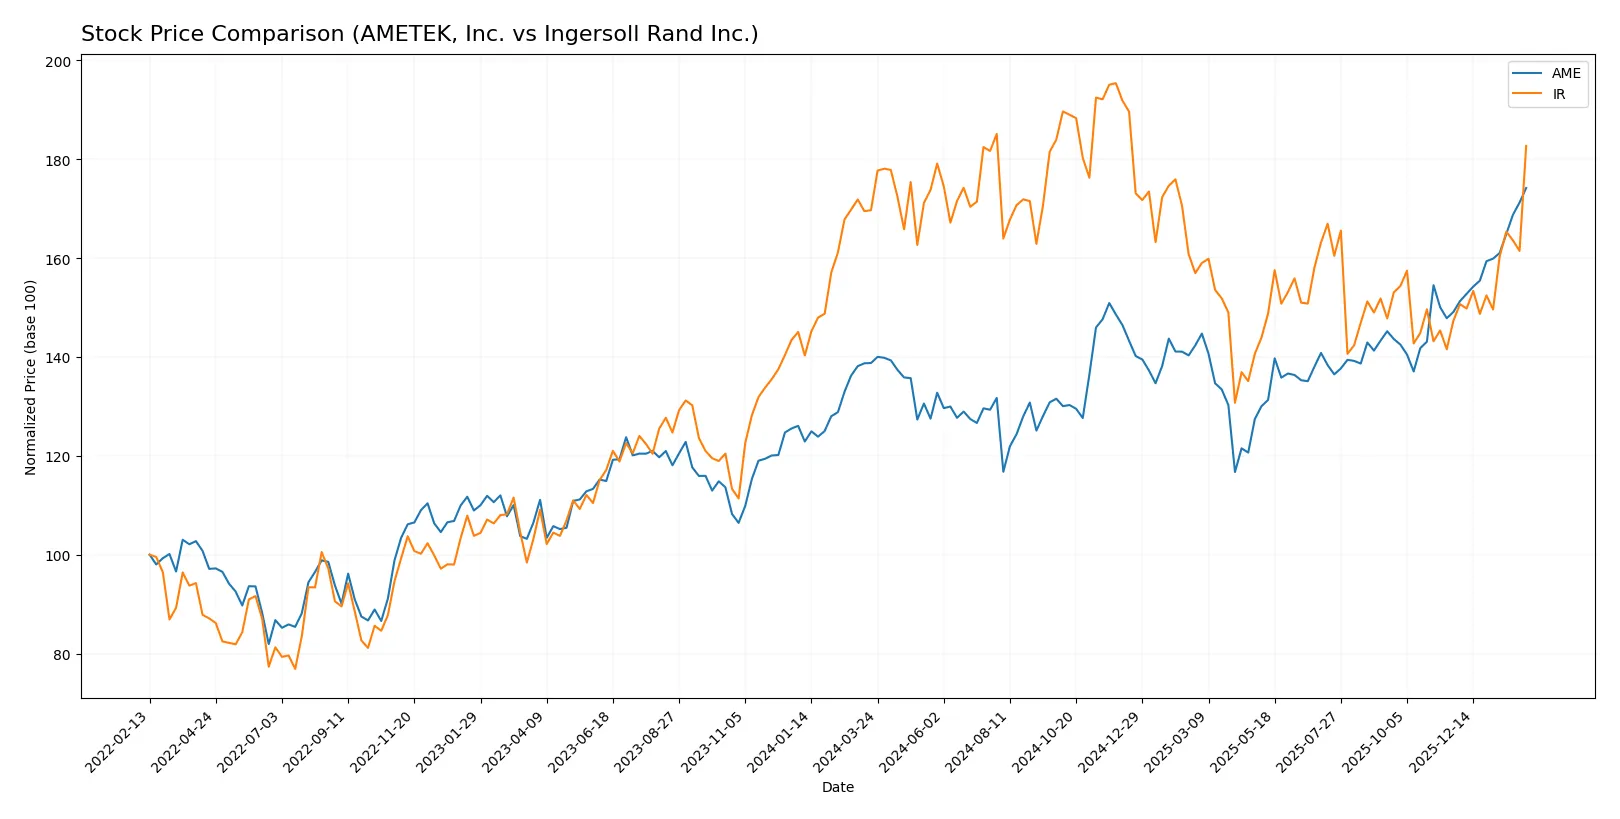
Trend Comparison
AME’s stock gained 25.51% over the last 12 months, showing accelerating bullish momentum and a high of 227.83. Volatility is elevated at 14.42%, reflecting active trading dynamics.
IR’s price rose 7.67% during the same period, also accelerating but with lower volatility at 8.1%. The stock reached a peak of 104.17, confirming steady upward movement.
Comparing trends, AME outperformed IR with a higher total return and stronger price acceleration. AME delivered the superior market performance over the past year.
Target Prices
Analysts present a constructive target price consensus for AMETEK, Inc. and Ingersoll Rand Inc.
| Company | Target Low | Target High | Consensus |
|---|---|---|---|
| AMETEK, Inc. | 204 | 271 | 237.91 |
| Ingersoll Rand Inc. | 87 | 100 | 93 |
The consensus target for AMETEK exceeds its current price of $227.83, implying upside potential. Ingersoll Rand’s target consensus at $93 sits below its current $97.41 price, signaling modest downside risk.

Don’t Let Luck Decide Your Entry Point
Optimize your entry points with our advanced ProRealTime indicators. You’ll get efficient buy signals with precise price targets for maximum performance. Start outperforming now!
How do institutions grade them?
The following tables summarize recent institutional grades for AMETEK, Inc. and Ingersoll Rand Inc.:
AMETEK, Inc. Grades
This table lists recent grades from reputable financial institutions for AMETEK, Inc.
| Grading Company | Action | New Grade | Date |
|---|---|---|---|
| Keybanc | Maintain | Overweight | 2026-02-04 |
| DA Davidson | Maintain | Buy | 2026-02-04 |
| Barclays | Maintain | Equal Weight | 2026-02-04 |
| Oppenheimer | Downgrade | Perform | 2026-01-27 |
| Morgan Stanley | Maintain | Equal Weight | 2026-01-12 |
| Barclays | Maintain | Equal Weight | 2026-01-07 |
| Keybanc | Maintain | Overweight | 2026-01-07 |
| Keybanc | Maintain | Overweight | 2026-01-06 |
| Mizuho | Maintain | Outperform | 2026-01-05 |
| TD Cowen | Upgrade | Buy | 2025-12-23 |
Ingersoll Rand Inc. Grades
This table presents recent institutional grades for Ingersoll Rand Inc.
| Grading Company | Action | New Grade | Date |
|---|---|---|---|
| Stifel | Maintain | Hold | 2026-01-23 |
| Citigroup | Maintain | Buy | 2026-01-12 |
| Wells Fargo | Maintain | Overweight | 2026-01-07 |
| Stifel | Maintain | Hold | 2025-12-16 |
| Citigroup | Maintain | Buy | 2025-12-08 |
| Citigroup | Maintain | Buy | 2025-11-03 |
| Baird | Maintain | Outperform | 2025-11-03 |
| Stifel | Maintain | Hold | 2025-10-20 |
| Wells Fargo | Maintain | Overweight | 2025-10-06 |
| Morgan Stanley | Maintain | Equal Weight | 2025-08-13 |
Which company has the best grades?
AMETEK, Inc. holds a solid mix of Buy and Overweight ratings, with some recent downgrades to Perform. Ingersoll Rand Inc. shows consistent Buy and Overweight grades, with more Hold ratings as well. Investors may interpret AMETEK’s broader range of positive ratings versus Ingersoll Rand’s steadier profile differently according to their risk appetite.
Risks specific to each company
The following categories identify critical pressure points and systemic threats facing AMETEK, Inc. and Ingersoll Rand Inc. in the 2026 market environment:
1. Market & Competition
AMETEK, Inc.
- Operates in diverse industrial markets with advanced instruments and electromechanical devices, facing moderate competitive pressure.
Ingersoll Rand Inc.
- Competes in mission-critical air and fluid technologies across global markets with higher exposure to aggressive competition.
2. Capital Structure & Debt
AMETEK, Inc.
- Low debt-to-equity ratio (0.21) and strong interest coverage (23.13), indicating prudent leverage management.
Ingersoll Rand Inc.
- Higher debt-to-equity ratio (0.49) with adequate interest coverage (6.31), suggesting more leverage risk but manageable.
3. Stock Volatility
AMETEK, Inc.
- Beta near 1.04 implies market-level volatility, with a trading range of 145.02–234.56 showing moderate price swings.
Ingersoll Rand Inc.
- Beta of 1.31 signals higher volatility than the market, combined with a wider trading range of 65.61–99.44.
4. Regulatory & Legal
AMETEK, Inc.
- Operates in regulated sectors like aerospace and medical instruments, facing compliance risks but with established controls.
Ingersoll Rand Inc.
- Exposed to stringent regulations in fluid management and medical technologies, with complexities in multiple regional jurisdictions.
5. Supply Chain & Operations
AMETEK, Inc.
- Complex supply chain across electronics and mechanical components, sensitive to raw material costs and logistics disruptions.
Ingersoll Rand Inc.
- Global supply chain for air and fluid systems vulnerable to geopolitical tensions and component shortages.
6. ESG & Climate Transition
AMETEK, Inc.
- Growing pressure to reduce environmental footprint in manufacturing and aerospace sectors, with moderate progress visible.
Ingersoll Rand Inc.
- Faces significant ESG scrutiny due to energy-intensive products and global footprint, with active climate transition initiatives underway.
7. Geopolitical Exposure
AMETEK, Inc.
- Predominantly US-based operations with moderate international exposure, limiting geopolitical risk.
Ingersoll Rand Inc.
- Wide global presence including Middle East and Asia Pacific, increasing vulnerability to geopolitical instability.
Which company shows a better risk-adjusted profile?
AMETEK’s strongest risk factor is its thin liquidity as reflected in a low quick ratio (0.67), posing short-term operational risk. Ingersoll Rand’s greatest concern lies in elevated stock volatility and higher leverage, increasing financial risk during market downturns. Despite this, AMETEK’s superior Altman Z-Score (8.15) and stronger Piotroski Score (7) reflect a safer financial position. Ingersoll Rand’s lower scores (Altman Z 3.76, Piotroski 5) and higher beta suggest a comparatively riskier profile. The recent surge in IR’s trading volume (+3.94% daily change) underscores heightened market uncertainty, reinforcing the need for caution. Overall, AMETEK demonstrates a better risk-adjusted profile in 2026.
Final Verdict: Which stock to choose?
AMETEK, Inc. wields a powerful combination of strong capital efficiency and a very favorable economic moat, signaling its ability to create sustained value. Its modest liquidity ratios warrant attention but do not overshadow its robust operational returns. This stock suits portfolios seeking steady, long-term growth with a quality edge.
Ingersoll Rand Inc. offers a strategic moat rooted in improving profitability and solid liquidity, providing a cushion against market volatility. While it currently trails AMETEK on returns, its safer balance sheet appeals to more risk-averse investors. It fits well within GARP portfolios aiming for growth balanced with financial prudence.
If you prioritize consistent value creation and operational excellence, AMETEK outshines as the compelling choice due to its sustainable competitive advantage and higher returns. However, if you seek a more conservative growth approach with stronger liquidity, Ingersoll Rand offers better stability despite its slower value creation. Both present credible scenarios depending on your risk tolerance and investment horizon.
Disclaimer: Investment carries a risk of loss of initial capital. The past performance is not a reliable indicator of future results. Be sure to understand risks before making an investment decision.
Go Further
I encourage you to read the complete analyses of AMETEK, Inc. and Ingersoll Rand Inc. to enhance your investment decisions: