Home > Comparison > Industrials > ITW vs AME
The strategic rivalry between Illinois Tool Works Inc. and AMETEK, Inc. shapes the industrial machinery sector’s evolution. Illinois Tool Works operates a diversified, capital-intensive model across automotive, food equipment, and construction markets. In contrast, AMETEK focuses on high-tech electronic instruments and electromechanical devices with strong aerospace and industrial applications. This analysis pits broad industrial manufacturing against specialized instrumentation to identify which trajectory offers superior risk-adjusted returns for a balanced portfolio.
Table of contents
Companies Overview
Illinois Tool Works and AMETEK stand as influential players in the industrial machinery sector, shaping global manufacturing trends.
Illinois Tool Works Inc.: Diverse Industrial Powerhouse
Illinois Tool Works dominates with a diversified industrial portfolio spanning automotive, food equipment, welding, and polymers. Its revenue stems from manufacturing and selling specialized components and machinery globally. In 2026, the company emphasizes expanding engineered fastening systems and specialty products, leveraging its broad market reach and innovation to sustain competitive advantage.
AMETEK, Inc.: Precision and Electronics Specialist
AMETEK focuses on electronic instruments and electromechanical devices, serving aerospace, industrial, and process markets. Its revenue comes from advanced instrumentation and precision motion controls. The 2026 strategy centers on enhancing its Electronic Instruments and Electromechanical segments, targeting growth through technological sophistication and niche applications in aerospace and industrial sectors.
Strategic Collision: Similarities & Divergences
Both companies excel in industrial machinery but diverge strategically. Illinois Tool Works pursues a broad industrial diversification, while AMETEK specializes in precision electronics and instrumentation. Their main battleground is industrial innovation and market penetration in complex manufacturing segments. Investment profiles differ: ITW offers stability through scale and diversity, whereas AME presents growth potential via technological depth and focused end markets.
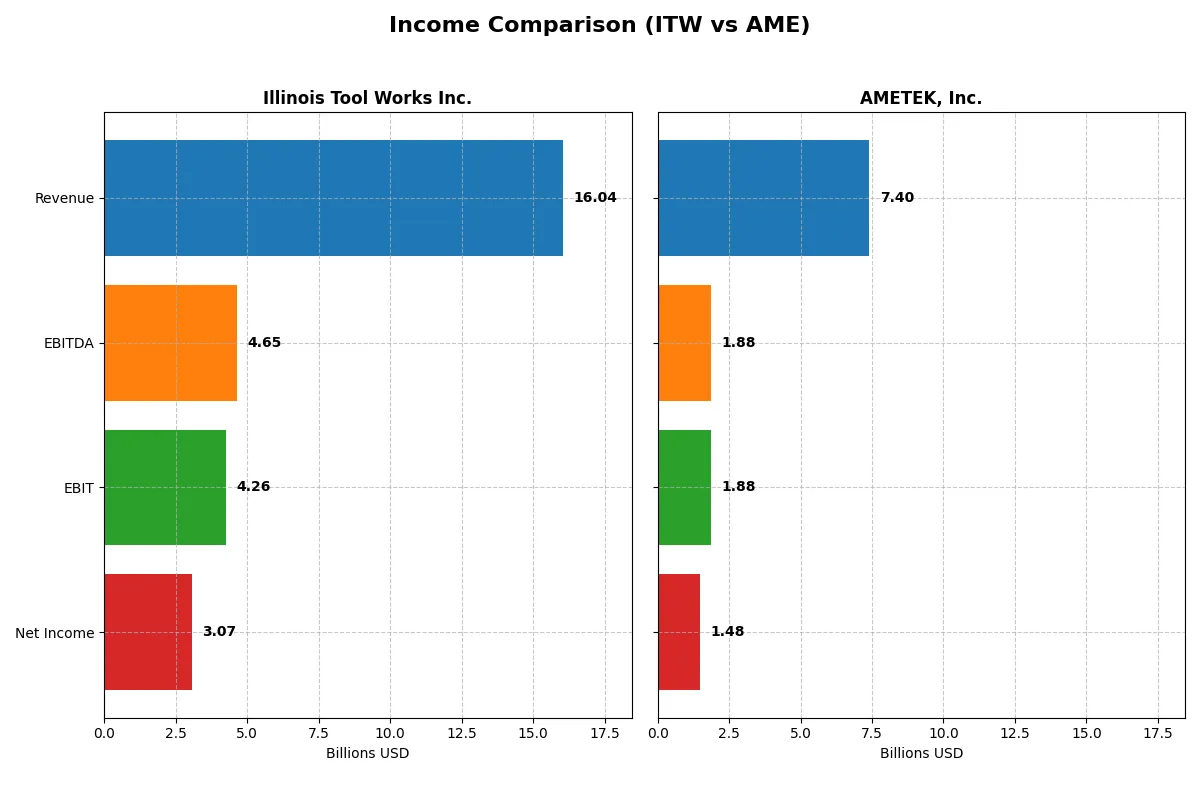
Income Statement Comparison
This data dissects the core profitability and scalability of both corporate engines to reveal who dominates the bottom line:
| Metric | Illinois Tool Works Inc. (ITW) | AMETEK, Inc. (AME) |
|---|---|---|
| Revenue | 16B | 7.4B |
| Cost of Revenue | 9B | 4.7B |
| Operating Expenses | 2.9B | 757M |
| Gross Profit | 7.1B | 2.7B |
| EBITDA | 4.6B | 1.9B |
| EBIT | 4.3B | 1.9B |
| Interest Expense | 292M | 81M |
| Net Income | 3.1B | 1.5B |
| EPS | 10.52 | 6.42 |
| Fiscal Year | 2025 | 2025 |
Income Statement Analysis: The Bottom-Line Duel
This income statement comparison reveals which corporate engine drives superior efficiency and profitability through recent market cycles.
Illinois Tool Works Inc. Analysis
Illinois Tool Works (ITW) shows stable revenue rising from 14.5B in 2021 to 16B in 2025, with net income growth from 2.7B to 3.1B. Its gross margin hovers favorably around 44%, while net margins hold a solid 19%. Despite a slight dip in EBIT and EPS growth in 2025, ITW sustains operational strength and margin discipline.
AMETEK, Inc. Analysis
AMETEK’s revenue expanded robustly from 5.5B in 2021 to 7.4B in 2025, with net income climbing sharply from 990M to 1.48B. Gross margin remains healthy at 36%, and net margin exceeds ITW at 20%. Earnings and EBIT growth show positive momentum in 2025, highlighting AMETEK’s accelerating efficiency and expanding profitability.
Margin Discipline vs. Growth Momentum
ITW delivers higher gross margins and consistent net profitability, but its recent earnings growth falters. AMETEK outpaces ITW on revenue and net income growth with solid margin expansion. For investors, ITW offers steadier margin control; AMETEK presents a more dynamic growth profile suited for those prioritizing upward momentum.
Financial Ratios Comparison
These vital ratios act as a diagnostic tool to expose the underlying fiscal health, valuation premiums, and capital efficiency of each company:
| Ratios | Illinois Tool Works Inc. (ITW) | AMETEK, Inc. (AME) |
|---|---|---|
| ROE | 95.07% | 13.93% |
| ROIC | 24.49% | 11.04% |
| P/E | 23.48 | 31.97 |
| P/B | 22.32 | 4.45 |
| Current Ratio | 1.21 | 1.06 |
| Quick Ratio | 0.89 | 0.67 |
| D/E | 2.78 | 0.21 |
| Debt-to-Assets | 55.54% | 14.21% |
| Interest Coverage | 14.44 | 23.82 |
| Asset Turnover | 0.99 | 0.46 |
| Fixed Asset Turnover | 7.19 | 6.56 |
| Payout Ratio | 58.25% | 19.31% |
| Dividend Yield | 2.48% | 0.60% |
| Fiscal Year | 2025 | 2025 |
Efficiency & Valuation Duel: The Vital Signs
Ratios act as the company’s DNA, revealing hidden risks and operational excellence that numbers alone fail to capture.
Illinois Tool Works Inc.
Illinois Tool Works posts a stellar ROE of 95.07%, signaling exceptional profitability and capital efficiency. Its net margin at 19.11% confirms operational strength. The stock trades at a moderate P/E of 23.48, though a high P/B of 22.32 and elevated debt ratios raise caution. A 2.48% dividend yield rewards shareholders steadily.
AMETEK, Inc.
AMETEK delivers a solid 20% net margin but a modest ROE of 13.93%, reflecting lower equity returns. The valuation appears stretched with a P/E near 32 and a P/B of 4.45. Debt levels remain low and manageable. However, its low dividend yield of 0.6% suggests a conservative shareholder return, leaning on growth investments.
Premium Valuation vs. Operational Safety
Illinois Tool Works balances robust returns and a fair valuation but carries higher leverage risk. AMETEK’s valuation seems expensive relative to its profitability, though its conservative debt profile offers safety. Investors favoring strong capital efficiency may lean toward Illinois Tool Works, while risk-averse profiles might prefer AMETEK’s conservative balance sheet.
Which one offers the Superior Shareholder Reward?
I compare Illinois Tool Works (ITW) and AMETEK (AME) by their dividend yields, payout ratios, and buyback intensity. ITW yields 2.48% with a 58% payout ratio, supported by strong free cash flow coverage. AME offers a modest 0.6% yield and a low 19% payout, prioritizing reinvestment. ITW’s substantial buyback activity complements its dividend, enhancing total return sustainably. AME, with lower leverage and a focus on growth, delivers less immediate income but potential capital appreciation. For 2026, I see ITW offering the superior total shareholder reward due to its balanced, cash-backed distribution strategy and aggressive buybacks.
Comparative Score Analysis: The Strategic Profile
The radar chart reveals the fundamental DNA and trade-offs of Illinois Tool Works Inc. and AMETEK, Inc., highlighting their core financial strengths and vulnerabilities:
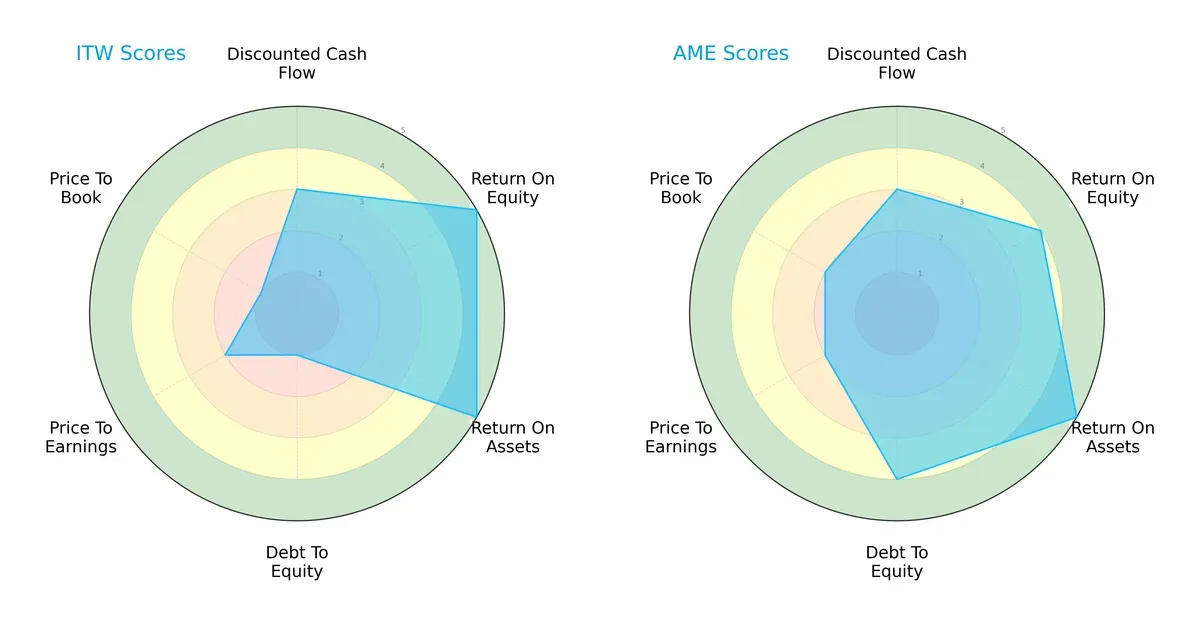
Illinois Tool Works excels in return on equity and assets, showing operational efficiency. However, it carries significant financial risk with a very unfavorable debt-to-equity profile. AMETEK displays a more balanced financial structure, combining solid asset utilization with better leverage management. While both have moderate valuations, AMETEK’s stronger debt metrics position it as the more stable choice.
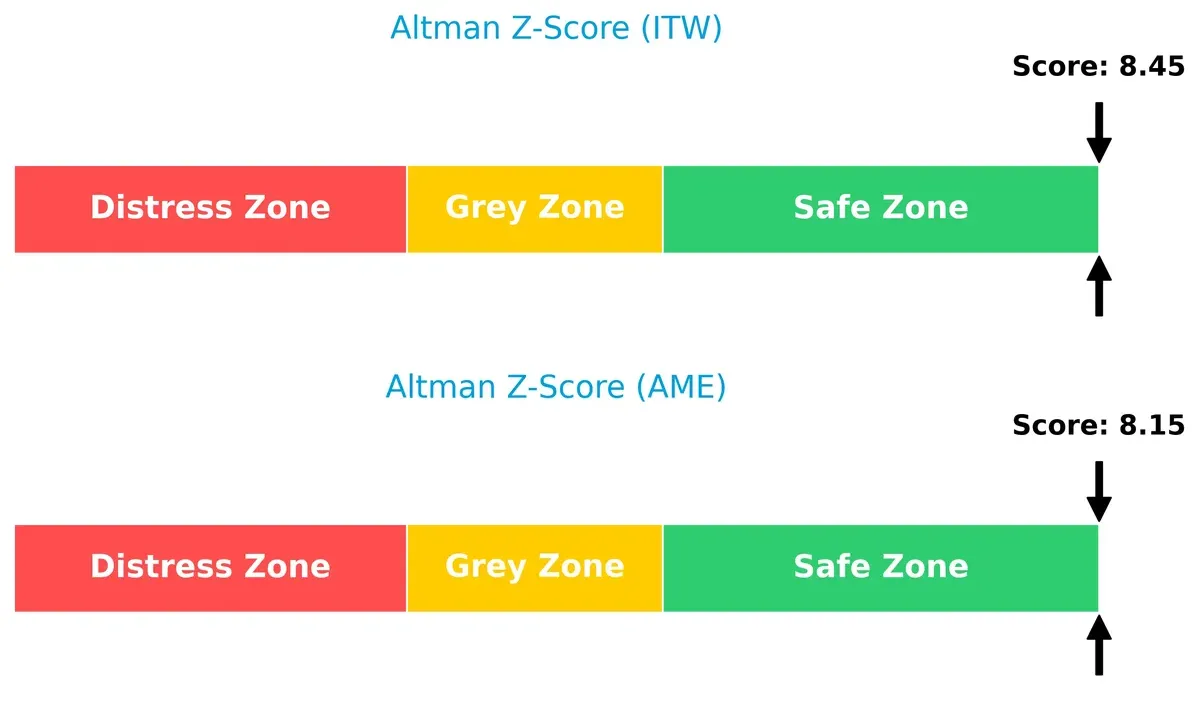
Bankruptcy Risk: Solvency Showdown
The Altman Z-Scores place both firms firmly in the safe zone, indicating low bankruptcy risk and solid long-term survival prospects in this economic cycle:
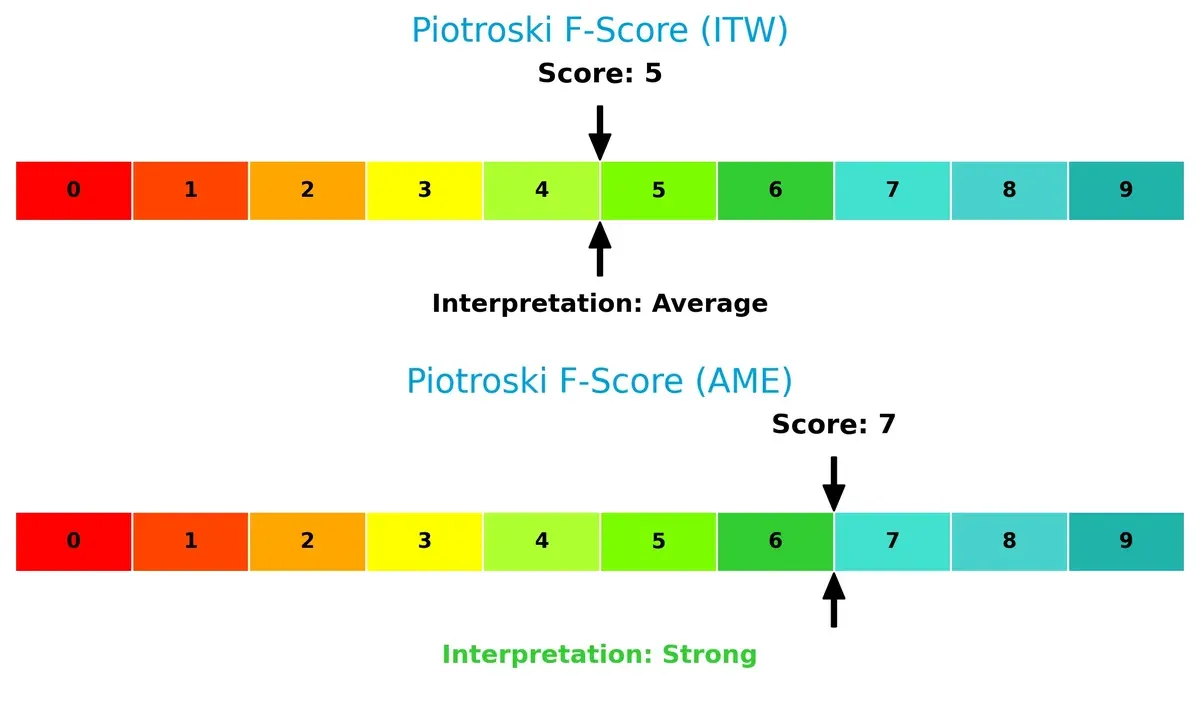
Financial Health: Quality of Operations
AMETEK’s higher Piotroski F-Score signals stronger internal financial health compared to Illinois Tool Works, which shows average quality and some red flags in operational metrics:
How are the two companies positioned?
This section dissects the operational DNA of ITW and AME by comparing their revenue distribution by segment and internal dynamics. The goal is to confront their economic moats and identify which model offers the most resilient competitive advantage today.
Revenue Segmentation: The Strategic Mix
This visual comparison dissects how Illinois Tool Works Inc. and AMETEK, Inc. diversify their income streams and where their primary sector bets lie:
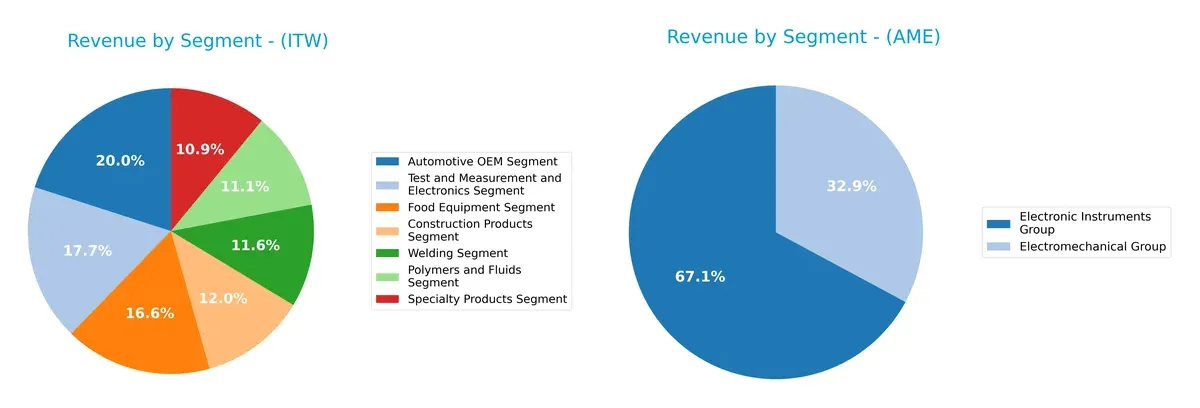
Illinois Tool Works boasts a broad revenue base with seven distinct segments generating between $1.7B and $3.2B, reflecting strong diversification. AMETEK relies heavily on two segments, with Electronic Instruments Group anchoring $4.7B and Electromechanical Group contributing $2.3B. ITW’s diverse portfolio reduces concentration risk, while AMETEK’s focus signals potential strength in specialized instruments but exposes it to sector cyclicality.
Strengths and Weaknesses Comparison
This table compares the strengths and weaknesses of Illinois Tool Works Inc. (ITW) and AMETEK, Inc. (AME):
ITW Strengths
- Diversified revenue across seven segments
- High profitability with 19.11% net margin
- Strong ROIC at 24.49%, exceeding WACC
- Solid interest coverage at 14.58x
- Large global presence, especially in North America and Europe
- Favorable fixed asset turnover at 7.19
AME Strengths
- Favorable net margin at 20.0%
- Lower debt levels with D/E of 0.21 and 14.21% debt to assets
- Strong interest coverage at 23.13x
- Favorable ROIC at 11.04%
- Significant revenues from Electronic Instruments Group
- Growing presence in Asia and US markets
ITW Weaknesses
- High leverage with D/E of 2.78 and 55.54% debt to assets
- Unfavorable price-to-book ratio at 22.32
- Neutral liquidity ratios with quick ratio below 1
- Moderate asset turnover at 0.99
- Dividend yield relatively higher, implying payout risks
AME Weaknesses
- Elevated valuation with P/E of 31.97 and unfavorable PB at 4.45
- Low quick ratio of 0.67 signals liquidity risk
- Unfavorable asset turnover at 0.46
- Low dividend yield at 0.6%
- ROE weaker at 13.93% compared to ITW
Both companies show slightly favorable global ratio profiles but differ in capital structure and operational efficiency. ITW’s high leverage contrasts with AME’s conservative debt, impacting risk and flexibility. Their diversification and geographic reach support resilience, yet valuation and liquidity weaknesses warrant careful monitoring in portfolio strategy.
The Moat Duel: Analyzing Competitive Defensibility
A structural moat shields long-term profits from relentless competitive pressure and market shifts. Here’s how Illinois Tool Works and AMETEK defend their turf:
Illinois Tool Works Inc. (ITW): Diversified Operational Moat
ITW leverages a broad portfolio spanning automotive to food equipment, building high switching costs and stable margins. Its 15.8% ROIC above WACC signals strong value creation. New industrial tech and global expansion in 2026 can deepen this moat.
AMETEK, Inc. (AME): Specialized Innovation Moat
AME’s competitive edge rests on advanced instruments and electromechanical precision, driving a solid 2.5% ROIC excess over WACC. Unlike ITW’s scale, AME’s moat thrives on niche market expertise and innovation, with aerospace and power sectors offering growth catalysts in 2026.
Scale and Innovation: ITW’s Broad Moat vs. AME’s Specialized Edge
ITW’s wider moat arises from diversified segments and stronger ROIC advantage. AME’s innovation-driven moat, while growing, remains narrower. ITW stands better positioned to sustain and defend its market share amid competitive challenges.
Which stock offers better returns?
The past year shows strong upward momentum for both stocks, with AMETEK, Inc. exhibiting a sharper rise and Illinois Tool Works Inc. displaying steady acceleration and buyer dominance.
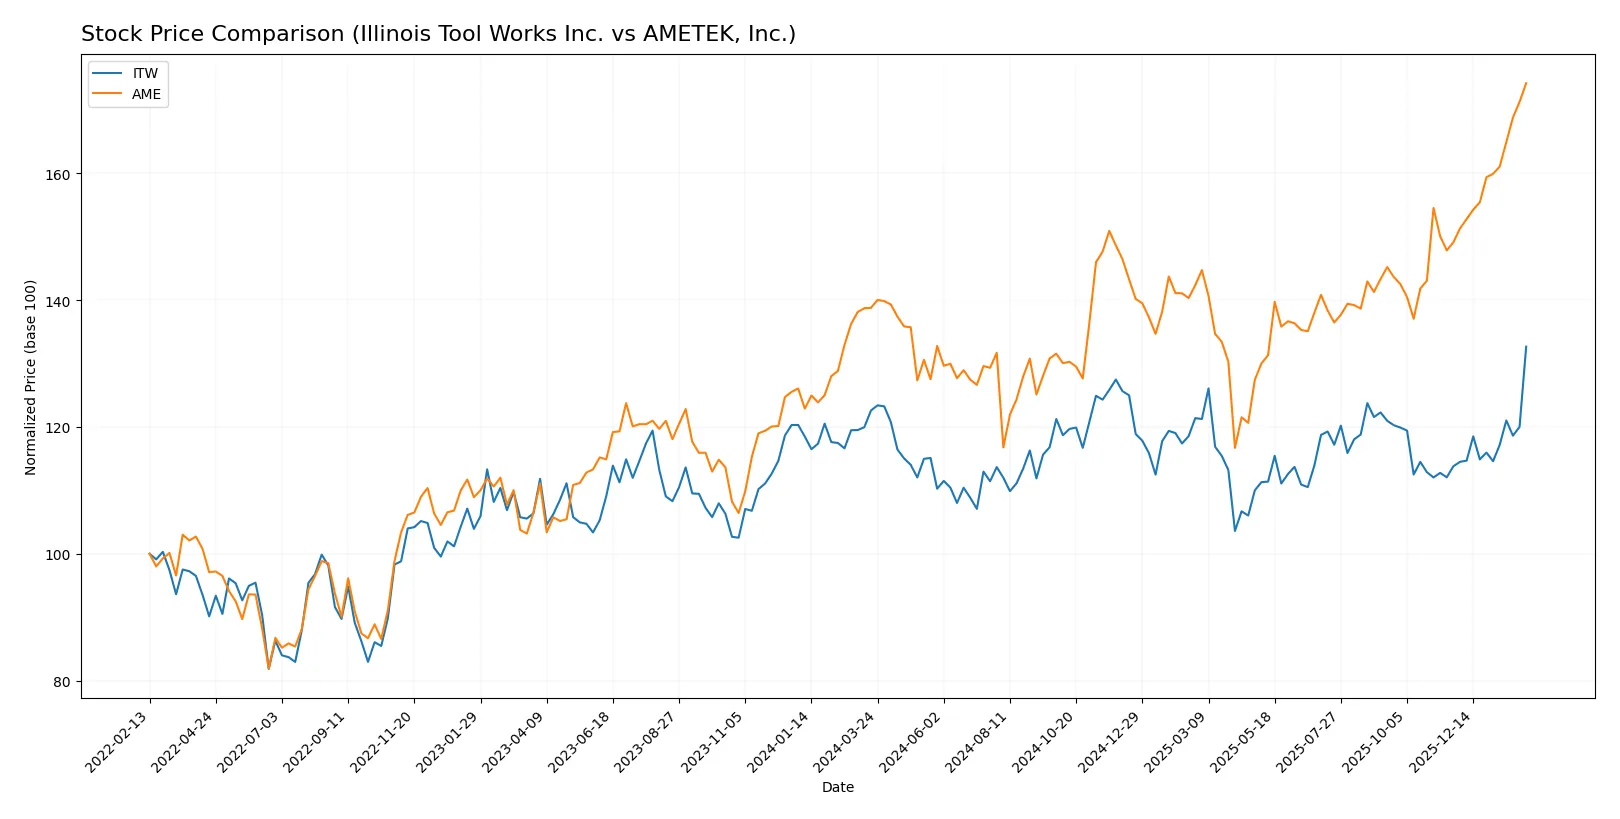
Trend Comparison
Illinois Tool Works Inc. (ITW) recorded an 8.2% price increase over 12 months, marking a bullish trend with accelerating gains and a high near 288.8. Volatility remains moderate at 11.25%.
AMETEK, Inc. (AME) surged 25.51% over the same period, reflecting a stronger bullish trend with acceleration. It reached a high of 227.83 and experienced higher volatility at 14.42%.
Comparing trends, AMETEK delivered the highest market performance with a 25.51% gain, outperforming Illinois Tool Works’ 8.2% increase over the past year.
Target Prices
Analysts provide a moderate upside consensus for both Illinois Tool Works Inc. and AMETEK, Inc.
| Company | Target Low | Target High | Consensus |
|---|---|---|---|
| Illinois Tool Works Inc. | 244 | 285 | 267.86 |
| AMETEK, Inc. | 204 | 271 | 237.91 |
The consensus targets suggest potential gains for AMETEK from its current 228 price, while Illinois Tool Works trades slightly above its target consensus of 268, indicating limited near-term upside.

Don’t Let Luck Decide Your Entry Point
Optimize your entry points with our advanced ProRealTime indicators. You’ll get efficient buy signals with precise price targets for maximum performance. Start outperforming now!
How do institutions grade them?
Illinois Tool Works Inc. Grades
The table below shows recent grades assigned to Illinois Tool Works by various institutions.
| Grading Company | Action | New Grade | Date |
|---|---|---|---|
| Wells Fargo | Maintain | Underweight | 2026-02-04 |
| Citigroup | Maintain | Neutral | 2026-02-04 |
| Wells Fargo | Maintain | Underweight | 2026-01-07 |
| Goldman Sachs | Downgrade | Sell | 2025-12-16 |
| B of A Securities | Upgrade | Neutral | 2025-11-18 |
| Wells Fargo | Maintain | Underweight | 2025-10-27 |
| Barclays | Maintain | Underweight | 2025-10-27 |
| Truist Securities | Maintain | Hold | 2025-10-27 |
| Truist Securities | Maintain | Hold | 2025-10-08 |
| Barclays | Downgrade | Underweight | 2025-08-14 |
AMETEK, Inc. Grades
Below is a summary of recent grades for AMETEK, Inc. from key grading firms.
| Grading Company | Action | New Grade | Date |
|---|---|---|---|
| Keybanc | Maintain | Overweight | 2026-02-04 |
| DA Davidson | Maintain | Buy | 2026-02-04 |
| Barclays | Maintain | Equal Weight | 2026-02-04 |
| Oppenheimer | Downgrade | Perform | 2026-01-27 |
| Morgan Stanley | Maintain | Equal Weight | 2026-01-12 |
| Barclays | Maintain | Equal Weight | 2026-01-07 |
| Keybanc | Maintain | Overweight | 2026-01-07 |
| Keybanc | Maintain | Overweight | 2026-01-06 |
| Mizuho | Maintain | Outperform | 2026-01-05 |
| TD Cowen | Upgrade | Buy | 2025-12-23 |
Which company has the best grades?
AMETEK, Inc. consistently receives positive grades such as Overweight and Buy, indicating stronger institutional confidence. Illinois Tool Works shows more conservative or negative ratings like Underweight and Sell, potentially signaling higher caution for investors.
Risks specific to each company
The following categories identify critical pressure points and systemic threats facing Illinois Tool Works Inc. and AMETEK, Inc. in the 2026 market environment:
1. Market & Competition
Illinois Tool Works Inc.
- Faces intense competition in diversified industrial machinery segments, with pressure on margins due to innovation demands.
AMETEK, Inc.
- Competes in niche electronic instruments and electromechanical markets, relying on advanced technology to maintain edge.
2. Capital Structure & Debt
Illinois Tool Works Inc.
- High debt-to-equity ratio (2.78) and debt-to-assets (55.54%) raise financial risk despite strong interest coverage.
AMETEK, Inc.
- Maintains low leverage (debt-to-equity 0.21, debt-to-assets 14.21%), indicating a conservative capital structure and lower financial risk.
3. Stock Volatility
Illinois Tool Works Inc.
- Beta of 1.16 suggests above-market volatility; stock price range is wide but recently at upper end.
AMETEK, Inc.
- Beta near 1.04 indicates moderate volatility; price range is broad with recent slight decline, reflecting market sensitivity.
4. Regulatory & Legal
Illinois Tool Works Inc.
- Subject to global industrial compliance and environmental regulations; potential risks in automotive and construction sectors.
AMETEK, Inc.
- Faces regulatory scrutiny in aerospace and electronics sectors; must navigate complex export controls and safety standards.
5. Supply Chain & Operations
Illinois Tool Works Inc.
- Diverse supply chain across segments may face disruption risks but benefits from scale and distribution networks.
AMETEK, Inc.
- Specialized components and manufacturing processes expose it to supply chain bottlenecks and raw material price fluctuations.
6. ESG & Climate Transition
Illinois Tool Works Inc.
- Increasing pressure to reduce carbon footprint in manufacturing and automotive supply chains; moderate ESG disclosures.
AMETEK, Inc.
- Faces challenges in improving energy efficiency for electronic products; higher investor scrutiny on sustainability practices.
7. Geopolitical Exposure
Illinois Tool Works Inc.
- Global operations expose it to trade tensions, tariffs, and geopolitical instability, especially in automotive markets.
AMETEK, Inc.
- Aerospace and defense exposure heightens sensitivity to geopolitical conflicts and export restrictions.
Which company shows a better risk-adjusted profile?
Illinois Tool Works’ largest risk is its elevated leverage, which raises financial vulnerability despite strong profitability. AMETEK’s principal risk lies in its operational exposure to supply chain disruptions in specialized markets. AMETEK’s lower debt and stronger Piotroski score (7 vs. 5) suggest a better risk-adjusted profile. Notably, ITW’s debt-to-equity ratio at 2.78 contrasts sharply with AME’s conservative 0.21, underlining my concern about ITW’s financial risk.
Final Verdict: Which stock to choose?
Illinois Tool Works (ITW) excels as a cash-generating industrial powerhouse with a robust moat evidenced by a high ROIC well above its WACC. Its strength lies in operational efficiency and strong capital returns. A point of vigilance remains its elevated debt levels, which could pressure financial flexibility. ITW suits portfolios seeking aggressive growth with resilience.
AMETEK (AME) offers a strategic moat through diversified industrial niches and a safer balance sheet marked by low leverage. Its recurring revenue streams and steady profitability growth underpin a more conservative risk profile. AME fits well in GARP portfolios, balancing growth aspirations with reasonable valuation discipline.
If you prioritize capital efficiency and high return on invested capital, ITW is the compelling choice due to its superior value creation and operational strength despite leverage concerns. However, if you seek stability with a more moderate growth trajectory and lower financial risk, AME offers better safety and consistent income growth. Each aligns with distinct investor risk appetites and portfolio goals.
Disclaimer: Investment carries a risk of loss of initial capital. The past performance is not a reliable indicator of future results. Be sure to understand risks before making an investment decision.
Go Further
I encourage you to read the complete analyses of Illinois Tool Works Inc. and AMETEK, Inc. to enhance your investment decisions: