Home > Comparison > Industrials > AME vs IEX
The strategic rivalry between AMETEK, Inc. and IDEX Corporation shapes the competitive landscape of the Industrials sector. AMETEK operates as a diversified industrial machinery leader with a broad product portfolio, while IDEX focuses on specialized fluid and metering technologies. This analysis pits AMETEK’s scale and scope against IDEX’s niche innovation. I aim to determine which company’s business model offers superior risk-adjusted returns for a diversified portfolio.
Table of contents
Companies Overview
AMETEK and IDEX Corporation both hold significant positions in the industrial machinery sector, shaping key markets worldwide.
AMETEK, Inc.: Precision Instruments and Electromechanical Solutions
AMETEK dominates as a global manufacturer of electronic instruments and electromechanical devices. Its revenue stems from two core segments: Electronic Instruments serving aerospace and industrial markets, and Electromechanical delivering precision motion control and power systems. In 2026, AMETEK emphasizes innovation in advanced instrumentation and aerospace sensor technologies to sustain its competitive edge.
IDEX Corporation: Applied Fluid and Safety Technologies
IDEX leads through its diversified portfolio in fluid handling, health sciences, and safety products. Revenue flows from Fluid & Metering Technologies, Health & Science Technologies, and Fire & Safety segments, serving industries from pharmaceuticals to firefighting. In 2026, IDEX prioritizes expanding precision fluidics and engineered safety solutions to deepen its market penetration.
Strategic Collision: Similarities & Divergences
Both companies focus on engineered industrial solutions but diverge in product scope—AMETEK targets advanced instrumentation, while IDEX embraces fluidics and safety. Their primary battleground lies in high-precision components for critical industries like aerospace, healthcare, and energy. AMETEK offers a broad industrial moat with diversified electromechanical assets, whereas IDEX presents a specialized, innovation-driven profile appealing to niche markets.
Income Statement Comparison
This data dissects the core profitability and scalability of both corporate engines to reveal who dominates the bottom line:
| Metric | AMETEK, Inc. (AME) | IDEX Corporation (IEX) |
|---|---|---|
| Revenue | 7.4B | 3.3B |
| Cost of Revenue | 0 | 1.75B |
| Operating Expenses | 5.49B | 820M |
| Gross Profit | 0 | 1.52B |
| EBITDA | 1.91B | 859M |
| EBIT | 0 | 684M |
| Interest Expense | -81M | 45M |
| Net Income | 1.48B | 505M |
| EPS | 6.42 | 6.67 |
| Fiscal Year | 2025 | 2024 |
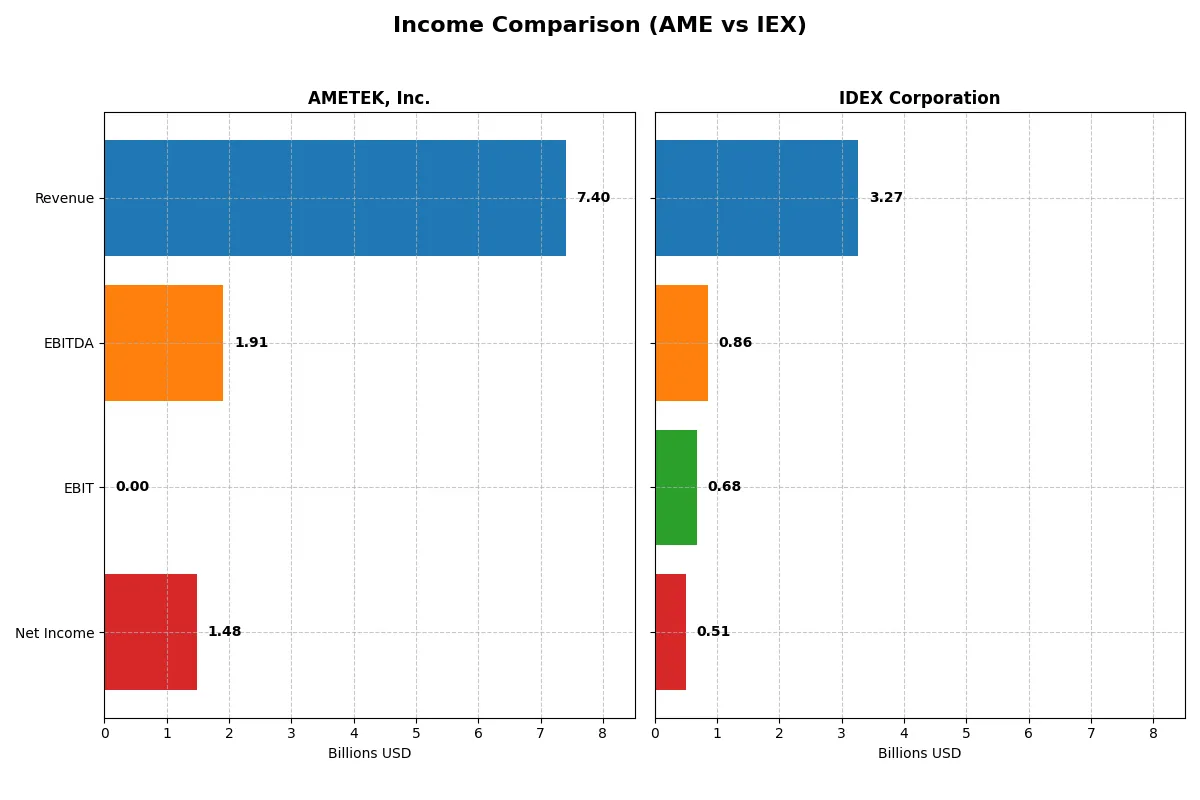
Income Statement Analysis: The Bottom-Line Duel
This income statement comparison reveals how efficiently AMETEK and IDEX convert revenue into profit amid changing market conditions.
AMETEK, Inc. Analysis
AMETEK’s revenue climbed steadily from 5.5B in 2021 to 7.4B in 2025, with net income rising from 990M to 1.48B. Despite a lack of gross profit data in 2025, the company maintains a strong 20% net margin. Momentum in 2025 shows solid EPS growth of nearly 8%, reflecting improving bottom-line efficiency.
IDEX Corporation Analysis
IDEX’s revenue grew from 2.35B in 2020 to 3.27B in 2023 but dipped slightly to 3.27B in 2024. Net income followed a similar pattern, peaking at 596M in 2023 and dropping to 505M in 2024. Margins remain healthy, with a 46.4% gross margin and 15.45% net margin in 2024, but recent declines signal slowing operational momentum.
Margin Strength vs. Growth Stability
AMETEK leads with stronger net margin expansion and consistent revenue growth over five years. IDEX boasts superior gross margins but faces recent declines in net income and EPS. For investors, AMETEK’s profile suggests more robust profit growth, while IDEX reflects solid margin control but with near-term earnings pressure.
Financial Ratios Comparison
These vital ratios act as a diagnostic tool to expose the underlying fiscal health, valuation premiums, and capital efficiency of each company:
| Ratios | AMETEK, Inc. (AME) | IDEX Corporation (IEX) |
|---|---|---|
| ROE | 14.3% | 13.3% |
| ROIC | 11.1% | 8.8% |
| P/E | 30.3 | 31.4 |
| P/B | 4.3 | 4.2 |
| Current Ratio | 1.24 | 2.53 |
| Quick Ratio | 0.75 | 1.85 |
| D/E (Debt-to-Equity) | 0.24 | 0.52 |
| Debt-to-Assets | 15.9% | 29.4% |
| Interest Coverage | 15.8 | 15.7 |
| Asset Turnover | 0.47 | 0.48 |
| Fixed Asset Turnover | 6.58 | 7.10 |
| Payout Ratio | 18.8% | 40.7% |
| Dividend Yield | 0.62% | 1.30% |
| Fiscal Year | 2024 | 2024 |
Efficiency & Valuation Duel: The Vital Signs
Financial ratios act as a company’s DNA, exposing hidden risks and operational strengths that raw numbers alone cannot reveal.
AMETEK, Inc.
AME posts a solid net margin of 19.8%, signaling strong profitability, yet its ROE at 14.3% is merely neutral. The stock trades at a stretched P/E of 30.3 and P/B of 4.3, reflecting expensive valuation. Dividend yield is low at 0.62%, suggesting limited direct shareholder returns with likely reinvestment into R&D and growth initiatives.
IDEX Corporation
IEX shows a favorable net margin of 15.5% and a neutral ROE of 13.3%. Its P/E ratio of 31.4 also appears expensive, but a better current ratio of 2.53 and strong interest coverage indicate operational safety. IEX delivers a moderate 1.3% dividend yield, balancing shareholder returns with steady capital allocation.
Premium Valuation vs. Operational Safety
While both companies carry elevated valuations, IEX offers a better balance of operational efficiency and financial health. AME’s profitability is stronger but comes with more risk signals. Investors seeking stability may prefer IEX’s profile, whereas those favoring margin strength might lean toward AME.
Which one offers the Superior Shareholder Reward?
I compare AMETEK, Inc. (AME) and IDEX Corporation (IEX) on dividends, payout ratios, and buybacks to identify the superior shareholder reward in 2026. AME yields ~0.62% with a low payout ratio near 18.8%, reflecting modest dividends well-covered by free cash flow (~93%). IEX offers a higher yield at ~1.3%, but with a payout ratio exceeding 40%, pressuring cash flow coverage (~90%). Both companies deploy buybacks, yet AME’s disciplined capex and conservative leverage suggest more sustainable capital returns. IEX’s aggressive dividend and buyback strategy risks long-term flexibility. I favor AMETEK for superior total return potential given its balanced, sustainable distribution and strong free cash flow profile.
Comparative Score Analysis: The Strategic Profile
The radar chart reveals the fundamental DNA and trade-offs of AMETEK, Inc. and IDEX Corporation, highlighting their core financial strengths and weaknesses:
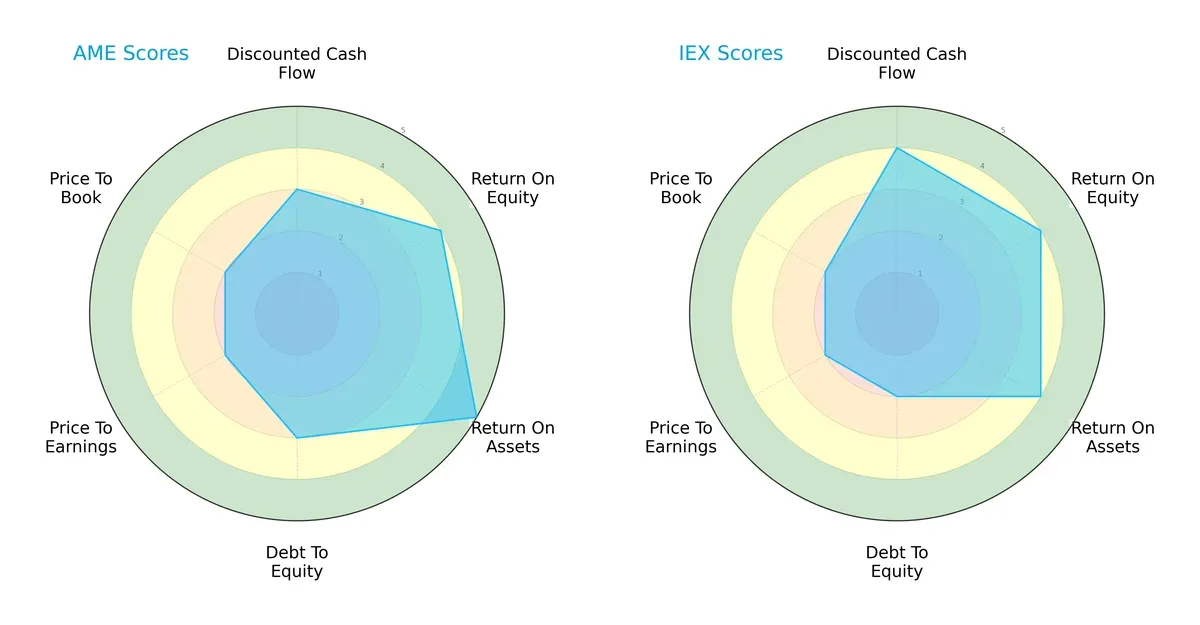
AMETEK excels in asset utilization with a top ROA score of 5, while IDEX leads in discounted cash flow valuation with a 4. Both share similar ROE scores at 4, but AMETEK holds a moderate debt position (3) compared to IDEX’s slightly riskier leverage (2). Valuation metrics (PE and PB) remain moderate and equal for both, suggesting no clear bargain. Overall, AMETEK shows a more balanced profile, leveraging operational efficiency, whereas IDEX relies on stronger cash flow projections.
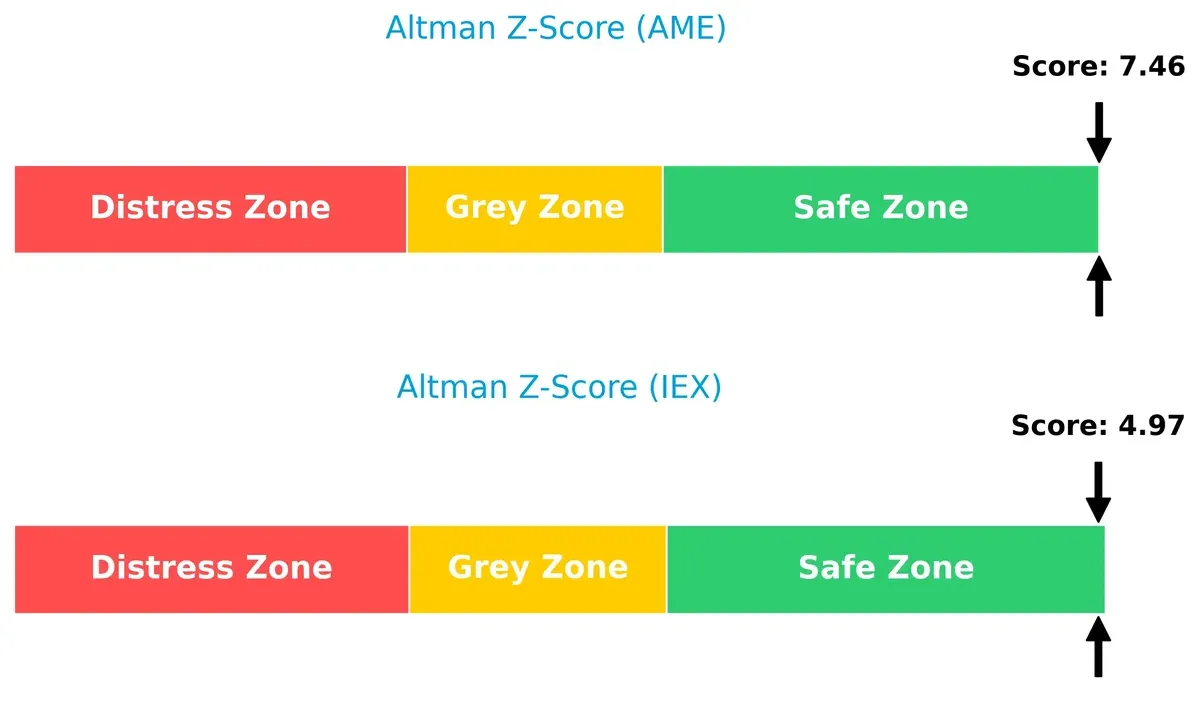
Bankruptcy Risk: Solvency Showdown
AMETEK’s Altman Z-Score of 7.46 versus IDEX’s 4.97 confirms both firms are in the safe zone. This gap underlines AMETEK’s superior buffer against bankruptcy risk in volatile cycles:
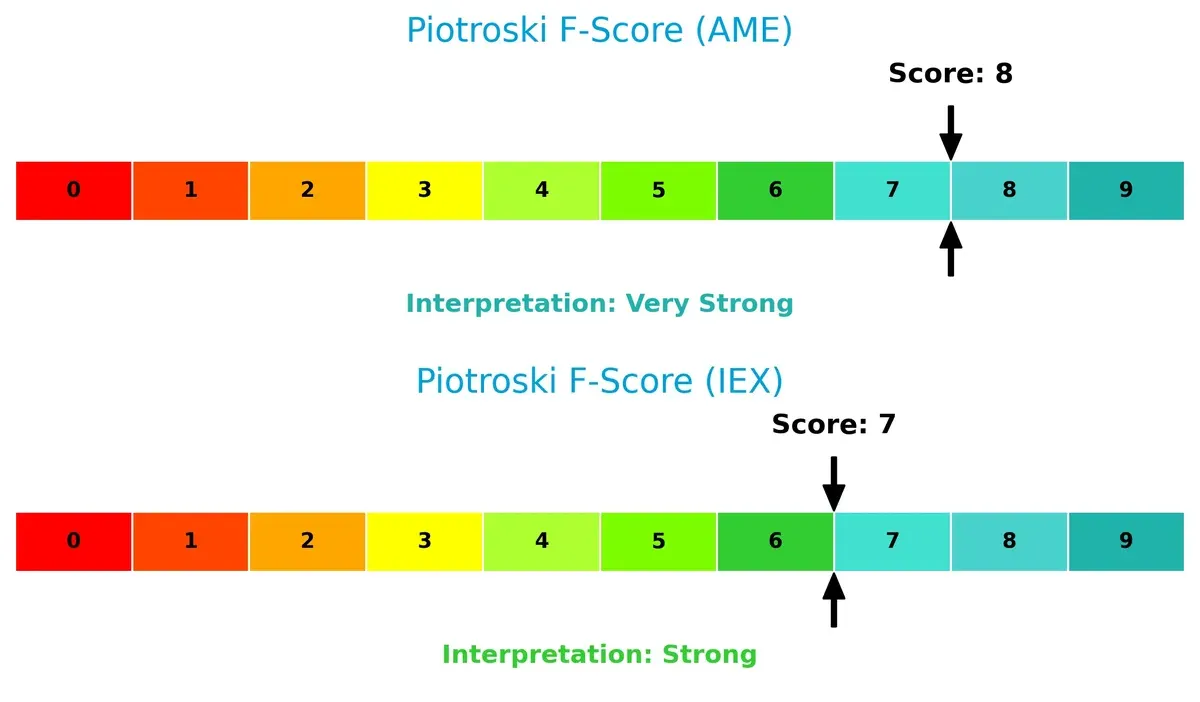
Financial Health: Quality of Operations
AMETEK’s Piotroski F-Score of 8 edges out IDEX’s 7, indicating stronger internal financial health. Both firms are solid, but AMETEK’s higher score suggests fewer red flags in profitability, leverage, and liquidity:
How are the two companies positioned?
This section dissects AMETEK’s and IDEX’s operational DNA by comparing revenue distribution and internal dynamics. The goal is to confront their economic moats to identify the more resilient, sustainable competitive advantage.
Revenue Segmentation: The Strategic Mix
This visual comparison dissects how AMETEK, Inc. and IDEX Corporation diversify their income streams and where their primary sector bets lie:
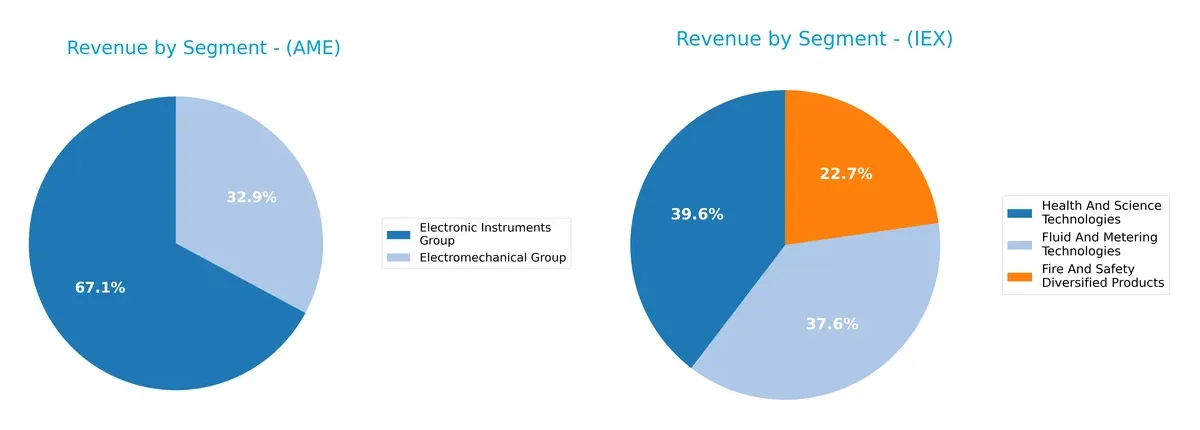
AMETEK’s revenue pivots around two segments: $4.66B in Electronic Instruments and $2.28B in Electromechanical Group, showing moderate diversification. IDEX spreads $1.30B in Health and Science, $1.23B in Fluid and Metering, and $744M in Fire and Safety, presenting a more balanced mix. AMETEK’s reliance on Electronic Instruments anchors its strategy, while IDEX’s tri-segment approach reduces concentration risk, boosting resilience.
Strengths and Weaknesses Comparison
This table compares the Strengths and Weaknesses of AMETEK, Inc. (AME) and IDEX Corporation (IEX):
AME Strengths
- Strong net margin at 19.83%
- Low debt-to-assets ratio at 15.89%
- High fixed asset turnover at 6.58
- Diverse revenue from Electromechanical and Electronic Instruments groups
- Significant global presence including US, Europe, and Asia
IEX Strengths
- Favorable net margin at 15.45%
- Strong interest coverage at 15.37
- High current and quick ratios at 2.53 and 1.85
- Favorable WACC at 7.84%
- Balanced revenue across three segments
- Wide geographic diversification with strong US and Europe sales
AME Weaknesses
- Unfavorable P/E at 30.29 and P/B at 4.32
- Quick ratio low at 0.75
- Negative interest coverage ratio
- Below-average asset turnover at 0.47
- Dividend yield low at 0.62%
IEX Weaknesses
- High P/E at 31.37 and P/B at 4.18
- Neutral ROIC at 8.81% limits competitive advantage
- Asset turnover low at 0.48
- Debt-to-equity ratio moderate at 0.52
- Dividend yield neutral at 1.3%
AME demonstrates superior profitability and asset utilization in fixed assets but struggles with liquidity and valuation multiples. IEX offers stronger liquidity and debt coverage with a more balanced segment revenue mix but faces valuation and turnover challenges. Both companies show diversified operations and global reach, shaping their strategic priorities towards improving asset efficiency and managing capital costs.
The Moat Duel: Analyzing Competitive Defensibility
A structural moat is the only true barrier protecting long-term profits from relentless competitive erosion:
AMETEK, Inc.: Diversified Engineering Moat
AMETEK’s moat stems from its broad portfolio of advanced instruments and electromechanical devices. This diversity supports margin stability and a growing ROIC trend. Expansion into aerospace and industrial applications could deepen its competitive edge in 2026.
IDEX Corporation: Specialized Fluidics Moat
IDEX’s moat relies on niche expertise in fluid handling and precision pumps, contrasting with AMETEK’s breadth. However, IDEX’s declining ROIC signals weakening value creation. Opportunities in biopharmaceutical fluidics may partially offset this trend in 2026.
Sustained Value Creation vs. Niche Pressure
AMETEK’s growing ROIC and diversified portfolio give it a deeper moat than IDEX’s shrinking profitability. AMETEK is better positioned to defend market share against sector disruption.
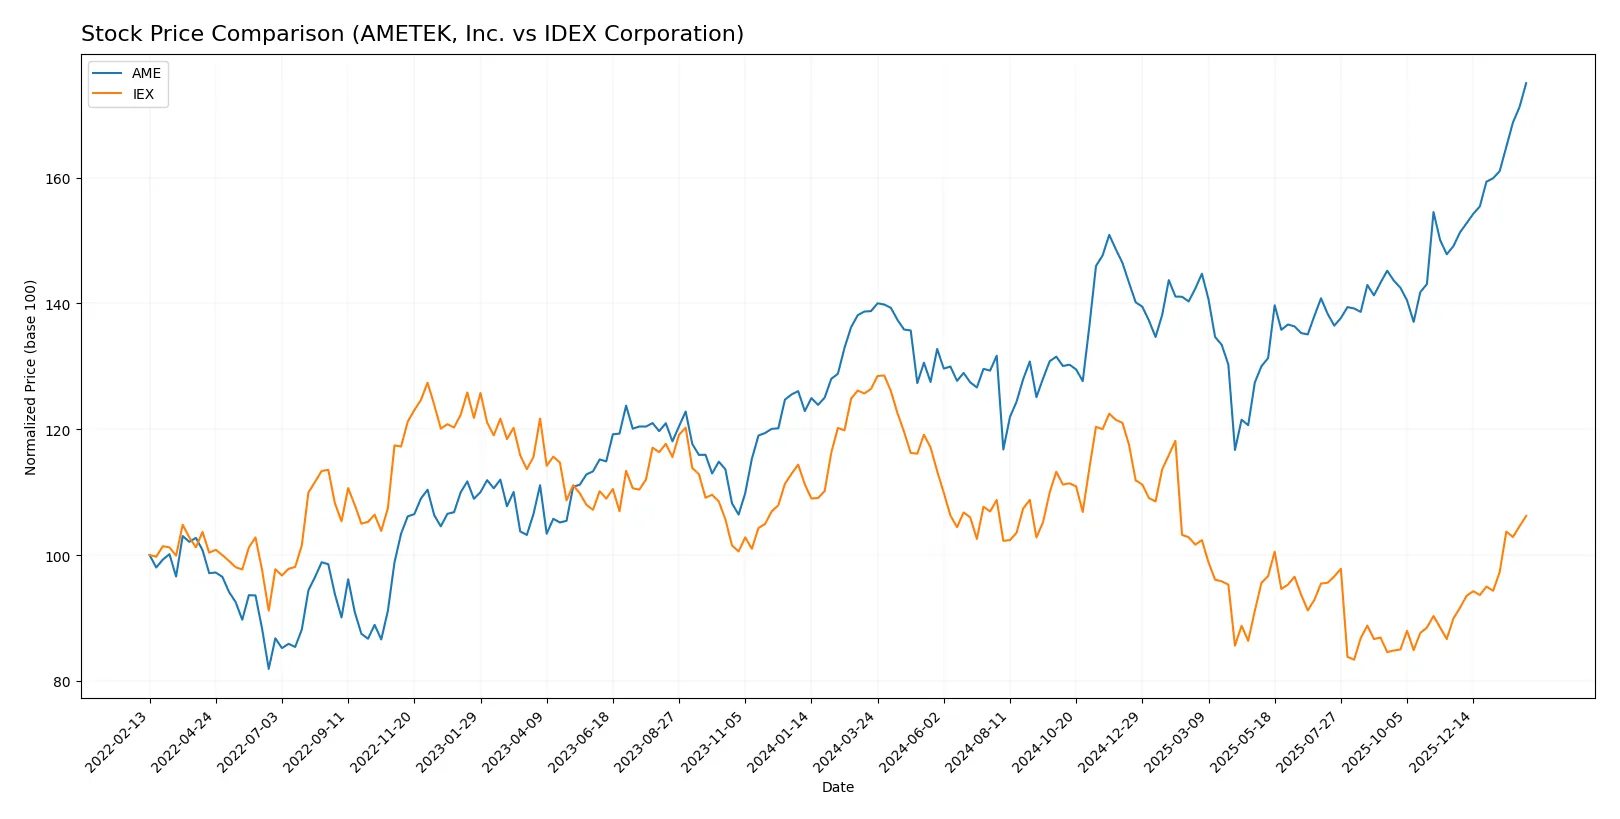
Which stock offers better returns?
The past year shows AMETEK, Inc. gaining 26.11%, signaling strong upward momentum. IDEX Corporation fell 15.99%, despite recent positive price shifts.
Trend Comparison
AMETEK, Inc. exhibits a bullish trend with 26.11% growth over 12 months and accelerating gains. Its price ranged from 153 to 229, reflecting solid upward momentum.
IDEX Corporation shows a bearish 15.99% decline over the same period but recent weeks reveal an 18.14% rebound with acceleration, indicating potential recovery.
Comparing both, AMETEK delivered the highest market performance over the past year, outperforming IDEX’s overall negative trend.
Target Prices
Analysts present confident target price ranges for AMETEK, Inc. and IDEX Corporation, reflecting solid industrial sector outlooks.
| Company | Target Low | Target High | Consensus |
|---|---|---|---|
| AMETEK, Inc. | 204 | 271 | 231.64 |
| IDEX Corporation | 180 | 220 | 205.25 |
The target consensus for AMETEK slightly exceeds its current price of 229, indicating moderate upside potential. IDEX’s consensus of 205 also suggests a modest gain from its present 202, affirming cautious optimism.

Don’t Let Luck Decide Your Entry Point
Optimize your entry points with our advanced ProRealTime indicators. You’ll get efficient buy signals with precise price targets for maximum performance. Start outperforming now!
How do institutions grade them?
The latest grades from established firms for AMETEK, Inc. and IDEX Corporation are as follows:
AMETEK, Inc. Grades
Here are the recent grades by key financial institutions for AMETEK, Inc.:
| Grading Company | Action | New Grade | Date |
|---|---|---|---|
| Oppenheimer | Downgrade | Perform | 2026-01-27 |
| Morgan Stanley | Maintain | Equal Weight | 2026-01-12 |
| Keybanc | Maintain | Overweight | 2026-01-07 |
| Barclays | Maintain | Equal Weight | 2026-01-07 |
| Keybanc | Maintain | Overweight | 2026-01-06 |
| Mizuho | Maintain | Outperform | 2026-01-05 |
| TD Cowen | Upgrade | Buy | 2025-12-23 |
| DA Davidson | Maintain | Buy | 2025-12-08 |
| Baird | Maintain | Neutral | 2025-11-03 |
| Keybanc | Maintain | Overweight | 2025-10-31 |
IDEX Corporation Grades
The following table summarizes IDEX Corporation’s recent institutional grades:
| Grading Company | Action | New Grade | Date |
|---|---|---|---|
| Stifel | Maintain | Buy | 2026-01-23 |
| Citigroup | Maintain | Buy | 2025-12-08 |
| RBC Capital | Maintain | Outperform | 2025-10-30 |
| Stifel | Maintain | Buy | 2025-10-20 |
| Oppenheimer | Maintain | Outperform | 2025-10-07 |
| DA Davidson | Maintain | Neutral | 2025-08-04 |
| RBC Capital | Maintain | Outperform | 2025-07-31 |
| Stifel | Maintain | Buy | 2025-07-31 |
| Oppenheimer | Maintain | Outperform | 2025-07-31 |
| Stifel | Maintain | Buy | 2025-07-21 |
Which company has the best grades?
IDEX Corporation consistently holds stronger grades, mainly “Buy” and “Outperform,” while AMETEK shows mixed ratings including downgrades. This suggests greater institutional confidence in IDEX, potentially impacting investor sentiment.
Risks specific to each company
The following categories identify the critical pressure points and systemic threats facing AMETEK, Inc. and IDEX Corporation in the 2026 market environment:
1. Market & Competition
AMETEK, Inc.
- Faces intense competition in industrial machinery; premium pricing pressures weigh on margins.
IDEX Corporation
- Competes in diverse fluid and safety markets; strong niche focus but exposure to cyclical demand.
2. Capital Structure & Debt
AMETEK, Inc.
- Low debt-to-equity ratio (0.24) signals conservative leverage; interest coverage is weak, raising financial risk concerns.
IDEX Corporation
- Moderate debt level (0.52 D/E) but strong interest coverage (15.4x) ensures robust debt servicing capacity.
3. Stock Volatility
AMETEK, Inc.
- Beta near 1.04 indicates market-level volatility; price range suggests moderate fluctuations.
IDEX Corporation
- Beta just below 1.0 implies slightly lower volatility; recent price gains show positive momentum.
4. Regulatory & Legal
AMETEK, Inc.
- Operates globally with exposure to aerospace and industrial regulations; compliance costs could rise.
IDEX Corporation
- Faces regulatory oversight in fluid handling and safety sectors; product liability risks present.
5. Supply Chain & Operations
AMETEK, Inc.
- Complex supply chain across electronics and mechanical parts; potential disruptions could impact delivery.
IDEX Corporation
- Relies on specialized components for pumps and safety equipment; supply chain agility is a concern.
6. ESG & Climate Transition
AMETEK, Inc.
- Pressure to reduce emissions in manufacturing; environmental compliance costs may increase.
IDEX Corporation
- Positioned to benefit from energy efficiency trends but must manage sustainability in chemical handling.
7. Geopolitical Exposure
AMETEK, Inc.
- Global footprint exposes it to trade tensions and geopolitical risks, especially in aerospace markets.
IDEX Corporation
- Moderate international exposure; sensitive to regulatory changes and tariffs in key markets.
Which company shows a better risk-adjusted profile?
IDEX Corporation’s strongest risk lies in supply chain complexity, while AMETEK’s critical risk centers on weak interest coverage. IDEX’s superior liquidity and debt servicing metrics grant it a better risk-adjusted profile. AMETEK’s near-zero interest coverage and unfavorable quick ratio signal caution despite its conservative leverage.
Final Verdict: Which stock to choose?
AMETEK, Inc. (AME) stands out as a cash-generating powerhouse with a steadily growing return on invested capital. Its efficiency and strong free cash flow support ongoing investments and shareholder returns. The point of vigilance is its moderate liquidity position, which could challenge short-term flexibility. AME fits well in an Aggressive Growth portfolio seeking resilient industrial exposure.
IDEX Corporation (IEX) offers a robust strategic moat through its diversified product portfolio and solid recurring revenues. Its financial safety is superior, marked by a strong current ratio and interest coverage, providing downside protection compared to AME. IEX aligns with a GARP portfolio, balancing growth potential with reasonable financial stability.
If you prioritize dynamic growth driven by operational efficiency and expanding capital returns, AMETEK is the compelling choice due to its accelerating cash flow and improving profitability metrics. However, if you seek better financial stability coupled with a steady income profile, IDEX offers superior balance sheet strength and a defensive edge amid market volatility. Both present analytical scenarios worth considering based on your risk tolerance and investment horizon.
Disclaimer: Investment carries a risk of loss of initial capital. The past performance is not a reliable indicator of future results. Be sure to understand risks before making an investment decision.
Go Further
I encourage you to read the complete analyses of AMETEK, Inc. and IDEX Corporation to enhance your investment decisions: