Home > Comparison > Industrials > HWM vs AME
The strategic rivalry between Howmet Aerospace Inc. and AMETEK, Inc. shapes the industrial machinery landscape. Howmet Aerospace focuses on advanced engineered solutions for aerospace and transportation, emphasizing forged components and structural parts. AMETEK operates as a diversified manufacturer of electronic instruments and electromechanical devices across multiple sectors. This analysis explores their contrasting operational models to identify which company offers a superior risk-adjusted return for a diversified portfolio.
Table of contents
Companies Overview
Howmet Aerospace and AMETEK, Inc. stand as key industrial giants shaping aerospace and machinery markets globally.
Howmet Aerospace Inc.: Advanced Engineered Aerospace Solutions
Howmet Aerospace dominates the aerospace and transportation sectors with its engine products and forged wheels. Its revenue streams rely heavily on four segments: engine parts, fastening systems, engineered structures, and forged wheels for heavy-duty trucks. In 2026, Howmet emphasizes expanding its engineered structures and titanium product lines to maintain its competitive edge in aerospace manufacturing.
AMETEK, Inc.: Precision Electronic Instruments and Electromechanical Devices
AMETEK leads in manufacturing electronic instruments and electromechanical components worldwide. Its two core segments—Electronic Instruments and Electromechanical—serve diverse industries, including aerospace, power, and pharmaceuticals. The company’s 2026 strategy focuses on innovation in power quality monitoring and precision motion control to bolster its presence across industrial and aerospace markets.
Strategic Collision: Similarities & Divergences
Both companies excel in industrial machinery but diverge in approach: Howmet centers on engineered aerospace components, while AMETEK prioritizes electronic and electromechanical solutions. They compete primarily in aerospace technology but target complementary niches—hardware versus instrumentation. This distinction frames their unique investment profiles: one as a manufacturing powerhouse, the other as a precision technology innovator.
Income Statement Comparison
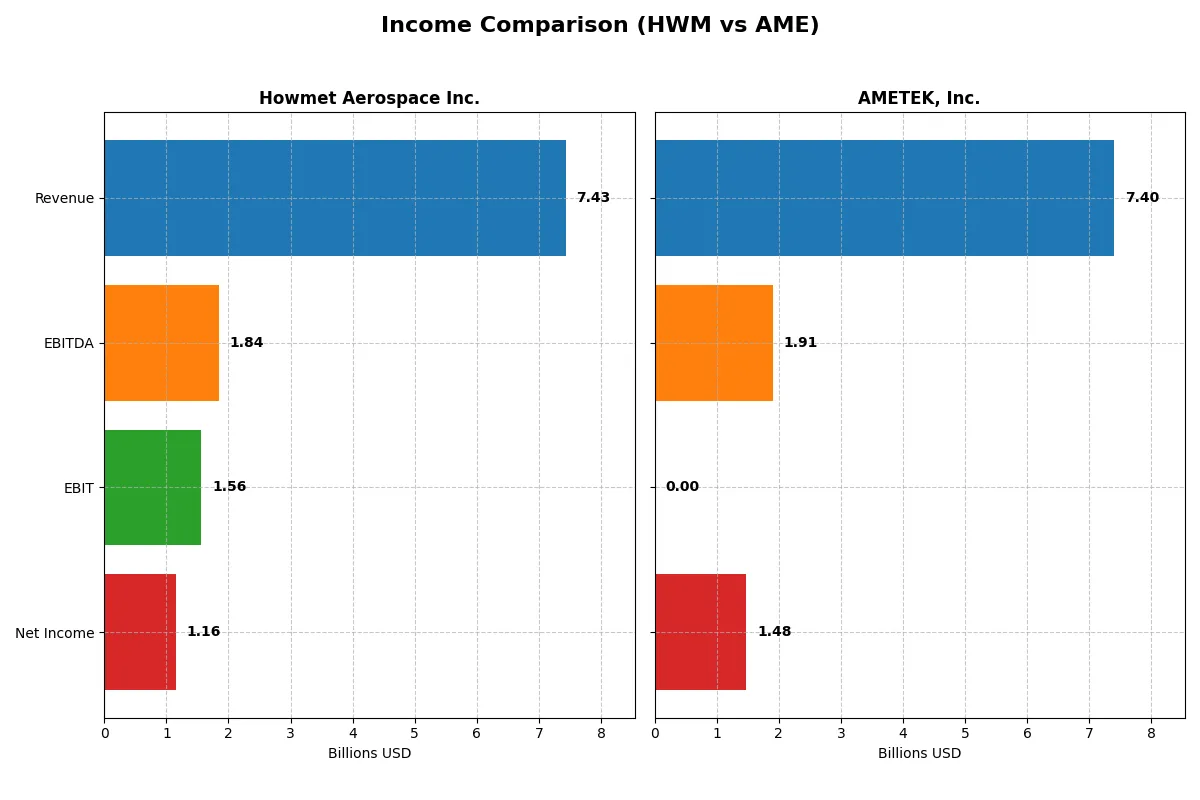
This table dissects the core profitability and scalability of both corporate engines to reveal who dominates the bottom line:
| Metric | Howmet Aerospace Inc. (HWM) | AMETEK, Inc. (AME) |
|---|---|---|
| Revenue | 7.43B | 7.40B |
| Cost of Revenue | 5.38B | 4.46B |
| Operating Expenses | 380M | 697M |
| Gross Profit | 2.05B | 2.48B |
| EBITDA | 1.84B | 2.16B |
| EBIT | 1.57B | 1.77B |
| Interest Expense | 182M | 113M |
| Net Income | 1.16B | 1.38B |
| EPS | 2.83 | 5.95 |
| Fiscal Year | 2024 | 2024 |
Income Statement Analysis: The Bottom-Line Duel
This income statement comparison reveals which company converts revenue into profit most efficiently over recent years.
Howmet Aerospace Inc. Analysis
Howmet Aerospace’s revenue climbed steadily from 5.3B in 2020 to 7.4B in 2024, with net income surging from 209M to 1.16B. Its gross margin holds firm at 27.6%, and net margin improved to 15.6%, reflecting strong cost controls and operational leverage. The 2024 figures show robust momentum with a 34.9% net margin growth year-over-year.
AMETEK, Inc. Analysis
AMETEK’s revenue rose from 5.5B in 2021 to 7.4B in 2025, with net income increasing from 990M to 1.48B. However, its reported gross margin in 2025 is zero due to missing cost data, complicating margin analysis. The net margin stands at a healthy 20%, but mixed growth signals and a one-year decline in EBIT highlight some volatility in efficiency.
Margin Discipline vs. Scale Expansion
Howmet Aerospace clearly leads in margin stability and growth, with consistent improvement in profitability ratios and strong earnings momentum. AMETEK delivers solid top-line growth and respectable net income gains but lacks transparent margin data and shows uneven operating profit trends. For investors, Howmet’s disciplined margin expansion presents a more attractive profitability profile.
Financial Ratios Comparison
These vital ratios act as a diagnostic tool to expose the underlying fiscal health, valuation premiums, and capital efficiency of the companies compared below:
| Ratios | Howmet Aerospace Inc. (HWM) | AMETEK, Inc. (AME) |
|---|---|---|
| ROE | 25.36% | 14.25% |
| ROIC | 15.49% | 11.13% |
| P/E | 38.63 | 30.29 |
| P/B | 9.80 | 4.32 |
| Current Ratio | 2.17 | 1.24 |
| Quick Ratio | 0.98 | 0.75 |
| D/E (Debt-to-Equity) | 0.76 | 0.24 |
| Debt-to-Assets | 33.0% | 15.9% |
| Interest Coverage | 9.19 | 15.75 |
| Asset Turnover | 0.71 | 0.47 |
| Fixed Asset Turnover | 2.92 | 6.58 |
| Payout Ratio | 9.44% | 18.81% |
| Dividend Yield | 0.24% | 0.62% |
| Fiscal Year | 2024 | 2024 |
Efficiency & Valuation Duel: The Vital Signs
Financial ratios serve as a company’s DNA, revealing hidden risks and operational excellence beyond surface-level earnings.
Howmet Aerospace Inc.
Howmet Aerospace posts a strong 25.36% ROE and favorable 15.55% net margin, signaling robust profitability. Its P/E of 38.63 and P/B of 9.8 paint a stretched valuation. The 0.24% dividend yield is weak; the firm appears to prioritize reinvestment over shareholder payouts, likely fueling growth and R&D.
AMETEK, Inc.
AMETEK shows a solid 19.83% net margin but a more modest 14.25% ROE, indicating steady efficiency. Its P/E of 30.29 and P/B of 4.32 also suggest premium pricing, though less stretched than Howmet Aerospace. Despite a higher 0.62% dividend yield, several unfavorable liquidity and asset turnover ratios hint at operational constraints.
Premium Valuation vs. Operational Safety
Howmet Aerospace offers superior profitability but at a higher valuation and limited dividend return. AMETEK trades cheaper with a better dividend but faces operational risks. Growth-focused investors may prefer Howmet’s profile; income-focused investors might lean toward AMETEK’s steadier cash flow.
Which one offers the Superior Shareholder Reward?
I observe that Howmet Aerospace Inc. (HWM) pays a modest dividend yield of 0.24% with a low payout ratio near 9.4%, reflecting conservative cash return. Its free cash flow per share stands at $2.39B, suggesting limited dividend pressure. Share buybacks appear modest, implying restrained capital return. In contrast, AMETEK, Inc. (AME) offers a higher dividend yield around 0.62% with a payout ratio near 18.8%, doubling HWM’s distribution intensity. AME’s free cash flow per share is a robust $7.36B, comfortably covering dividends and supporting aggressive buybacks. Historically in industrials, such balanced dividends plus buybacks by AME indicate a stronger total shareholder return. I conclude AME’s distribution model is more sustainable and attractive for 2026 investors seeking superior shareholder reward.
Comparative Score Analysis: The Strategic Profile
The radar chart reveals the fundamental DNA and trade-offs of Howmet Aerospace Inc. and AMETEK, Inc., highlighting their distinctive financial strengths and weaknesses:
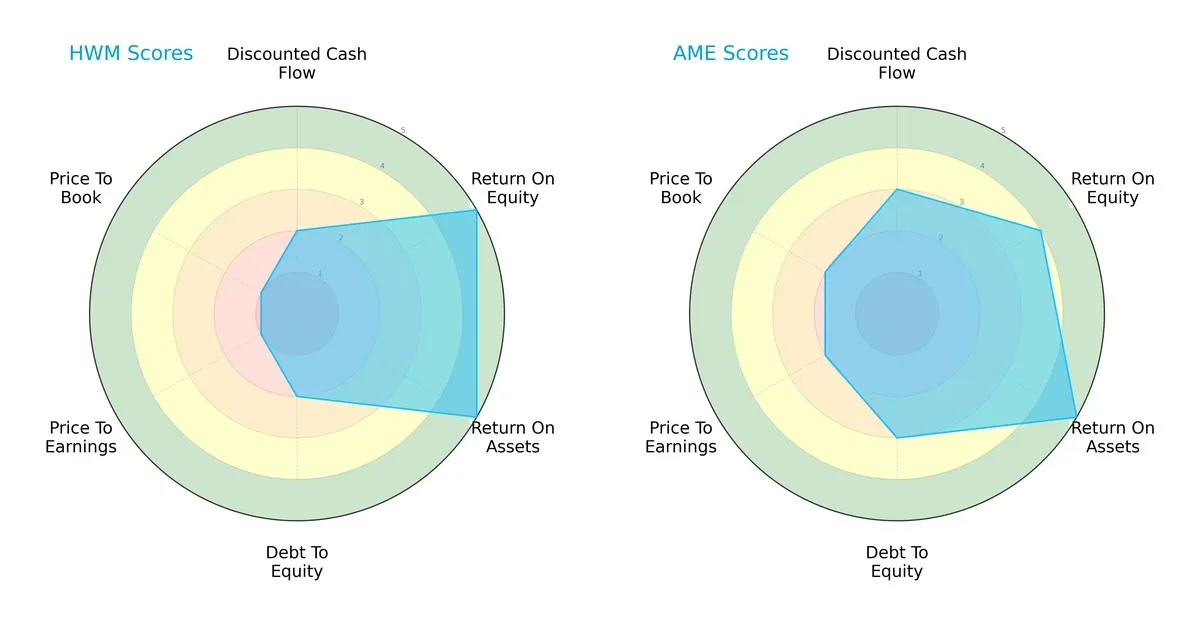
Howmet Aerospace excels in profitability metrics, scoring higher in ROE and ROA, indicating superior operational efficiency. AMETEK offers a more balanced profile, with better discounted cash flow and debt-to-equity scores, pointing to prudent capital management. However, Howmet’s valuation scores lag significantly, reflecting potential market skepticism. Overall, AMETEK relies on steady financial footing, while Howmet leverages operational excellence.
Bankruptcy Risk: Solvency Showdown
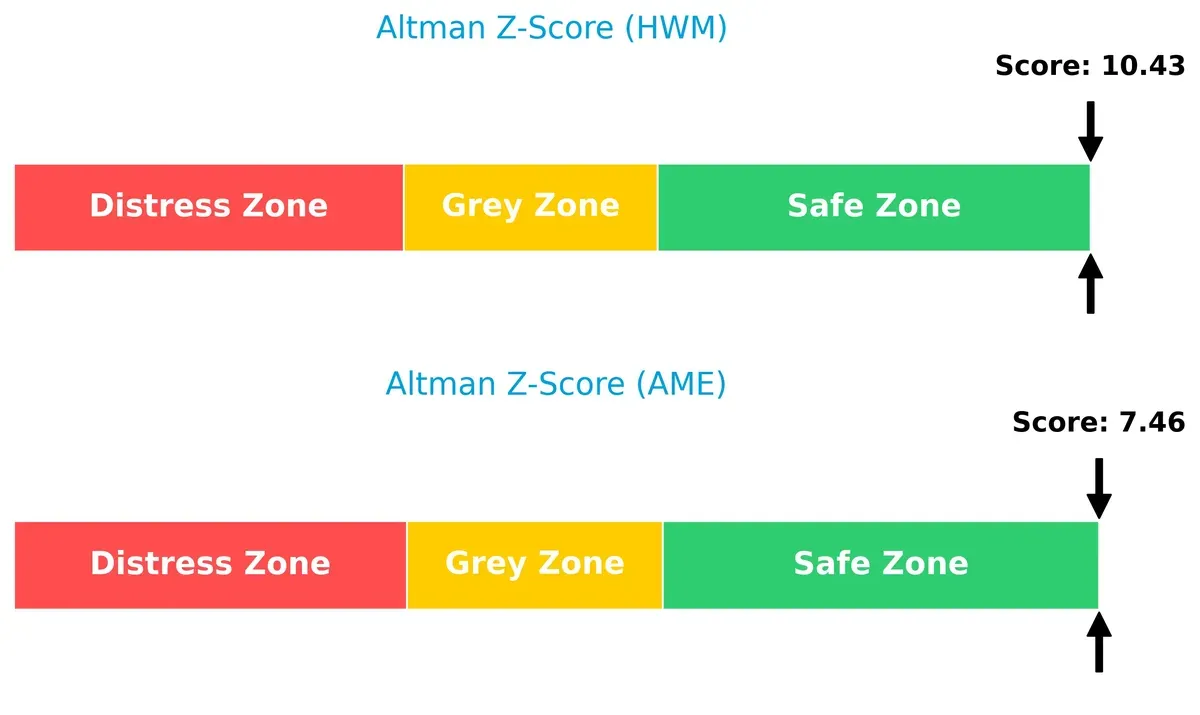
Howmet Aerospace’s Altman Z-Score of 10.4 significantly exceeds AMETEK’s 7.5, placing both comfortably in the safe zone but signaling Howmet’s stronger buffer against financial distress in this cycle:
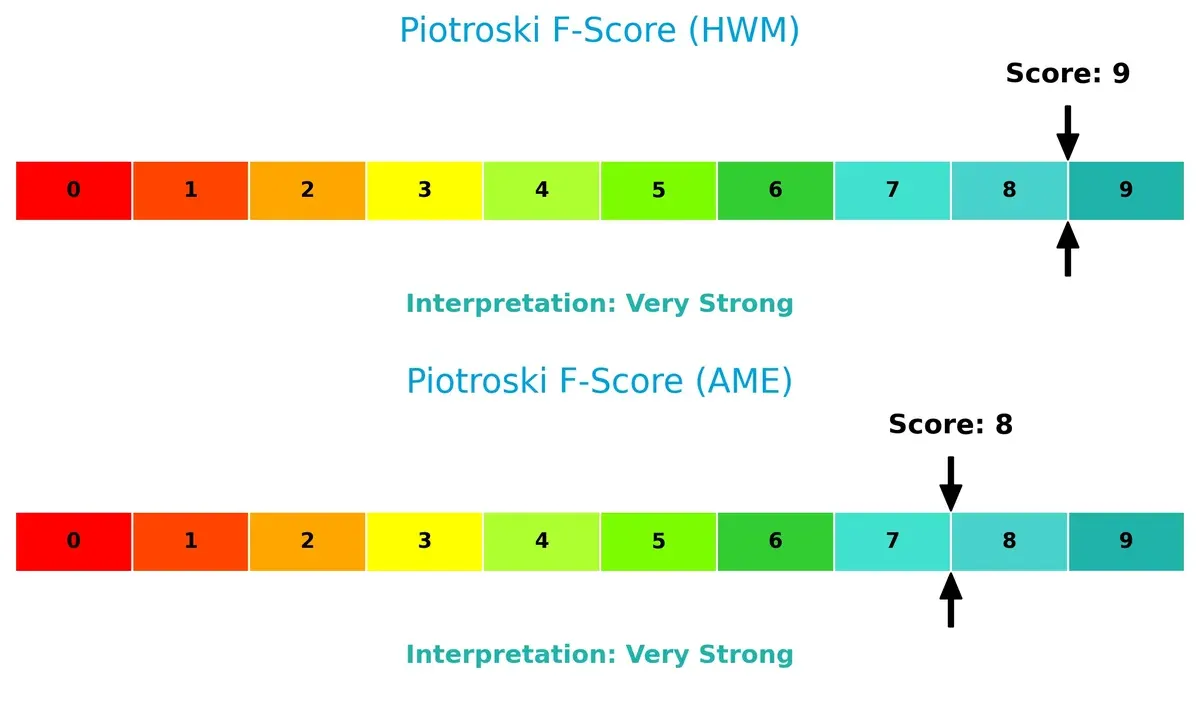
Financial Health: Quality of Operations
Howmet Aerospace scores a perfect 9 on the Piotroski F-Score, slightly outperforming AMETEK’s strong 8. This indicates Howmet’s peak financial health and operational quality, with no red flags detected compared to AMETEK:
How are the two companies positioned?
This section dissects the operational DNA of HWM and AME by comparing their revenue distribution and internal dynamics. The goal is to confront their economic moats and identify which model offers the most resilient competitive advantage today.
Revenue Segmentation: The Strategic Mix
This comparison dissects how Howmet Aerospace and AMETEK diversify their income streams and where their primary sector bets lie:
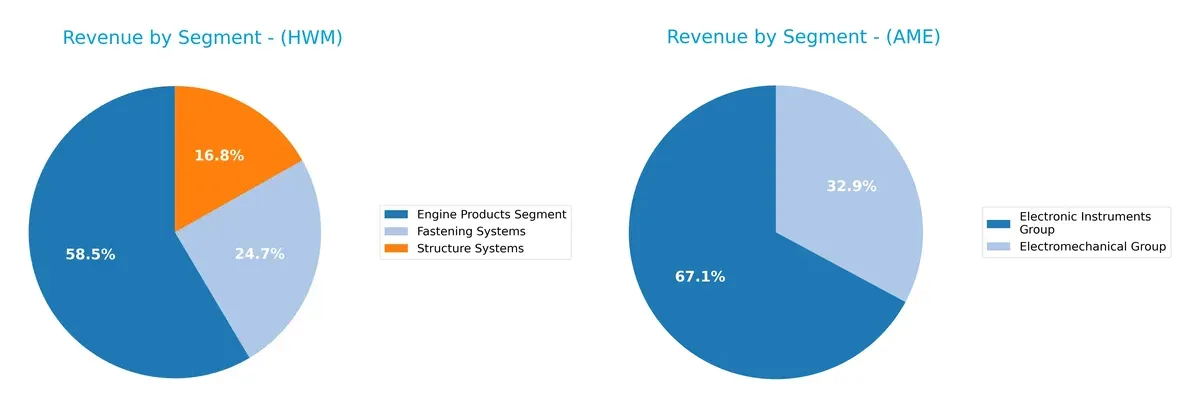
Howmet Aerospace anchors its revenue in Engine Products at $3.74B, with Fastening and Structure Systems trailing at $1.58B and $1.08B. AMETEK splits revenue between Electronic Instruments at $4.66B and Electromechanical Group at $2.28B. AMETEK’s two-segment mix shows more diversification, reducing concentration risk, while Howmet’s reliance on engine components suggests a strategic focus on aerospace infrastructure dominance.
Strengths and Weaknesses Comparison
This table compares the Strengths and Weaknesses of Howmet Aerospace Inc. and AMETEK, Inc.:
Howmet Aerospace Inc. Strengths
- Diversified revenue streams across Engine Products, Fastening, and Structure Systems
- Favorable net margin of 15.55%
- Strong ROE at 25.36%
- Current ratio of 2.17 indicates good liquidity
- Global presence with significant U.S. and European sales
AMETEK, Inc. Strengths
- Higher net margin at 19.83%
- Low debt-to-equity ratio of 0.24 supports financial stability
- Strong fixed asset turnover at 6.58 reflects efficient asset use
- Diverse geographic exposure including Asia and Europe
- Balanced revenue from Electromechanical and Electronic Instruments groups
Howmet Aerospace Inc. Weaknesses
- High P/E of 38.63 and P/B of 9.8 suggest overvaluation risk
- Neutral quick ratio at 0.98 hints at moderate short-term liquidity
- Debt-to-assets at 33% is moderately leveraged
- Dividend yield low at 0.24%
- Asset turnover neutral at 0.71
AMETEK, Inc. Weaknesses
- Unfavorable interest coverage near zero raises solvency concerns
- Quick ratio of 0.75 signals weak liquidity
- Net ROE is neutral at 14.25%
- P/E of 30.29 and P/B of 4.32 also indicate valuation risk
- Higher percentage of unfavorable financial ratios (42.86%)
Howmet Aerospace shows strengths in profitability and liquidity with moderate leverage, while AMETEK excels in asset efficiency and debt management but faces liquidity and solvency risks. Both companies display valuation concerns that investors should monitor carefully.
The Moat Duel: Analyzing Competitive Defensibility
A structural moat is the only reliable shield protecting long-term profits from relentless competitive pressures and market erosion:
Howmet Aerospace Inc. (HWM): Engineering Precision and Scale as a Cost Advantage
Howmet Aerospace’s moat stems from its cost advantage and scale in aerospace components. I see this reflected in a strong ROIC that exceeds WACC by nearly 6%, signaling efficient capital use. In 2026, its expanding Engine Products and Fastening Systems segments could deepen this moat through innovation and global reach.
AMETEK, Inc. (AME): Diversified Instrumentation with Intangible Asset Moat
AMETEK relies on intangible assets like proprietary technology and customer relationships, differing from Howmet’s scale focus. Its ROIC trend is positive but lacks full data for detailed moat strength. AME’s broad market exposure and ongoing product development offer potential to widen its competitive edge in 2026.
Cost Leadership vs. Intangible Innovation: The Moat Showdown
Howmet Aerospace commands a wider, more quantifiable moat with a robust ROIC well above WACC, proving durable competitive advantage. AMETEK shows promise but lacks definitive moat metrics. Overall, Howmet is better positioned to defend and grow its market share amid industrial shifts.
Which stock offers better returns?
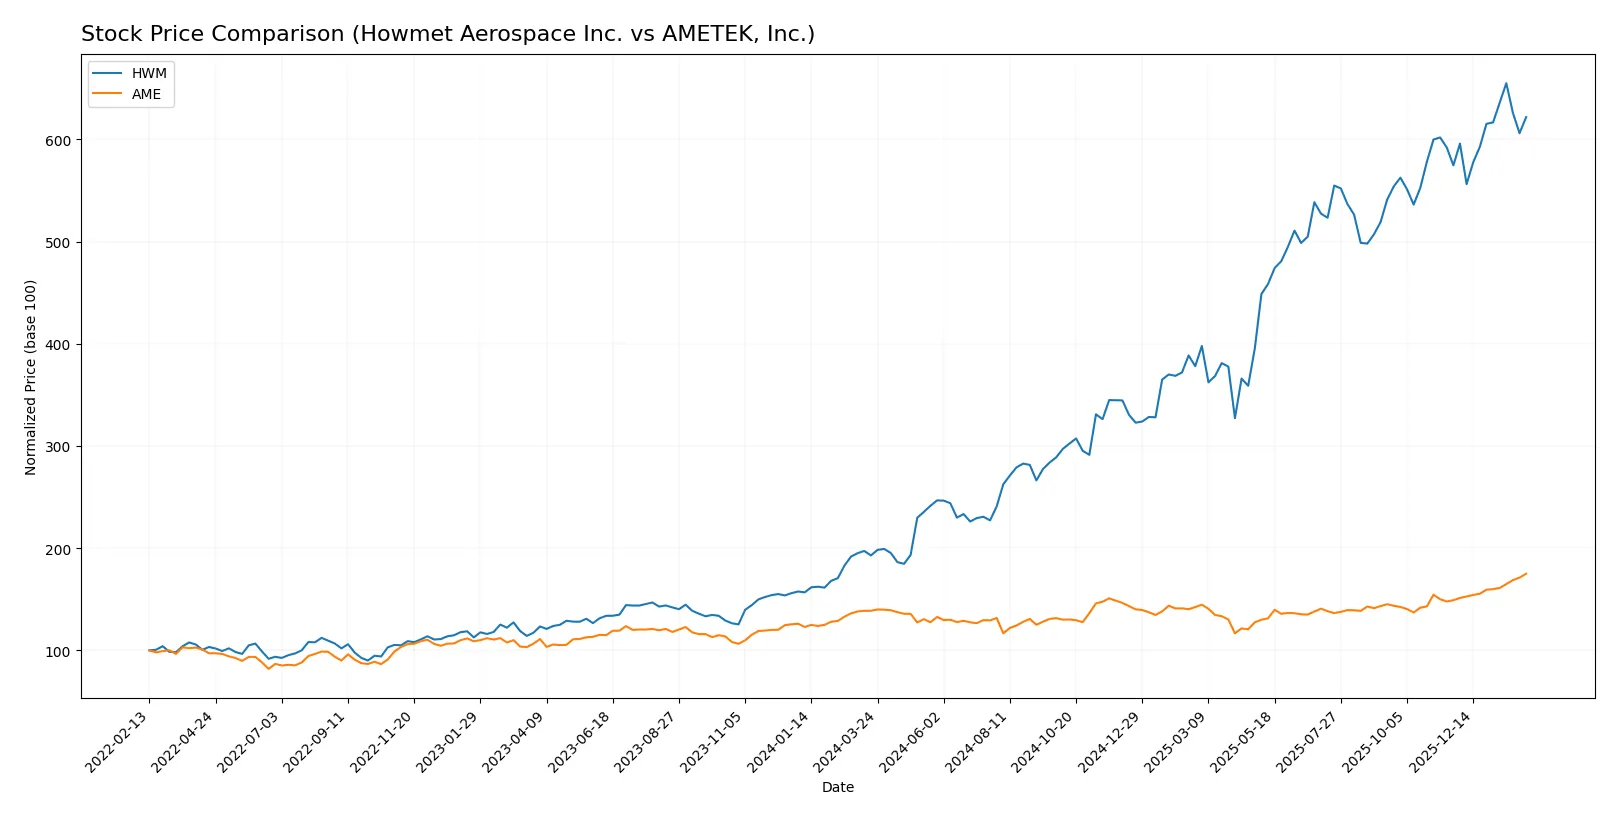
The past year shows sharp gains for both Howmet Aerospace Inc. and AMETEK, Inc., with notable acceleration in price appreciation and distinct trading volume trends.
Trend Comparison
Howmet Aerospace Inc. exhibits a strong bullish trend with a 222.3% price increase over 12 months, accelerating and reaching a high of 224.89, despite a high volatility of 47.85.
AMETEK, Inc. also posts a bullish trend, rising 26.11% over the same period with accelerating momentum and lower volatility at 14.45, hitting a peak price of 228.92.
Howmet Aerospace outperforms AMETEK with a much higher total return over the past year, despite AMETEK’s more consistent volume growth and strong recent buyer dominance.
Target Prices
Analysts present a robust target consensus for Howmet Aerospace Inc. and AMETEK, Inc., indicating confidence in their industrial machinery prospects.
| Company | Target Low | Target High | Consensus |
|---|---|---|---|
| Howmet Aerospace Inc. | 209 | 258 | 238.43 |
| AMETEK, Inc. | 204 | 271 | 231.64 |
The target consensus for Howmet Aerospace stands roughly 12% above its current price of 213.49, suggesting upside potential. AMETEK’s consensus target exceeds its current 228.92 price by about 1.3%, reflecting modest but positive analyst expectations.

Don’t Let Luck Decide Your Entry Point
Optimize your entry points with our advanced ProRealTime indicators. You’ll get efficient buy signals with precise price targets for maximum performance. Start outperforming now!
How do institutions grade them?
Here is a summary of recent institutional grades for Howmet Aerospace Inc. and AMETEK, Inc.:
Howmet Aerospace Inc. Grades
The table below lists recent grades from major institutional investors for Howmet Aerospace Inc.
| Grading Company | Action | New Grade | Date |
|---|---|---|---|
| Citigroup | Maintain | Buy | 2026-01-13 |
| B of A Securities | Maintain | Buy | 2025-11-14 |
| JP Morgan | Maintain | Overweight | 2025-11-10 |
| Goldman Sachs | Maintain | Buy | 2025-11-03 |
| BTIG | Maintain | Buy | 2025-11-03 |
| RBC Capital | Maintain | Outperform | 2025-10-31 |
| TD Cowen | Maintain | Buy | 2025-10-31 |
| UBS | Maintain | Neutral | 2025-10-31 |
| Truist Securities | Maintain | Buy | 2025-10-15 |
| Susquehanna | Maintain | Positive | 2025-10-09 |
AMETEK, Inc. Grades
The table below lists recent grades from major institutional investors for AMETEK, Inc.
| Grading Company | Action | New Grade | Date |
|---|---|---|---|
| Oppenheimer | Downgrade | Perform | 2026-01-27 |
| Morgan Stanley | Maintain | Equal Weight | 2026-01-12 |
| Keybanc | Maintain | Overweight | 2026-01-07 |
| Barclays | Maintain | Equal Weight | 2026-01-07 |
| Keybanc | Maintain | Overweight | 2026-01-06 |
| Mizuho | Maintain | Outperform | 2026-01-05 |
| TD Cowen | Upgrade | Buy | 2025-12-23 |
| DA Davidson | Maintain | Buy | 2025-12-08 |
| Baird | Maintain | Neutral | 2025-11-03 |
| Keybanc | Maintain | Overweight | 2025-10-31 |
Which company has the best grades?
Howmet Aerospace holds consistently strong Buy and Outperform ratings from top institutions. AMETEK’s grades are more mixed, including downgrades and Equal Weight ratings. Stronger grades for Howmet suggest higher institutional confidence, potentially impacting investor sentiment.
Risks specific to each company
The following categories identify critical pressure points and systemic threats facing Howmet Aerospace Inc. and AMETEK, Inc. in the 2026 market environment:
1. Market & Competition
Howmet Aerospace Inc.
- Strong presence in aerospace and transportation; faces intense competition in engineered solutions.
AMETEK, Inc.
- Diversified industrial instruments; competitive pressure from specialized electronic and electromechanical providers.
2. Capital Structure & Debt
Howmet Aerospace Inc.
- Moderate debt-to-equity ratio (0.76); interest coverage favorable at 8.6, indicating manageable leverage.
AMETEK, Inc.
- Low debt-to-equity (0.24); poor interest coverage near zero signals potential liquidity stress.
3. Stock Volatility
Howmet Aerospace Inc.
- Beta of 1.25 suggests above-market volatility; stock price range wide but recent positive momentum.
AMETEK, Inc.
- Beta near 1.04 indicates market-like volatility; more stable but less dynamic price movement.
4. Regulatory & Legal
Howmet Aerospace Inc.
- Aerospace industry exposure entails stringent regulations and compliance costs globally.
AMETEK, Inc.
- Electronic instruments face regulatory scrutiny in environmental and safety standards.
5. Supply Chain & Operations
Howmet Aerospace Inc.
- Global operations subject to raw material price swings and manufacturing disruptions.
AMETEK, Inc.
- Complex supply chain for specialized components; operational efficiency critical to margin preservation.
6. ESG & Climate Transition
Howmet Aerospace Inc.
- Increasing pressure to reduce emissions in aerospace manufacturing; transition risks notable.
AMETEK, Inc.
- Faces challenges in reducing environmental footprint across diverse industrial products.
7. Geopolitical Exposure
Howmet Aerospace Inc.
- Operations in multiple countries expose it to trade tensions and geopolitical instability.
AMETEK, Inc.
- Less global manufacturing footprint but still vulnerable to geopolitical risks in supply sources.
Which company shows a better risk-adjusted profile?
Howmet Aerospace’s key risk is elevated market volatility combined with mid-level leverage but strong interest coverage. AMETEK’s greatest risk is its weak interest coverage despite low debt, posing financial strain concerns. Howmet’s higher beta signals more price swings yet stronger debt servicing. AMETEK’s liquidity red flags and operational complexity weigh more heavily. Overall, Howmet Aerospace offers a better risk-adjusted profile, supported by robust Altman Z-Score (10.43) and Piotroski Score (9) versus AMETEK’s lower scores. Recent data reveals AMETEK’s interest coverage near zero, justifying caution about its financial resilience.
Final Verdict: Which stock to choose?
Howmet Aerospace (HWM) stands out as a powerhouse in operational efficiency and capital returns, consistently creating shareholder value through a durable competitive advantage. Its main point of vigilance lies in a relatively high valuation and some balance sheet leverage, which could pressure risk-sensitive investors. HWM fits well within an aggressive growth portfolio seeking robust profitability and market momentum.
AMETEK (AME) offers a strategic moat anchored in its diversified industrial presence and solid recurring cash flows. It presents a safer financial profile with lower leverage and strong liquidity metrics, appealing to investors prioritizing stability over rapid expansion. AME aligns with a GARP (Growth at a Reasonable Price) portfolio, balancing growth potential and risk management.
If you prioritize high return on invested capital and are comfortable with valuation premiums, Howmet Aerospace outshines as a compelling choice due to its superior value creation and accelerating price trend. However, if you seek better stability and a more conservative balance sheet, AMETEK offers a safer harbor with durable cash flow and moderate growth. Both present attractive but distinct analytical scenarios suited to different investor risk tolerances.
Disclaimer: Investment carries a risk of loss of initial capital. The past performance is not a reliable indicator of future results. Be sure to understand risks before making an investment decision.
Go Further
I encourage you to read the complete analyses of Howmet Aerospace Inc. and AMETEK, Inc. to enhance your investment decisions: