Home > Comparison > Industrials > AME vs GNRC
The strategic rivalry between AMETEK, Inc. and Generac Holdings Inc. shapes the competitive landscape of the industrial machinery sector. AMETEK operates as a diversified manufacturer of electronic instruments and electromechanical devices, while Generac focuses on power generation and energy storage solutions. This analysis pits AMETEK’s broad industrial exposure against Generac’s specialized growth focus, aiming to identify which trajectory offers superior risk-adjusted returns for diversified portfolios.
Table of contents
Companies Overview
AMETEK and Generac stand as key players in the industrial machinery sector, each commanding distinct market niches.
AMETEK, Inc.: Precision Instrumentation Leader
AMETEK dominates the industrial machinery space by manufacturing electronic instruments and electromechanical devices globally. Its revenue hinges on two segments: Electronic Instruments and Electromechanical, serving aerospace, power, and industrial markets. In 2026, the company sharpens its focus on advanced instrumentation and precision components, maintaining a diversified portfolio across critical sectors like aerospace and medical.
Generac Holdings Inc.: Power Generation Specialist
Generac commands the residential and light commercial power generation market. Its core revenue stems from designing and selling power generation equipment and energy storage systems, including standby and portable generators. The 2026 strategy emphasizes expanding clean energy solutions and enhancing remote monitoring capabilities, targeting resilience and energy independence for residential and industrial customers.
Strategic Collision: Similarities & Divergences
Both firms operate in industrial machinery but diverge sharply in scope. AMETEK pursues a broad, precision instrumentation approach, while Generac focuses on power generation and energy solutions. Their primary battleground lies in industrial and commercial applications demanding reliability and innovation. AMETEK offers a diversified, technology-driven investment profile, whereas Generac presents growth tied to energy transition trends and residential power needs.
Income Statement Comparison
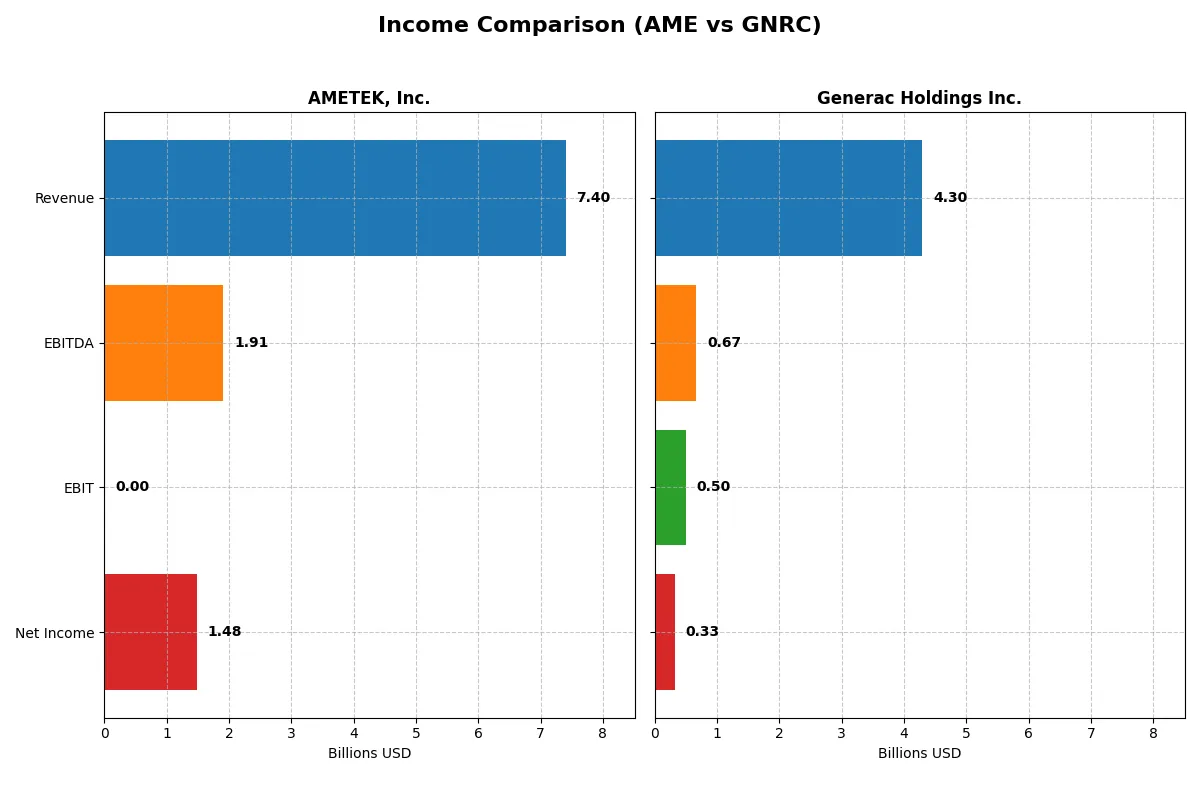
This data dissects the core profitability and scalability of both corporate engines to reveal who dominates the bottom line:
| Metric | AMETEK, Inc. (AME) | Generac Holdings Inc. (GNRC) |
|---|---|---|
| Revenue | 7.4B | 4.3B |
| Cost of Revenue | 0 | 2.6B |
| Operating Expenses | 5.5B | 1.1B |
| Gross Profit | 0 | 1.7B |
| EBITDA | 1.9B | 671M |
| EBIT | 0 | 499M |
| Interest Expense | -81M | 90M |
| Net Income | 1.5B | 325M |
| EPS | 6.42 | 5.46 |
| Fiscal Year | 2025 | 2024 |
Income Statement Analysis: The Bottom-Line Duel
This income statement comparison reveals which company operates its business with greater efficiency and bottom-line strength.
AMETEK, Inc. Analysis
AMETEK’s revenue grew steadily from 5.5B in 2021 to 7.4B in 2025, with net income rising from 990M to 1.48B. Its net margin holds firm at 20%, signaling strong profitability despite an unfavorable gross margin report in 2025. The company’s EPS increased by nearly 8% in the last year, reflecting solid operational momentum.
Generac Holdings Inc. Analysis
Generac’s revenue climbed from 2.5B in 2020 to 4.3B in 2024, showing faster top-line growth than AMETEK. Net income, however, declined to 325M in 2024 from a 533M peak in 2021. Its gross and EBIT margins remain healthy at nearly 39% and 12%, but net margin at 7.6% lags behind, despite recent strong EPS growth of 65%.
Margin Muscle vs. Revenue Momentum
AMETEK delivers superior net income growth and margin stability, while Generac boasts faster revenue and gross profit expansion but suffers net income contraction. For investors focused on consistent profitability and margin resilience, AMETEK’s profile appears more attractive. Generac’s dynamic top-line growth comes with margin pressure, increasing risk.
Financial Ratios Comparison
These vital ratios act as a diagnostic tool to expose the underlying fiscal health, valuation premiums, and capital efficiency of the companies compared below:
| Ratios | AMETEK, Inc. (AME) | Generac Holdings Inc. (GNRC) |
|---|---|---|
| ROE | 14.25% | 13.04% |
| ROIC | 11.13% | 9.89% |
| P/E | 30.29 | 28.39 |
| P/B | 4.32 | 3.70 |
| Current Ratio | 1.24 | 1.97 |
| Quick Ratio | 0.75 | 0.97 |
| D/E | 0.24 | 0.59 |
| Debt-to-Assets | 15.89% | 28.88% |
| Interest Coverage | 15.75 | 5.98 |
| Asset Turnover | 0.47 | 0.84 |
| Fixed Asset Turnover | 6.58 | 5.01 |
| Payout Ratio | 18.81% | 0.08% |
| Dividend Yield | 0.62% | 0.003% |
| Fiscal Year | 2024 | 2024 |
Efficiency & Valuation Duel: The Vital Signs
Ratios act as a company’s DNA, uncovering hidden risks and revealing operational strengths that shape investment decisions.
AMETEK, Inc.
AMETEK posts a solid 14.25% ROE and a strong 19.83% net margin, signaling efficient profitability. However, its P/E of 30.29 and P/B of 4.32 label the stock as stretched. The modest 0.62% dividend yield offers limited shareholder returns, indicating a preference for reinvestment in growth and R&D.
Generac Holdings Inc.
Generac shows a 13.04% ROE with a moderate 7.57% net margin, reflecting operational steadiness but less efficiency than AMETEK. Its P/E at 28.39 remains high, though less stretched. The absence of dividends shifts focus to growth reinvestment amid a favorable current ratio and healthy interest coverage.
Premium Valuation vs. Operational Safety
AMETEK’s higher profitability contrasts with stretched valuation metrics, while Generac balances moderate returns with healthier liquidity and debt metrics. Risk-averse investors may prefer Generac’s operational safety, whereas growth-focused investors might tolerate AMETEK’s premium for stronger margins.
Which one offers the Superior Shareholder Reward?
I see AMETEK, Inc. (AME) delivers a modest 0.62% dividend yield with a conservative 19% payout ratio, supported by strong free cash flow coverage (4.7x). Its steady buyback program adds to shareholder returns. Generac Holdings Inc. (GNRC) barely pays dividends (0.003%) and reinvests aggressively in growth, yet its buybacks are less pronounced. Historically, AME’s balanced distribution model offers more sustainable total returns through dividends plus disciplined buybacks. I favor AME for 2026 investors seeking consistent income and capital appreciation.
Comparative Score Analysis: The Strategic Profile
The radar chart reveals the fundamental DNA and trade-offs of AMETEK, Inc. and Generac Holdings Inc., highlighting their core financial strengths and vulnerabilities:
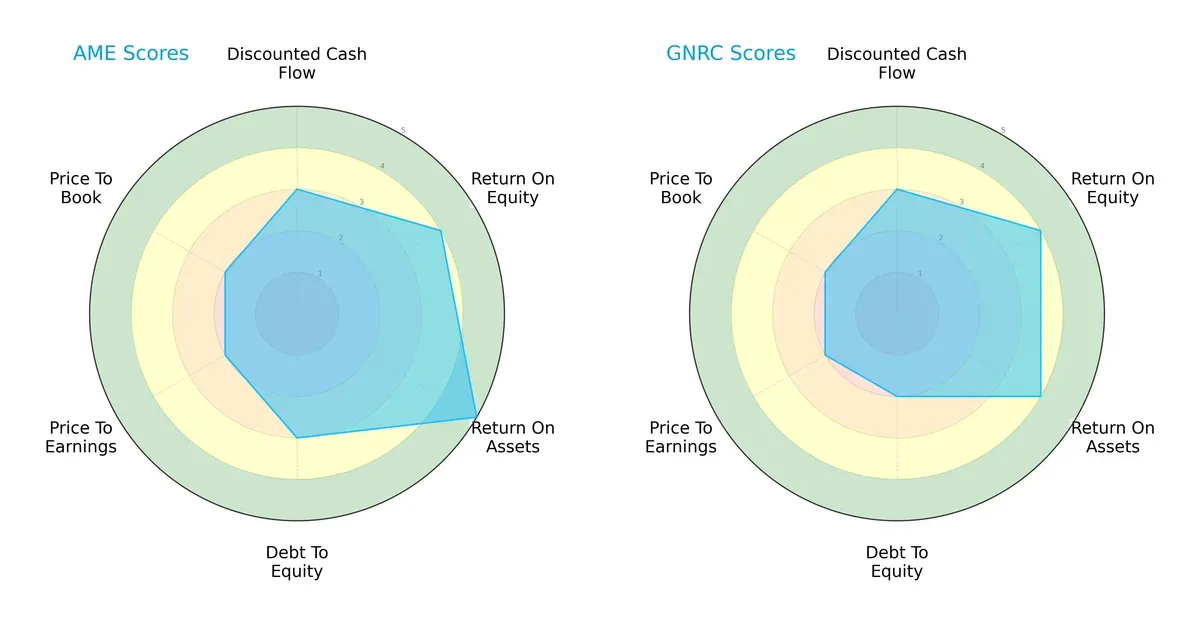
AMETEK boasts a stronger asset utilization (ROA 5 vs. 4) and a more balanced debt profile (Debt/Equity score 3 vs. 2). Both firms share equal efficiency in equity returns (ROE 4) and discounted cash flow valuation (DCF 3). However, AMETEK’s slightly weaker valuation scores (PE/PB 2 each) suggest a more conservative market pricing. Overall, AMETEK presents a more balanced financial profile, while Generac leans on operational efficiency with a slightly higher financial risk.
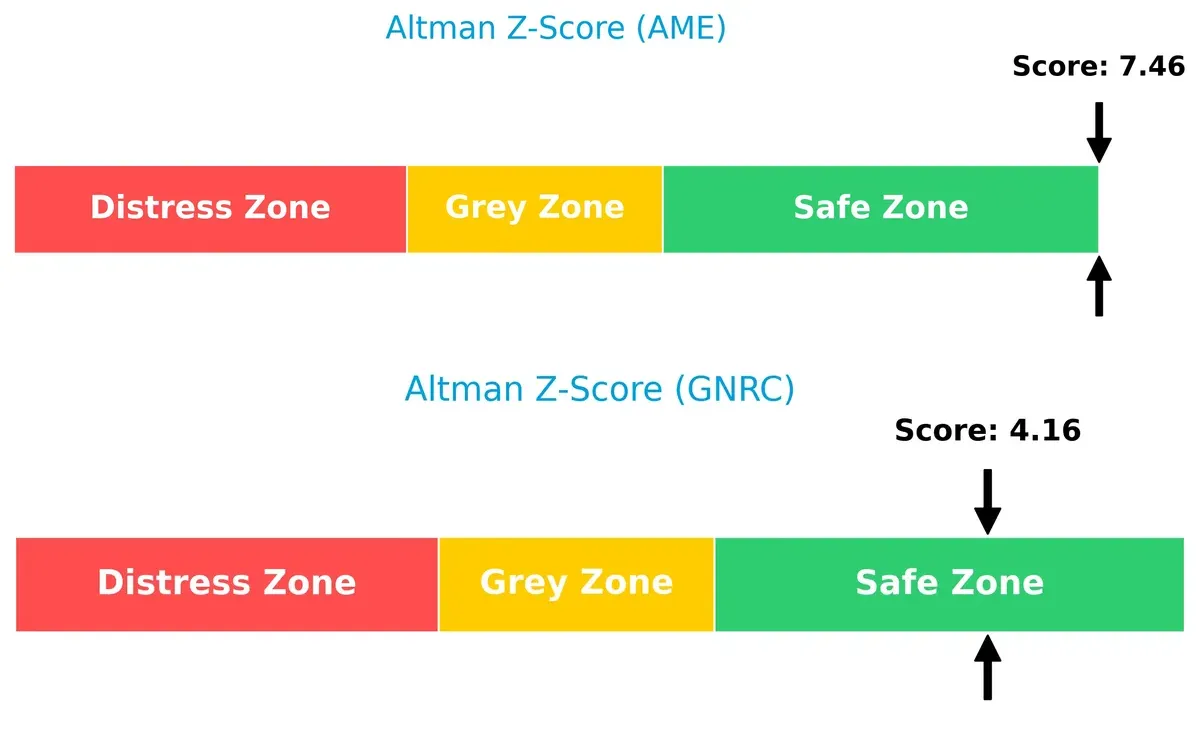
Bankruptcy Risk: Solvency Showdown
AMETEK’s Altman Z-Score of 7.46 significantly outpaces Generac’s 4.16, signaling a much stronger buffer against bankruptcy risks in this cycle:
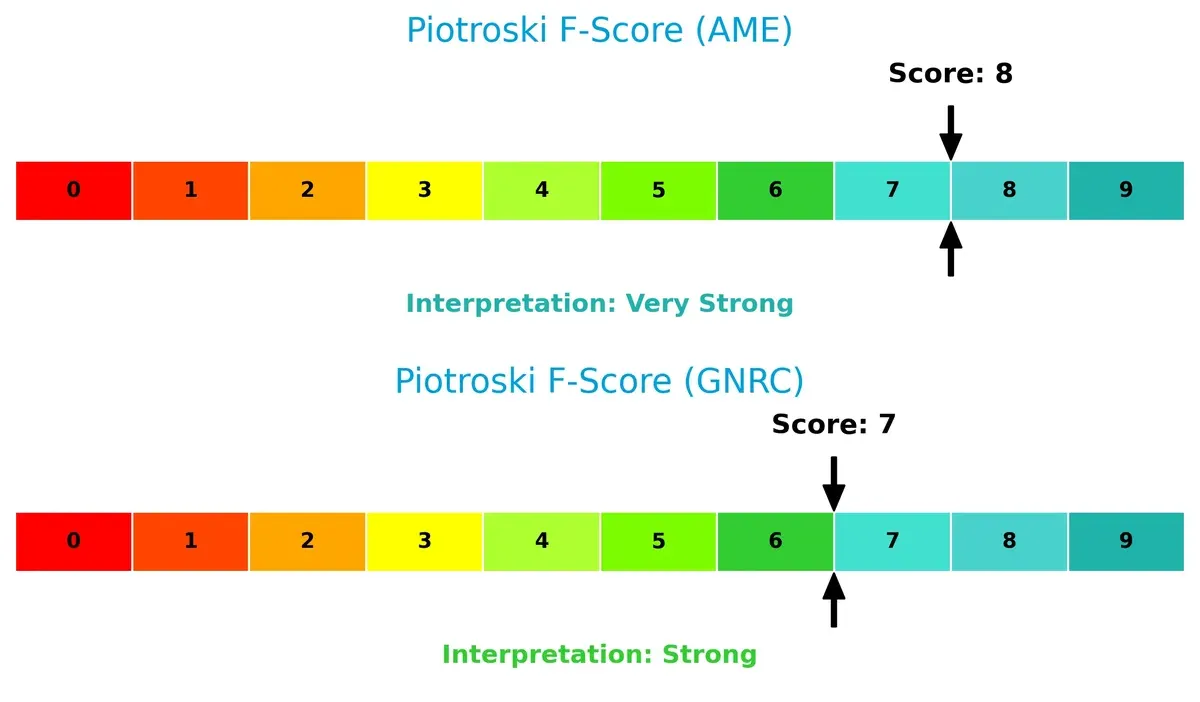
Financial Health: Quality of Operations
AMETEK scores an 8 on the Piotroski F-Score, indicating very strong financial health. Generac’s 7 also suggests strength but reveals slightly more internal risk compared to AMETEK:
How are the two companies positioned?
This section dissects AMETEK and Generac’s operational DNA by comparing revenue distribution and internal strengths and weaknesses. The goal is to confront their economic moats, revealing which model delivers the most resilient competitive advantage today.
Revenue Segmentation: The Strategic Mix
The following visual comparison dissects how both firms diversify their income streams and where their primary sector bets lie:

AMETEK, Inc. splits revenue mainly between its Electronic Instruments Group ($4.66B) and Electromechanical Group ($2.28B) in 2024. This mix shows moderate diversification, balancing precision instruments with electromechanical solutions. Generac Holdings lacks available segmentation data, preventing direct comparison. AMETEK’s dual-segment approach reduces concentration risk and supports ecosystem lock-in in industrial and instrumentation markets. Investors should note this balanced revenue base as a strategic strength amid sector volatility.
Strengths and Weaknesses Comparison
This table compares the Strengths and Weaknesses of AMETEK, Inc. and Generac Holdings Inc.:
AME Strengths
- Diverse revenue from Electromechanical and Electronic Instruments groups
- Strong net margin at 19.83%
- Favorable debt-to-assets at 15.89%
- High fixed asset turnover at 6.58
- Global presence across US, EU, UK, Asia, and others
GNRC Strengths
- Favorable current ratio at 1.97 indicates strong liquidity
- Interest coverage ratio of 5.56 supports debt service
- Balanced ROE and ROIC around 13% and 9.89%
- Favorable fixed asset turnover at 5.01
- Lower debt-to-assets ratio at 28.88%
AME Weaknesses
- Unfavorable PE at 30.29 and PB at 4.32 signal high valuation
- Quick ratio low at 0.75 suggests liquidity risks
- Negative interest coverage shows interest expense pressure
- Asset turnover weak at 0.47 limits efficiency
- Low dividend yield at 0.62%
- Global ratios slightly unfavorable overall
GNRC Weaknesses
- PE at 28.39 and PB at 3.7 also show valuation concerns
- WACC at 11.42% unfavorable versus ROIC
- Dividend yield at 0% offers no income
- Neutral asset turnover at 0.84 limits sales efficiency
- Debt-to-equity at 0.59 implies higher leverage risk
Both companies maintain strengths in asset turnover and market presence, but AME’s higher profit margins contrast with GNRC’s better liquidity. Valuation and leverage metrics present cautionary signals for investors.
The Moat Duel: Analyzing Competitive Defensibility
A structural moat is the only barrier protecting long-term profits from relentless competition and market pressure. Let’s examine how AMETEK and Generac defend their turf:
AMETEK, Inc.: Diversified Industrial Precision Moat
I see AMETEK’s moat in its intangible assets and engineered product complexity. Its consistently growing ROIC signals efficient capital use and margin resilience. Expansion into aerospace and power markets in 2026 should deepen this advantage.
Generac Holdings Inc.: Niche Power Solutions Moat
Generac’s moat relies on brand strength and product innovation in residential standby generators. However, a declining ROIC and value destruction highlight weakening efficiency. New clean energy products offer upside but may not offset competitive pressures yet.
The Moat Showdown: Engineering Complexity vs. Brand Reliance
AMETEK’s wider moat shows through rising returns and diversified markets, unlike Generac’s shrinking capital efficiency. AMETEK is better positioned to defend and grow its market share amid intensifying competition.
Which stock offers better returns?
Both AMETEK, Inc. and Generac Holdings Inc. exhibit strong bullish trends over the past year, with significant price gains and accelerating momentum.
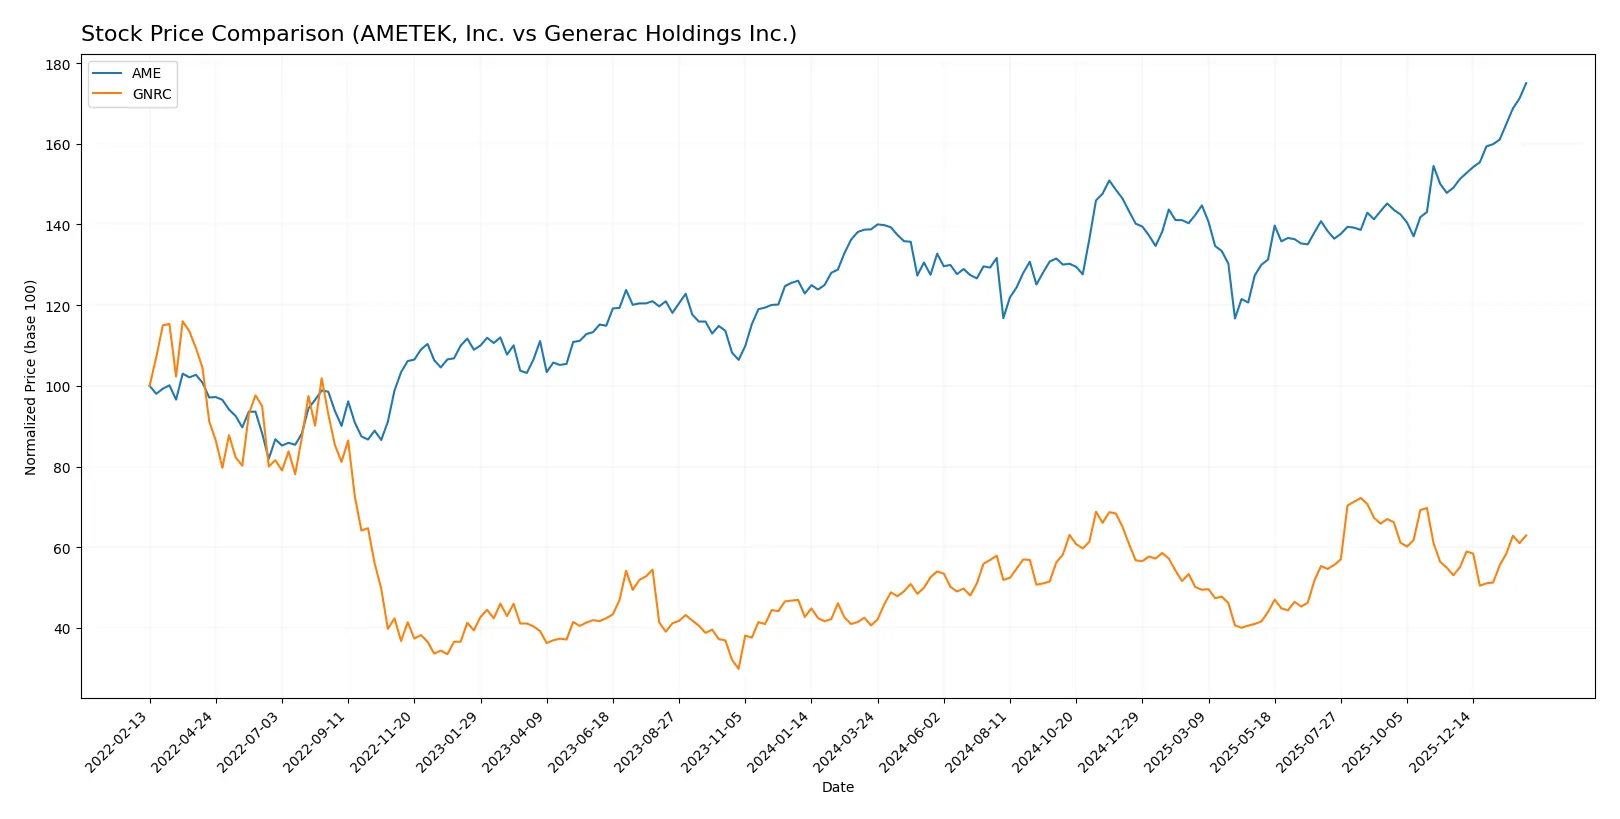
Trend Comparison
AMETEK, Inc. shows a 26.11% price increase over the past 12 months with accelerating momentum and a volatility of 14.45%. The stock reached a high of 228.92 and a low of 152.66.
Generac Holdings Inc. delivered a 54.88% rise over the same period, also accelerating, but with higher volatility at 21.83%. Its price ranged between 110.25 and 198.8 during the year.
Generac outperformed AMETEK by a wide margin, delivering the highest market gains despite greater price fluctuations and a decelerating recent slope compared to AMETEK.
Target Prices
Analysts present a moderately bullish consensus for AMETEK, Inc. and Generac Holdings Inc.
| Company | Target Low | Target High | Consensus |
|---|---|---|---|
| AMETEK, Inc. | 204 | 271 | 231.64 |
| Generac Holdings Inc. | 184 | 248 | 208.13 |
The target consensus for AMETEK sits slightly above its current price of 229, indicating modest upside potential. Generac’s consensus target exceeds its current 173 share price by about 20%, reflecting stronger expected growth.

Don’t Let Luck Decide Your Entry Point
Optimize your entry points with our advanced ProRealTime indicators. You’ll get efficient buy signals with precise price targets for maximum performance. Start outperforming now!
How do institutions grade them?
AMETEK, Inc. Grades
This table summarizes recent grades from leading financial institutions for AMETEK, Inc.:
| Grading Company | Action | New Grade | Date |
|---|---|---|---|
| Oppenheimer | Downgrade | Perform | 2026-01-27 |
| Morgan Stanley | Maintain | Equal Weight | 2026-01-12 |
| Keybanc | Maintain | Overweight | 2026-01-07 |
| Barclays | Maintain | Equal Weight | 2026-01-07 |
| Keybanc | Maintain | Overweight | 2026-01-06 |
| Mizuho | Maintain | Outperform | 2026-01-05 |
| TD Cowen | Upgrade | Buy | 2025-12-23 |
| DA Davidson | Maintain | Buy | 2025-12-08 |
| Baird | Maintain | Neutral | 2025-11-03 |
| Keybanc | Maintain | Overweight | 2025-10-31 |
Generac Holdings Inc. Grades
The following table shows recent institutional grades for Generac Holdings Inc.:
| Grading Company | Action | New Grade | Date |
|---|---|---|---|
| Barclays | Maintain | Equal Weight | 2026-01-20 |
| Canaccord Genuity | Maintain | Buy | 2026-01-13 |
| Baird | Upgrade | Outperform | 2026-01-09 |
| Citigroup | Upgrade | Buy | 2026-01-08 |
| B of A Securities | Maintain | Buy | 2026-01-07 |
| Wells Fargo | Upgrade | Overweight | 2025-12-19 |
| JP Morgan | Upgrade | Overweight | 2025-12-08 |
| Citigroup | Maintain | Neutral | 2025-11-03 |
| Barclays | Maintain | Equal Weight | 2025-10-31 |
| Canaccord Genuity | Maintain | Buy | 2025-10-30 |
Which company has the best grades?
Generac Holdings consistently earns more positive upgrades and higher ratings such as Buy and Outperform. AMETEK shows mixed ratings with some downgrades and neutral positions. This divergence may influence investor sentiment and portfolio positioning.
Risks specific to each company
The following categories identify critical pressure points and systemic threats facing AMETEK, Inc. and Generac Holdings Inc. in the 2026 market environment:
1. Market & Competition
AMETEK, Inc.
- Operates in diversified industrial machinery with steady demand, but faces pricing pressure from global competitors.
Generac Holdings Inc.
- Focuses on power generation with growing competition from renewable energy solutions and new entrants.
2. Capital Structure & Debt
AMETEK, Inc.
- Low debt-to-equity (0.24) and debt-to-assets (16%) ratios signal conservative leverage. Interest coverage issues raise a red flag.
Generac Holdings Inc.
- Higher leverage (debt-to-equity 0.59) but strong interest coverage (5.56), indicating manageable debt service capacity.
3. Stock Volatility
AMETEK, Inc.
- Beta near market average (1.04) implies moderate price swings aligned with broader industrial sector trends.
Generac Holdings Inc.
- Elevated beta (1.81) reflects higher volatility, typical for niche industrial firms exposed to energy market cycles.
4. Regulatory & Legal
AMETEK, Inc.
- Subject to industrial and aerospace regulations; compliance complexity increases costs but barriers protect market share.
Generac Holdings Inc.
- Faces regulatory scrutiny on emissions and energy storage safety; evolving standards create uncertainty.
5. Supply Chain & Operations
AMETEK, Inc.
- Complex global supply chains for electronic instruments may face disruption risks amid geopolitical tensions.
Generac Holdings Inc.
- Supply constraints for power components and batteries could impact production and delivery timelines.
6. ESG & Climate Transition
AMETEK, Inc.
- Moderate ESG risks; investments in energy-efficient products align with industrial decarbonization trends.
Generac Holdings Inc.
- Higher ESG exposure due to fossil fuel dependence; transition to clean energy products underway but still nascent.
7. Geopolitical Exposure
AMETEK, Inc.
- Diversified international footprint with some exposure to trade tensions affecting aerospace and industrial sales.
Generac Holdings Inc.
- Primarily US-focused but vulnerable to tariffs and regulatory changes impacting supply chain costs.
Which company shows a better risk-adjusted profile?
AMETEK’s biggest risk is weak interest coverage despite low leverage, threatening financial flexibility. Generac faces high stock volatility and ESG transition risks amid modest debt levels. AMETEK’s strong Altman Z-Score (7.46) and Piotroski Score (8) suggest superior financial health. Generac’s scores also lie in the safe and strong zones but trail AMETEK. Given this, AMETEK presents a better risk-adjusted profile, bolstered by its diversified operations and conservative debt, despite some liquidity concerns. Generac’s elevated beta and ESG challenges warrant caution as the clean energy transition accelerates.
Final Verdict: Which stock to choose?
AMETEK, Inc. excels as a cash-generating machine with steadily improving ROIC, highlighting skilled capital allocation. Its point of vigilance lies in a moderate current ratio and some valuation premium. It suits investors seeking aggressive growth backed by operational efficiency and resilient cash flow.
Generac Holdings Inc. boasts a strategic moat through its recurring revenue and robust income quality, offering a safer harbor with stronger liquidity and interest coverage. It fits well in a GARP (Growth at a Reasonable Price) portfolio, balancing growth potential with financial stability.
If you prioritize operational efficiency and cash flow strength, AMETEK outshines due to its growing ROIC and disciplined capital use. However, if you seek better liquidity and a steadier safety profile, Generac offers superior stability despite a declining ROIC trend. Both present distinct strategic appeals depending on your risk tolerance and portfolio goals.
Disclaimer: Investment carries a risk of loss of initial capital. The past performance is not a reliable indicator of future results. Be sure to understand risks before making an investment decision.
Go Further
I encourage you to read the complete analyses of AMETEK, Inc. and Generac Holdings Inc. to enhance your investment decisions: