Home > Comparison > Industrials > EMR vs AME
The strategic rivalry between Emerson Electric Co. and AMETEK, Inc. shapes the Industrials sector’s machinery landscape. Emerson operates a broad, capital-intensive model spanning automation and commercial solutions, serving diverse global markets. AMETEK focuses on high-precision electronic instruments and electromechanical devices, targeting specialized aerospace and process industries. This analysis contrasts their operational approaches to identify which offers a superior risk-adjusted growth trajectory for diversified portfolios in a competitive industrial environment.
Table of contents
Companies Overview
Emerson Electric Co. and AMETEK, Inc. play pivotal roles in the industrial machinery sector, shaping global industrial innovation.
Emerson Electric Co.: Industrial Automation Powerhouse
Emerson Electric Co. stands as a leading technology and engineering firm in industrial markets worldwide. It generates revenue primarily through Automation Solutions and Commercial & Residential Solutions, offering measurement instruments, control systems, and HVAC products. In 2026, Emerson focuses strategically on expanding automation software and enhancing energy-efficient residential controls to sustain its industrial and commercial footprint.
AMETEK, Inc.: Precision Electronic Instruments Specialist
AMETEK, Inc. excels as a manufacturer of electronic instruments and electromechanical devices serving diverse industrial and aerospace markets. It drives revenue via Electronic Instruments and Electromechanical segments, supplying advanced process instruments, sensors, and precision motion controls. The company’s 2026 strategy emphasizes innovation in aerospace sensors and the expansion of precision motion technologies across industrial applications.
Strategic Collision: Similarities & Divergences
Both companies operate within industrial machinery but diverge in focus—Emerson pursues broad automation and HVAC solutions, while AMETEK specializes in precision electronic instruments. Their primary battleground lies in industrial process control and instrumentation markets. Emerson’s broad-scale automation contrasts with AMETEK’s niche precision, defining distinct investment profiles: Emerson as a diversified industrial leader, AMETEK as a focused technological innovator.
Income Statement Comparison
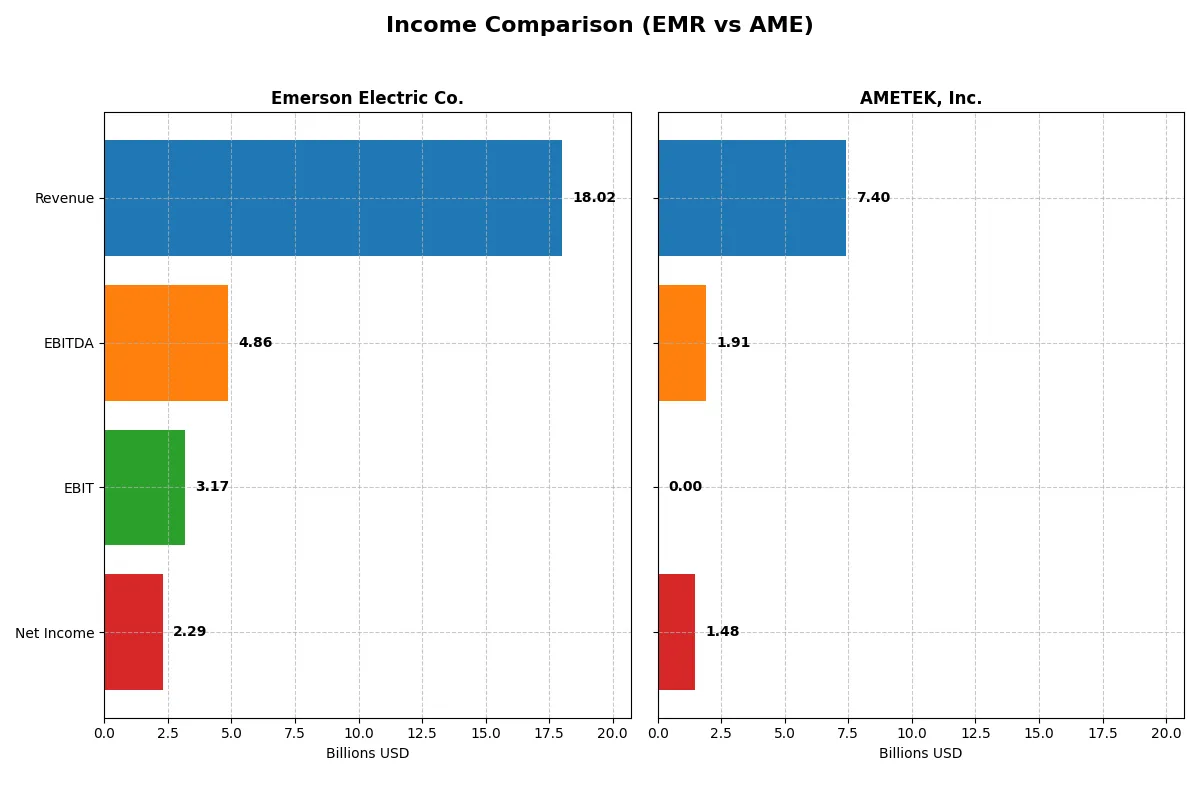
This data dissects the core profitability and scalability of both corporate engines to reveal who dominates the bottom line:
| Metric | Emerson Electric Co. (EMR) | AMETEK, Inc. (AME) |
|---|---|---|
| Revenue | 18.0B | 7.4B |
| Cost of Revenue | 8.5B | 0 |
| Operating Expenses | 7.3B | 5.5B |
| Gross Profit | 9.5B | 0 |
| EBITDA | 4.9B | 1.9B |
| EBIT | 3.2B | 0 |
| Interest Expense | 237M | -81M |
| Net Income | 2.3B | 1.5B |
| EPS | 4.06 | 6.42 |
| Fiscal Year | 2025 | 2025 |
Income Statement Analysis: The Bottom-Line Duel
This income statement comparison reveals which company operates with superior efficiency and delivers stronger profitability in their core business.
Emerson Electric Co. Analysis
Emerson’s revenue grew steadily from 13.8B in 2022 to 18B in 2025, a 39% increase over five years. Net income shows volatility, peaking in 2023 due to discontinued operations but settling at 2.3B in 2025. Gross margin remains robust at 52.8%, while net margin stands at 12.7%, signaling healthy profitability. The 2025 year shows improved EBIT margin (17.6%) and a solid 13% net margin growth, reflecting operational momentum.
AMETEK, Inc. Analysis
AMETEK’s revenue advanced from 5.5B in 2021 to 7.4B in 2025, a 33% gain over five years. Net income grew consistently to 1.48B in 2025, with net margin at a strong 20%. However, the absence of gross profit data in 2025 obscures margin analysis. EBIT margin is reported as zero in 2025, complicating efficiency assessment. Despite this, EPS growth near 8% and overall net income growth close to 50% indicate solid earnings momentum.
Margin Power vs. Revenue Scale
Emerson leads with superior gross and EBIT margins, underpinned by a historically stable cost structure and strong operational efficiency. AMETEK shows impressive net margin and faster net income growth but lacks full transparency on 2025 gross and EBIT margins. Emerson’s profile suits investors favoring margin durability, while AMETEK appeals to those prioritizing rapid bottom-line expansion despite some data opacity.
Financial Ratios Comparison
These vital ratios act as a diagnostic tool to expose the underlying fiscal health, valuation premiums, and capital efficiency of the companies analyzed:
| Ratios | Emerson Electric Co. (EMR) | AMETEK, Inc. (AME) |
|---|---|---|
| ROE | 11.31% | 14.25% |
| ROIC | 4.60% | 11.13% |
| P/E | 32.42 | 30.29 |
| P/B | 3.67 | 4.32 |
| Current Ratio | 0.88 | 1.24 |
| Quick Ratio | 0.65 | 0.75 |
| D/E (Debt-to-Equity) | 0.68 | 0.24 |
| Debt-to-Assets | 32.79% | 15.89% |
| Interest Coverage | 9.44 | 15.75 |
| Asset Turnover | 0.43 | 0.47 |
| Fixed Asset Turnover | 5.14 | 6.58 |
| Payout ratio | 52.0% | 18.8% |
| Dividend yield | 1.60% | 0.62% |
| Fiscal Year | 2025 | 2024 |
Efficiency & Valuation Duel: The Vital Signs
Ratios act as a company’s DNA, revealing hidden risks and operational strengths that shape investment decisions.
Emerson Electric Co.
Emerson Electric posts a modest 11.3% ROE with a favorable 12.7% net margin, showing solid profitability but stretched valuation at a 32.4 P/E. Its low current ratio of 0.88 flags liquidity risks. The company offers a 1.6% dividend yield, balancing shareholder returns amid limited reinvestment in R&D.
AMETEK, Inc.
AMETEK delivers a stronger 14.3% ROE and a robust 19.8% net margin, though its P/E of 30.3 also signals a pricey stock. The 1.24 current ratio signals healthier liquidity, but a weak interest coverage ratio raises caution. Dividend yield at 0.62% is low, reflecting a focus on operational efficiency over payouts.
Premium Valuation vs. Operational Safety
Both companies face slightly unfavorable valuation metrics, yet AMETEK’s superior profitability and liquidity offer a better risk-reward balance. Emerson suits income-focused investors seeking steady dividends, while AMETEK appeals to those prioritizing operational strength and growth potential.
Which one offers the Superior Shareholder Reward?
I see Emerson Electric (EMR) delivers a higher dividend yield of 1.6% with a payout ratio near 52%, reflecting solid free cash flow coverage. Its buyback activity is less aggressive but steady. AMETEK (AME) offers a lower dividend yield around 0.6%, with a conservative payout below 20%, reinvesting heavily in growth. AME’s buybacks are more significant, enhancing total returns despite the smaller dividend. Historically, EMR’s model balances income and buybacks sustainably, suitable for income-focused investors. AME’s reinvestment and buybacks target higher growth but carry reinvestment risk. In 2026, I judge EMR’s distribution approach provides a more attractive and reliable total shareholder return profile.
Comparative Score Analysis: The Strategic Profile
The radar chart exposes the fundamental DNA and trade-offs of Emerson Electric Co. and AMETEK, Inc., revealing their strategic financial strengths and weaknesses:
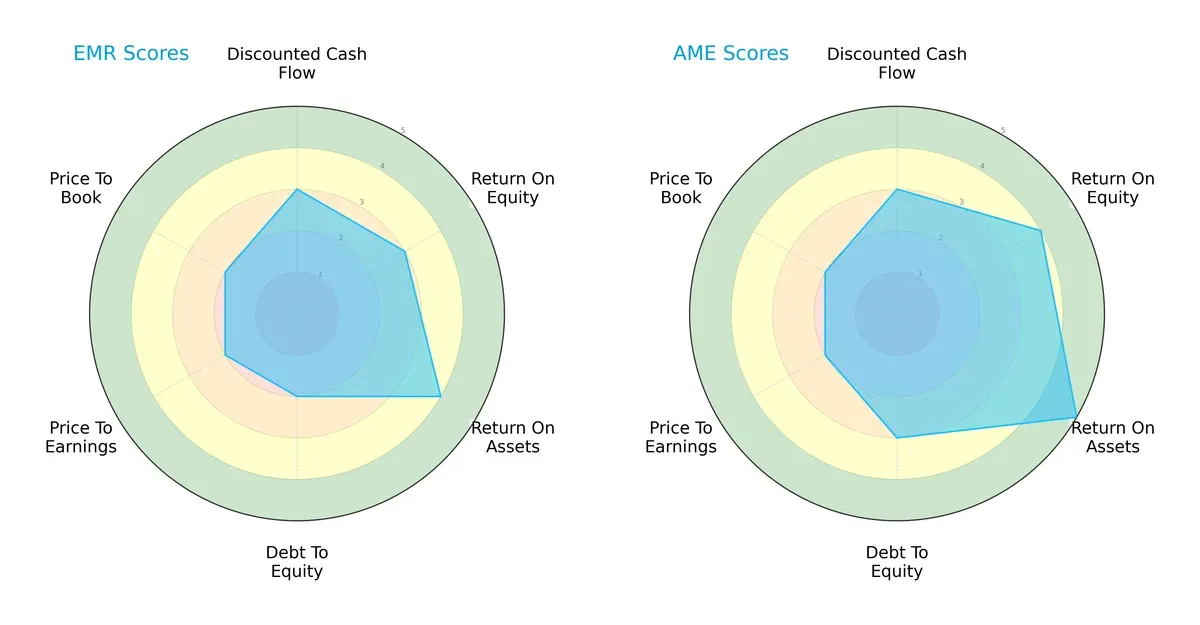
AMETEK outperforms Emerson in return on equity (4 vs. 3) and return on assets (5 vs. 4), signaling superior asset utilization and shareholder returns. Emerson’s weaker debt-to-equity score (2 vs. 3) indicates higher leverage risk. Both companies show moderate discounted cash flow and valuation scores, but AMETEK presents a more balanced and efficient profile, while Emerson relies more heavily on asset efficiency.
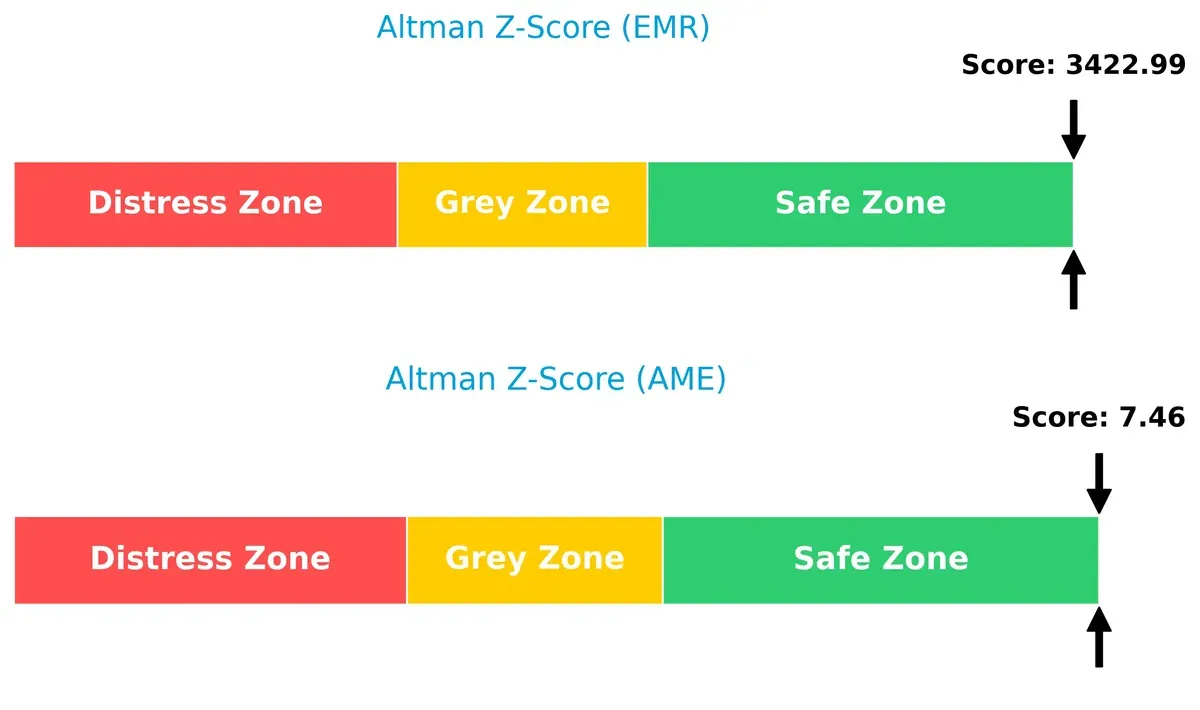
Bankruptcy Risk: Solvency Showdown
AMETEK’s Altman Z-Score (7.46) substantially exceeds Emerson’s (3.42), indicating stronger solvency and a safer long-term survival outlook in this economic cycle:
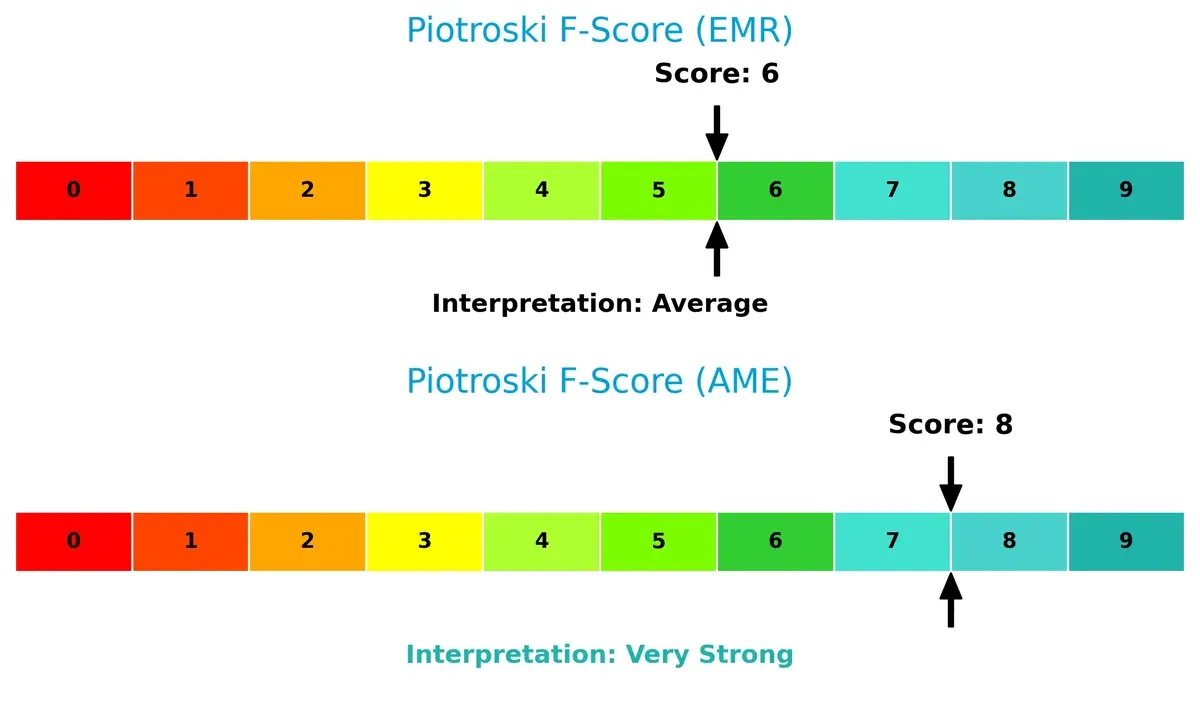
Financial Health: Quality of Operations
AMETEK’s Piotroski F-Score of 8 reflects very strong financial health and operational efficiency, whereas Emerson’s score of 6 suggests average performance with potential internal weaknesses:
How are the two companies positioned?
This section dissects Emerson Electric Co. and AMETEK, Inc.’s operational DNA by comparing their revenue distribution and internal dynamics. The goal is to confront their economic moats and identify which model offers the most resilient, sustainable competitive advantage today.
Revenue Segmentation: The Strategic Mix
This visual comparison dissects how Emerson Electric Co. and AMETEK, Inc. diversify their income streams and where their primary sector bets lie:
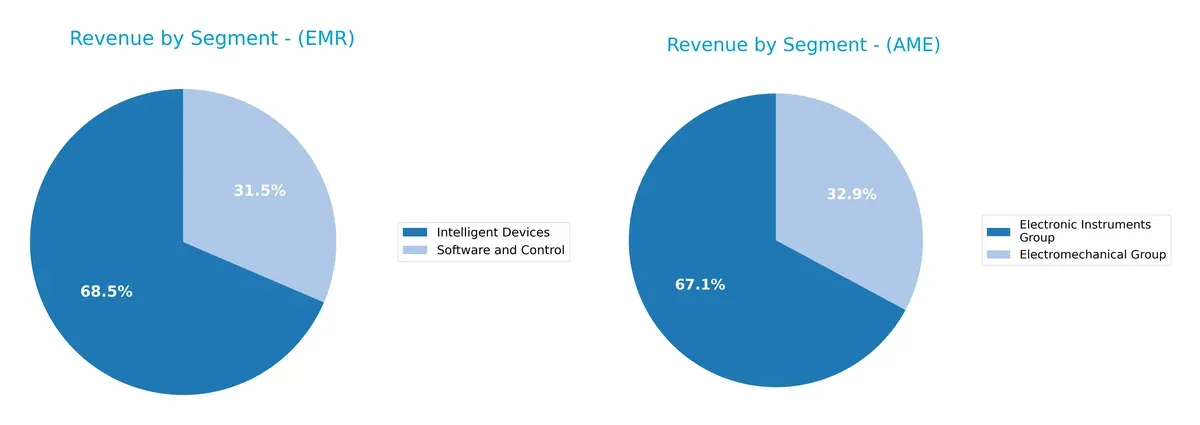
Emerson Electric Co. anchors its revenue in Intelligent Devices at $12.4B and Software and Control at $5.7B, showing moderate diversification. AMETEK, Inc. pivots between two segments: Electronic Instruments Group at $4.7B and Electromechanical Group at $2.3B. Emerson’s portfolio suggests ecosystem lock-in with tech-heavy solutions, while AMETEK’s split indicates focused industrial instrumentation exposure but slightly less concentration risk.
Strengths and Weaknesses Comparison
This table compares the Strengths and Weaknesses of Emerson Electric Co. (EMR) and AMETEK, Inc. (AME):
EMR Strengths
- Diversified product segments including Intelligent Devices and Software and Control
- Favorable net margin at 12.73%
- Strong interest coverage ratio at 13.38
- Favorable fixed asset turnover at 5.14
- Significant global presence with large Americas revenue
AME Strengths
- Favorable net margin at 19.83%
- Favorable low debt-to-equity at 0.24 and debt-to-assets at 15.89%
- Favorable fixed asset turnover at 6.58
- Solid diversification between Electromechanical and Electronic Instruments groups
EMR Weaknesses
- Unfavorable ROIC at 4.6% below WACC at 8.89%
- Unfavorable valuation multiples (PE 32.42, PB 3.67)
- Weak liquidity ratios (current ratio 0.88, quick ratio 0.65)
- Unfavorable asset turnover at 0.43
- Neutral ROE and debt levels
AME Weaknesses
- Unfavorable valuation multiples (PE 30.29, PB 4.32)
- Unfavorable interest coverage near zero
- Unfavorable quick ratio at 0.75
- Unfavorable dividend yield at 0.62%
- Unavailable ROIC and WACC data
Emerson shows strength in product and geographic diversification with solid profitability and interest coverage but faces liquidity and capital efficiency challenges. AMETEK enjoys higher profitability and stronger capital structure but contends with weak interest coverage and incomplete data on capital returns. Both companies exhibit slightly unfavorable overall ratio profiles, signaling areas requiring strategic attention.
The Moat Duel: Analyzing Competitive Defensibility
A structural moat protects long-term profits from competition erosion. Without it, profits quickly vanish under competitive pressure:
Emerson Electric Co.: Industrial Automation & Integration Moat
Emerson leverages intangible assets and scale in automation solutions, reflected in stable 17.6% EBIT margins. However, declining ROIC signals weakening moat durability in 2026.
AMETEK, Inc.: Precision Instruments & Electromechanical Innovation Moat
AMETEK’s moat stems from specialized electronic instruments and motion control, driving 20% net margins and a rising ROIC trend. Its focused niche offers expansion into aerospace and medical markets.
Moat Strength Battle: Scale & Diversification vs. Niche Specialization
Emerson’s broad industrial scale faces erosion with falling ROIC. AMETEK’s specialized innovation shows a healthier ROIC trajectory. I see AMETEK with the deeper moat, better positioned to defend market share in 2026.
Which stock offers better returns?
Both Emerson Electric Co. and AMETEK, Inc. exhibit strong price gains over the past year, reflecting bullish momentum with notable acceleration in their upward trends.

Trend Comparison
Emerson Electric Co. shows a 37.54% price increase over the past year with accelerating bullish momentum. The stock reached a high of 152.1 and a low of 94.57, indicating robust upward movement amid moderate volatility.
AMETEK, Inc. recorded a 26.11% price rise over the same period, also accelerating bullishly. Its price fluctuated between 152.66 and 228.92, with slightly higher volatility than Emerson’s stock.
Emerson Electric outperformed AMETEK in total market gains with a stronger price increase, despite AMETEK’s higher recent buyer dominance and volume growth.
Target Prices
Analysts present a confident target consensus for Emerson Electric Co. and AMETEK, Inc.
| Company | Target Low | Target High | Consensus |
|---|---|---|---|
| Emerson Electric Co. | 125 | 170 | 149.67 |
| AMETEK, Inc. | 204 | 271 | 231.64 |
The target consensus for Emerson Electric slightly undervalues the current price of 152.1, suggesting moderate upside potential. AMETEK’s consensus aligns closely with its price of 228.92, indicating a balanced risk-reward profile.

Don’t Let Luck Decide Your Entry Point
Optimize your entry points with our advanced ProRealTime indicators. You’ll get efficient buy signals with precise price targets for maximum performance. Start outperforming now!
How do institutions grade them?
Emerson Electric Co. Grades
The following table summarizes recent grades from major financial institutions for Emerson Electric Co.:
| Grading Company | Action | New Grade | Date |
|---|---|---|---|
| Oppenheimer | Downgrade | Perform | 2026-01-27 |
| JP Morgan | Maintain | Neutral | 2026-01-16 |
| Barclays | Maintain | Equal Weight | 2026-01-07 |
| Wells Fargo | Maintain | Equal Weight | 2026-01-07 |
| UBS | Upgrade | Buy | 2026-01-05 |
| Jefferies | Downgrade | Hold | 2025-12-10 |
| JP Morgan | Maintain | Neutral | 2025-11-10 |
| RBC Capital | Maintain | Outperform | 2025-11-06 |
| Barclays | Maintain | Equal Weight | 2025-11-06 |
| RBC Capital | Maintain | Outperform | 2025-10-16 |
AMETEK, Inc. Grades
The following table presents recent grades issued by reputable firms for AMETEK, Inc.:
| Grading Company | Action | New Grade | Date |
|---|---|---|---|
| Oppenheimer | Downgrade | Perform | 2026-01-27 |
| Morgan Stanley | Maintain | Equal Weight | 2026-01-12 |
| Keybanc | Maintain | Overweight | 2026-01-07 |
| Barclays | Maintain | Equal Weight | 2026-01-07 |
| Keybanc | Maintain | Overweight | 2026-01-06 |
| Mizuho | Maintain | Outperform | 2026-01-05 |
| TD Cowen | Upgrade | Buy | 2025-12-23 |
| DA Davidson | Maintain | Buy | 2025-12-08 |
| Baird | Maintain | Neutral | 2025-11-03 |
| Keybanc | Maintain | Overweight | 2025-10-31 |
Which company has the best grades?
AMETEK, Inc. consistently maintains higher grades like Outperform and Overweight compared to Emerson Electric’s mix of Equal Weight and Neutral. This suggests AMETEK may currently enjoy stronger institutional confidence, potentially impacting investor sentiment positively.
Risks specific to each company
The following categories identify the critical pressure points and systemic threats facing both firms in the 2026 market environment:
1. Market & Competition
Emerson Electric Co. (EMR)
- Faces intense competition in industrial machinery with moderate market share growth challenges.
AMETEK, Inc. (AME)
- Competes in specialized electronic instruments and electromechanical devices with strong niche positioning.
2. Capital Structure & Debt
Emerson Electric Co. (EMR)
- Moderate leverage (D/E 0.68), neutral debt-to-assets; interest coverage favorable at 13.38x.
AMETEK, Inc. (AME)
- Low leverage (D/E 0.24), favorable debt metrics but concerning negative interest coverage.
3. Stock Volatility
Emerson Electric Co. (EMR)
- Beta of 1.25 indicates higher volatility than market average.
AMETEK, Inc. (AME)
- Beta of 1.04 shows near-market volatility, offering more stability.
4. Regulatory & Legal
Emerson Electric Co. (EMR)
- Exposed to regulations across multiple industrial sectors globally, increasing compliance costs.
AMETEK, Inc. (AME)
- Faces regulatory scrutiny in aerospace and electronics, with complex international standards.
5. Supply Chain & Operations
Emerson Electric Co. (EMR)
- Complex global supply chain vulnerable to disruptions in industrial components.
AMETEK, Inc. (AME)
- Operations rely on precision manufacturing, sensitive to raw material and component shortages.
6. ESG & Climate Transition
Emerson Electric Co. (EMR)
- Increasing pressure to reduce carbon footprint in energy-intensive manufacturing.
AMETEK, Inc. (AME)
- Faces ESG challenges in sourcing high-purity metals and managing electronic waste.
7. Geopolitical Exposure
Emerson Electric Co. (EMR)
- Global footprint exposes it to trade tensions and currency risks.
AMETEK, Inc. (AME)
- Exposure concentrated in aerospace and defense sectors with geopolitical sensitivities.
Which company shows a better risk-adjusted profile?
Emerson Electric’s key risk is its weaker liquidity ratios, which could strain short-term resilience. AMETEK’s most significant risk lies in its negative interest coverage, signaling potential difficulty servicing debt. Despite higher volatility and liquidity concerns, Emerson’s strong interest coverage and diversified markets offer better risk-adjusted stability than AMETEK’s concentrated financial strain. The recent negative interest coverage for AMETEK justifies heightened caution.
Final Verdict: Which stock to choose?
Emerson Electric Co. (EMR) excels as a resilient industrial powerhouse with strong cash flow generation and operational efficiency. Its main point of vigilance is a current ratio below 1, signaling potential short-term liquidity risks. EMR suits investors seeking steady income with a tilt toward value and dividend exposure.
AMETEK, Inc. (AME) boasts a clear strategic moat through specialized instrumentation and higher return on assets, supported by a very strong Piotroski score. Its lower debt-to-equity ratio offers better financial safety compared to EMR. AME fits well in a GARP portfolio balancing growth potential with reasonable financial prudence.
If you prioritize stable cash flow and dividend income, EMR is the compelling choice due to its operational cash machine status despite some liquidity concerns. However, if you seek a growth-oriented stock with a durable competitive advantage and stronger balance sheet metrics, AME offers better stability and upside potential. Both stocks carry their own risks, so alignment with your investment strategy is key.
Disclaimer: Investment carries a risk of loss of initial capital. The past performance is not a reliable indicator of future results. Be sure to understand risks before making an investment decision.
Go Further
I encourage you to read the complete analyses of Emerson Electric Co. and AMETEK, Inc. to enhance your investment decisions: