Home > Comparison > Industrials > ETN vs AME
The strategic rivalry between Eaton Corporation plc and AMETEK, Inc. shapes the industrial machinery sector’s future. Eaton operates as a diversified power management giant with broad industrial and aerospace segments. AMETEK focuses on specialized electronic instruments and electromechanical devices with a precision engineering edge. This analysis pits Eaton’s scale against AMETEK’s niche expertise to identify which delivers superior risk-adjusted returns for a balanced industrial portfolio.
Table of contents
Companies Overview
Eaton Corporation plc and AMETEK, Inc. stand as pivotal players in the industrial machinery sector.
Eaton Corporation plc: Global Power Management Leader
Eaton dominates as a power management company with diverse segments spanning electrical components, aerospace, vehicle systems, and eMobility. Its revenue derives from providing critical infrastructure products like power distribution, circuit protection, and hybrid power systems. In 2026, Eaton emphasizes innovation in eMobility and aerospace solutions, targeting sustainable growth and energy-efficient technologies worldwide.
AMETEK, Inc.: Precision Instruments and Electromechanical Specialist
AMETEK excels in electronic instruments and electromechanical devices across aerospace, industrial, and process markets. Its core revenue streams come from advanced instrumentation, precision motion control, and engineered electrical connectors. The 2026 strategic focus centers on expanding its aerospace and industrial product lines, leveraging technological advances to enhance precision and reliability in mission-critical applications.
Strategic Collision: Similarities & Divergences
Both companies operate within industrial machinery but differ sharply in scope: Eaton pursues a broad power management ecosystem, while AMETEK specializes in precision instruments and electromechanical solutions. Their primary battleground lies in aerospace and industrial sectors where power and instrumentation intersect. Eaton’s diverse product portfolio contrasts with AMETEK’s niche precision focus, defining distinct risk and growth profiles for investors.
Income Statement Comparison
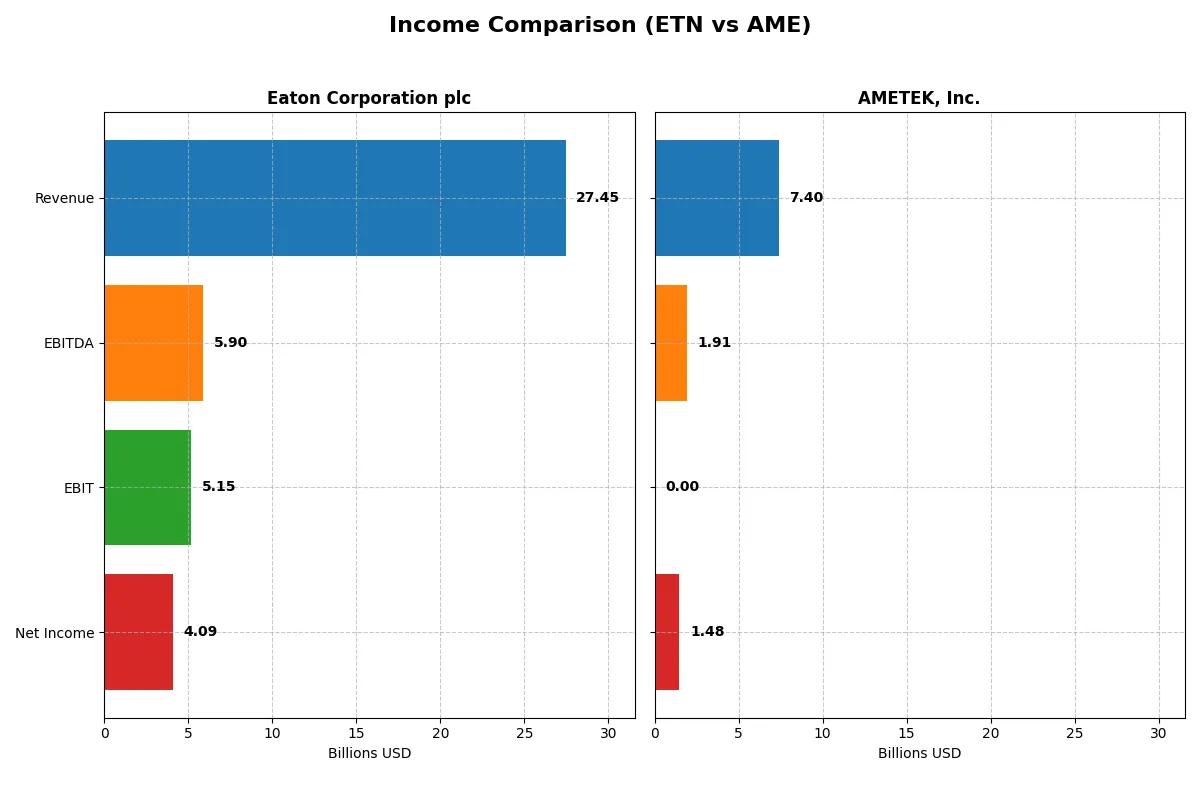
This data dissects the core profitability and scalability of both corporate engines to reveal who dominates the bottom line:
| Metric | Eaton Corporation plc (ETN) | AMETEK, Inc. (AME) |
|---|---|---|
| Revenue | 27.4B | 7.4B |
| Cost of Revenue | 17.1B | 0 |
| Operating Expenses | 5.1B | 5.5B |
| Gross Profit | 10.3B | 0 |
| EBITDA | 5.9B | 1.9B |
| EBIT | 5.1B | 0 |
| Interest Expense | 264M | -81M |
| Net Income | 4.1B | 1.5B |
| EPS | 10.49 | 6.42 |
| Fiscal Year | 2025 | 2025 |
Income Statement Analysis: The Bottom-Line Duel
This income statement comparison exposes which company converts revenue into profit most efficiently through recent market cycles.
Eaton Corporation plc Analysis
Eaton’s revenue climbed steadily from $19.6B in 2021 to $27.4B in 2025, with net income surging 90.7% over five years to $4.1B. Gross margin holds firm around 37.6%, reflecting strong production efficiency. Despite a slight net margin dip last year, Eaton sustains solid momentum with a 10.3% revenue growth and 10.1% EPS increase in 2025.
AMETEK, Inc. Analysis
AMETEK grew revenue by 33.4% from $5.5B in 2021 to $7.4B in 2025, with net income rising 49.5% to $1.48B. However, its latest gross margin data is missing, complicating margin assessment. Net margin improved to 20%, but EBIT and gross profit showed a sharp decline in 2025, signaling potential operational challenges despite moderate revenue growth.
Margin Power vs. Revenue Scale
Eaton outperforms AMETEK in margin stability and net income growth, delivering nearly twice the net income on a larger revenue base. Eaton’s consistent margin expansion and strong operating income underpin its fundamental strength. Investors seeking a robust profit engine may favor Eaton’s proven efficiency over AMETEK’s uneven margin profile.
Financial Ratios Comparison
These vital ratios act as a diagnostic tool to expose the underlying fiscal health, valuation premiums, and capital efficiency of the companies compared below:
| Ratios | Eaton Corporation plc (ETN) | AMETEK, Inc. (AME) |
|---|---|---|
| ROE | 21.1% | 14.3% |
| ROIC | 13.1% | 11.1% |
| P/E | 30.2 | 30.3 |
| P/B | 6.37 | 4.32 |
| Current Ratio | 1.32 | 1.24 |
| Quick Ratio | 0.81 | 0.75 |
| D/E (Debt to Equity) | 0.54 | 0.24 |
| Debt-to-Assets | 25.5% | 15.9% |
| Interest Coverage | 19.8 | 15.8 |
| Asset Turnover | 0.67 | 0.47 |
| Fixed Asset Turnover | 5.40 | 6.58 |
| Payout ratio | 39.5% | 18.8% |
| Dividend yield | 1.31% | 0.62% |
| Fiscal Year | 2025 | 2024 |
Efficiency & Valuation Duel: The Vital Signs
Ratios serve as a company’s financial DNA, unveiling hidden risks and operational strengths that shape investor decisions.
Eaton Corporation plc
Eaton posts a robust 21.1% ROE and a favorable 14.9% net margin, signaling strong profitability. However, a P/E of 30.2 and P/B of 6.4 suggest the stock trades at a premium. Eaton balances this with a 1.31% dividend yield, reflecting steady shareholder returns alongside ongoing R&D investments supporting growth.
AMETEK, Inc.
AMETEK exhibits a solid 19.8% net margin but a moderate 14.3% ROE, reflecting efficient operations with room to improve profitability. Its P/E ratio of 30.3 also indicates a stretched valuation. The company’s low 0.62% dividend yield and focus on R&D hint at prioritizing reinvestment over immediate shareholder payouts.
Premium Valuation vs. Operational Safety
Eaton combines superior profitability and disciplined capital allocation, despite a high valuation. AMETEK’s margins impress, but weaker ROE and dividend yield raise caution. Eaton suits investors seeking balanced risk and reward, while AMETEK appeals to those favoring growth through reinvestment.
Which one offers the Superior Shareholder Reward?
Eaton (ETN) offers a 1.31% dividend yield with a sustainable 39% payout ratio and moderate buybacks, balancing income and growth. AMETEK (AME) yields 0.62% with a low 19% payout, favoring aggressive buybacks and reinvestment. I see Eaton’s model as more durable for long-term total return in 2026.
Comparative Score Analysis: The Strategic Profile
The radar chart reveals the fundamental DNA and trade-offs of Eaton Corporation plc and AMETEK, Inc., highlighting their financial strengths and valuation contrasts:
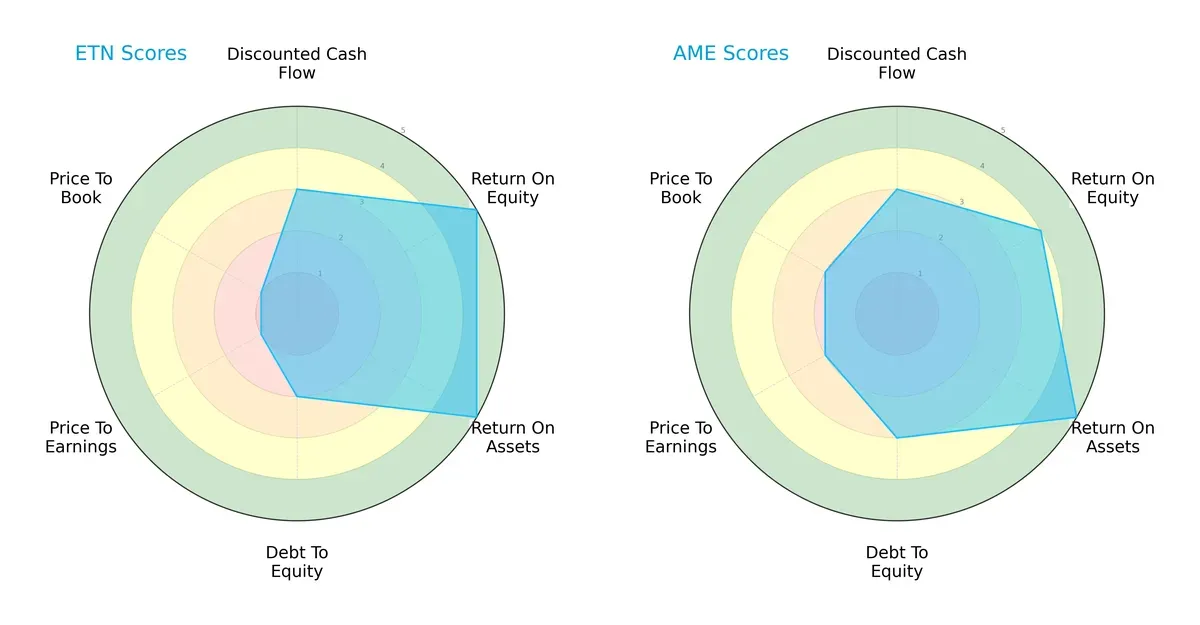
Eaton posts very strong ROE and ROA scores of 5 each, signaling operational efficiency. However, its valuation scores (P/E and P/B at 1) show significant market skepticism. AMETEK presents a more balanced profile with moderately strong ROE (4) and identical ROA (5), coupled with better debt management and valuation scores (2 each). Eaton relies heavily on profitability metrics, while AMETEK offers steadier valuation and leverage metrics.
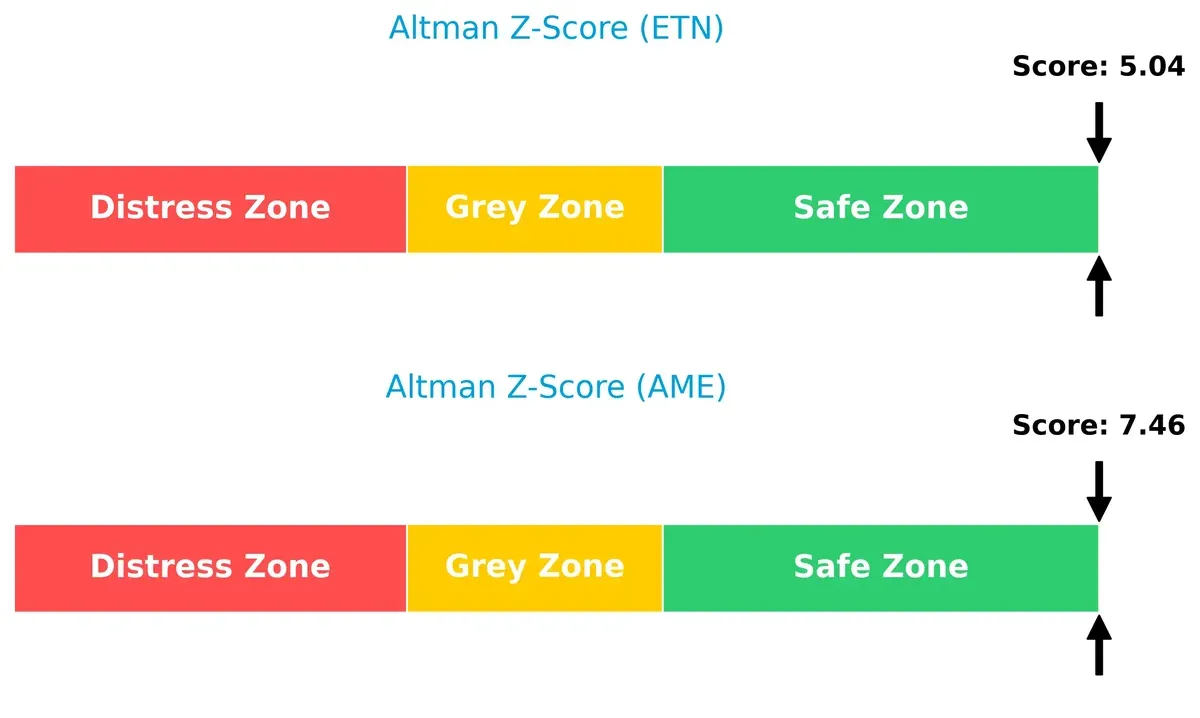
Bankruptcy Risk: Solvency Showdown
AMETEK’s Altman Z-Score of 7.46 comfortably exceeds Eaton’s 5.04, confirming a safer financial footing for long-term survival in this cycle:
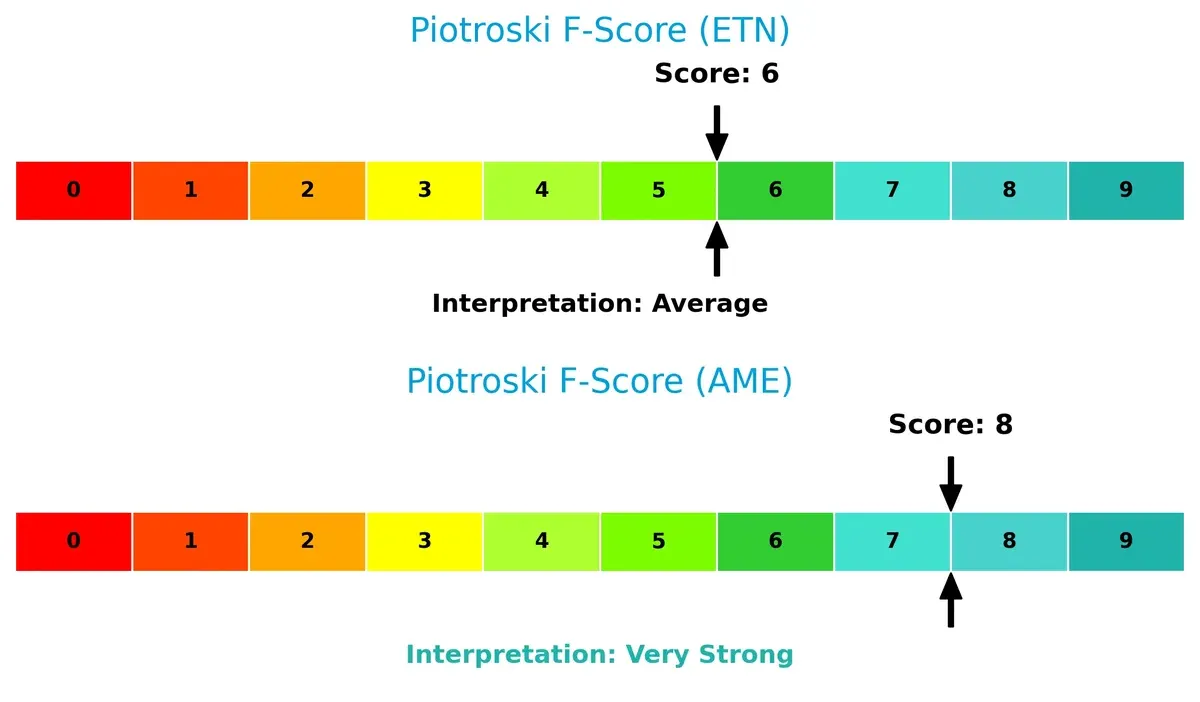
Financial Health: Quality of Operations
AMETEK achieves a Piotroski F-Score of 8, reflecting robust financial health and operational quality. Eaton’s score of 6 is average, signaling room for improvement in internal metrics:
How are the two companies positioned?
This section dissects ETN and AME’s operational DNA by comparing revenue distribution and internal strengths and weaknesses. The goal is to confront their economic moats and identify which model offers a more resilient, sustainable advantage today.
Revenue Segmentation: The Strategic Mix
This comparison dissects how Eaton Corporation plc and AMETEK, Inc. diversify their income streams and reveals their primary sector bets:
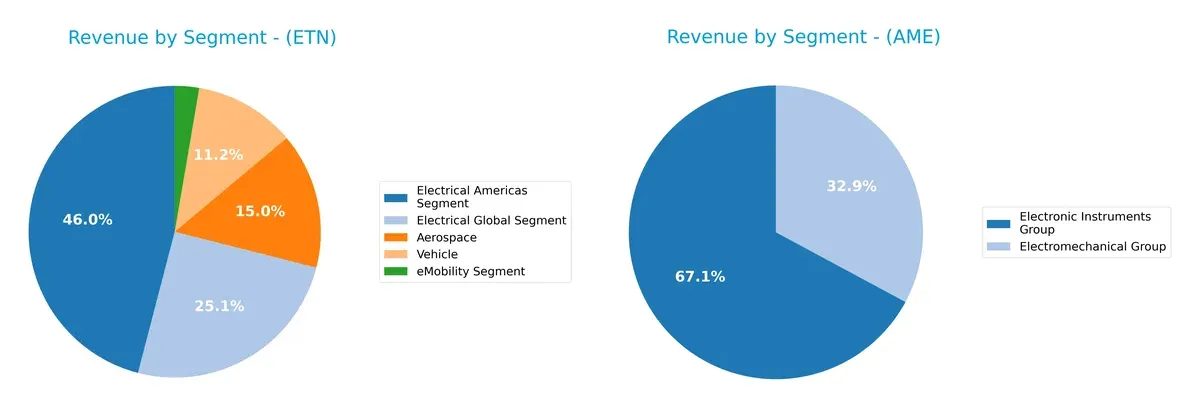
Eaton anchors its revenue in Electrical Americas at $11.4B and Electrical Global at $6.2B, with Aerospace also significant at $3.7B. This mix shows a diversified industrial infrastructure footprint. AMETEK pivots around two main segments: Electronic Instruments at $4.7B and Electromechanical Group at $2.3B, reflecting a focused but balanced portfolio. Eaton’s broader diversification reduces concentration risk, while AMETEK’s dual-segment focus may leverage specialized market dominance.
Strengths and Weaknesses Comparison
This table compares the Strengths and Weaknesses of Eaton Corporation plc and AMETEK, Inc.:
ETN Strengths
- Broad product diversification across Aerospace, Electrical, Vehicle, eMobility
- Strong profitability with 14.9% net margin and 21.05% ROE
- Favorable debt metrics with 25.53% debt-to-assets and high interest coverage
- Significant global presence with $15.15B US revenue and large Europe and Asia Pacific sales
- Solid asset utilization shown by 5.4 fixed asset turnover
AME Strengths
- Higher net margin at 19.83% indicating strong profitability
- Lower leverage with 0.24 debt-to-equity ratio and 15.89% debt-to-assets
- Favorable fixed asset turnover at 6.58 shows efficient asset use
- Diversified revenue streams from Electromechanical and Electronic Instruments groups
- Notable US market exposure with $3.65B revenue and expanding foreign sales
ETN Weaknesses
- Elevated valuation multiples with P/E 30.24 and P/B 6.37 flagged unfavorable
- Moderate liquidity with current ratio 1.32 and quick ratio 0.81 neutral
- Asset turnover at 0.67 considered neutral compared to peers
- Limited innovation or market share data available
AME Weaknesses
- Unfavorable interest coverage at -0.0 signals potential earnings risk
- Higher unfavorable ratios including quick ratio 0.75 and asset turnover 0.47
- Valuation multiples also high with P/E 30.29 and P/B 4.32 unfavorable
- Dividend yield low at 0.62% indicating less income return for investors
Eaton demonstrates strength in scale, global diversification, and balanced leverage. AMETEK excels in profitability and asset efficiency but faces liquidity and coverage concerns. Both companies show high valuation multiples, which investors should monitor closely relative to sector benchmarks.
The Moat Duel: Analyzing Competitive Defensibility
A structural moat is the only true shield protecting long-term profits from relentless competition erosion. Let’s explore how Eaton and AMETEK defend their turf:
Eaton Corporation plc: Power Management with Durable Cost Advantage
Eaton leverages a cost advantage moat, evidenced by a robust ROIC exceeding WACC by 4.18%, driving margin stability near 15%. Its expanding eMobility and aerospace segments promise to deepen this moat in 2026.
AMETEK, Inc.: Precision Instruments with Intangible Asset Strength
AMETEK’s moat stems from specialized electronic instruments and electromechanical expertise, supporting steady net margins around 20%. Although ROIC data is limited, its growing global footprint signals potential for wider market disruption.
Cost Efficiency vs. Specialized Expertise: Who Holds the Deeper Moat?
Eaton’s clear value creation through sustained ROIC growth gives it a wider, more durable moat than AMETEK’s intangible asset base. Eaton stands better equipped to protect and expand its market share going forward.
Which stock offers better returns?
Over the past 12 months, both Eaton Corporation plc and AMETEK, Inc. showed strong price appreciation with accelerating bullish momentum and notable price peaks.
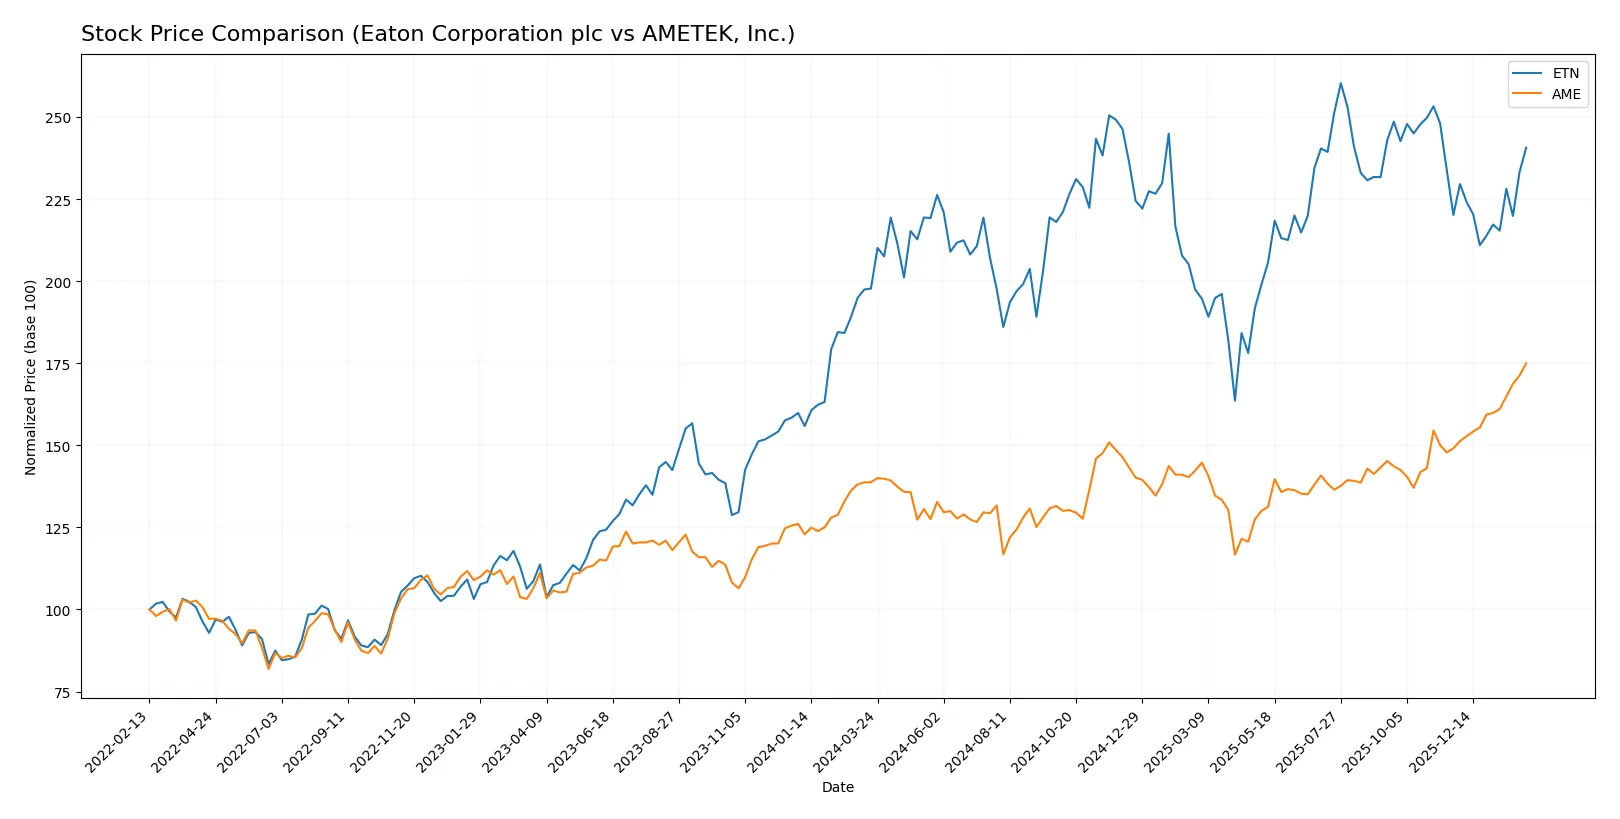
Trend Comparison
Eaton Corporation plc’s stock gained 21.7% over the past year, exhibiting an accelerating bullish trend from a low of 246.52 to a high of 392.17. Its volatility is elevated with a 29.38 standard deviation.
AMETEK, Inc. outperformed with a 26.11% increase over the same period, also on an accelerating bullish trajectory. It recorded a high of 228.92 and a lower volatility of 14.45 standard deviation.
Comparing both, AMETEK delivered higher returns with a stronger upward slope and less volatility, indicating superior market performance over Eaton in the last year.
Target Prices
Analysts present a balanced target consensus for Eaton Corporation plc and AMETEK, Inc., reflecting moderate upside potential.
| Company | Target Low | Target High | Consensus |
|---|---|---|---|
| Eaton Corporation plc | 295 | 495 | 393.08 |
| AMETEK, Inc. | 204 | 271 | 231.64 |
Eaton’s consensus target of 393.08 exceeds its current 362.53 price, indicating expected growth. AMETEK’s 231.64 target aligns closely with its 228.92 stock price, suggesting stable valuation.

Don’t Let Luck Decide Your Entry Point
Optimize your entry points with our advanced ProRealTime indicators. You’ll get efficient buy signals with precise price targets for maximum performance. Start outperforming now!
How do institutions grade them?
Eaton Corporation plc Grades
The following table summarizes recent grades assigned to Eaton Corporation plc by major financial institutions.
| Grading Company | Action | New Grade | Date |
|---|---|---|---|
| HSBC | Upgrade | Buy | 2026-01-16 |
| JP Morgan | Maintain | Overweight | 2026-01-16 |
| Morgan Stanley | Maintain | Overweight | 2026-01-12 |
| Citigroup | Maintain | Buy | 2026-01-12 |
| Barclays | Maintain | Equal Weight | 2026-01-07 |
| UBS | Downgrade | Neutral | 2026-01-05 |
| Wells Fargo | Maintain | Equal Weight | 2025-12-18 |
| Wolfe Research | Upgrade | Outperform | 2025-12-09 |
| JP Morgan | Maintain | Overweight | 2025-11-06 |
| RBC Capital | Maintain | Outperform | 2025-11-05 |
AMETEK, Inc. Grades
Below is a summary of recent grades issued to AMETEK, Inc. by reputable grading firms.
| Grading Company | Action | New Grade | Date |
|---|---|---|---|
| Oppenheimer | Downgrade | Perform | 2026-01-27 |
| Morgan Stanley | Maintain | Equal Weight | 2026-01-12 |
| Keybanc | Maintain | Overweight | 2026-01-07 |
| Barclays | Maintain | Equal Weight | 2026-01-07 |
| Keybanc | Maintain | Overweight | 2026-01-06 |
| Mizuho | Maintain | Outperform | 2026-01-05 |
| TD Cowen | Upgrade | Buy | 2025-12-23 |
| DA Davidson | Maintain | Buy | 2025-12-08 |
| Baird | Maintain | Neutral | 2025-11-03 |
| Keybanc | Maintain | Overweight | 2025-10-31 |
Which company has the best grades?
Eaton Corporation plc has received a greater number of positive ratings, including multiple “Buy,” “Overweight,” and “Outperform” grades. AMETEK, Inc. shows more mixed signals with recent downgrades and fewer top-tier ratings. Investors may interpret Eaton’s stronger consensus as higher confidence from analysts.
Risks specific to each company
The following categories identify the critical pressure points and systemic threats facing both firms in the 2026 market environment:
1. Market & Competition
Eaton Corporation plc (ETN)
- Faces intense competition in power management and industrial machinery sectors, requiring constant innovation.
AMETEK, Inc. (AME)
- Competes in electronic instruments and electromechanical devices, challenged by rapid technological advances and niche markets.
2. Capital Structure & Debt
Eaton Corporation plc (ETN)
- Maintains moderate leverage (D/E 0.54) with strong interest coverage (19.5x), signaling financial stability.
AMETEK, Inc. (AME)
- Displays low leverage (D/E 0.24) but suffers from unfavorable interest coverage, raising concerns over debt servicing ability.
3. Stock Volatility
Eaton Corporation plc (ETN)
- Beta at 1.18 indicates slightly higher volatility than the market, reflecting sensitivity to industrial cycles.
AMETEK, Inc. (AME)
- Beta of 1.04 suggests near-market volatility, slightly less sensitive to sector fluctuations.
4. Regulatory & Legal
Eaton Corporation plc (ETN)
- Subject to global power and vehicle industry regulations, with exposure to evolving safety and environmental standards.
AMETEK, Inc. (AME)
- Faces regulatory scrutiny in aerospace and medical instrument segments, with compliance costs impacting margins.
5. Supply Chain & Operations
Eaton Corporation plc (ETN)
- Large global footprint exposes it to supply chain disruptions, but diversified segments mitigate risk.
AMETEK, Inc. (AME)
- Smaller workforce and specialized components create vulnerability to supplier dependency and operational bottlenecks.
6. ESG & Climate Transition
Eaton Corporation plc (ETN)
- Invests in eMobility and power efficiency, aligned with climate transition but faces pressure to meet ESG targets.
AMETEK, Inc. (AME)
- Has opportunities in environmental sensors and thermal management but must accelerate ESG initiatives to stay competitive.
7. Geopolitical Exposure
Eaton Corporation plc (ETN)
- Irish domicile with global operations subjects it to currency risks and geopolitical tensions affecting supply chains.
AMETEK, Inc. (AME)
- US-based, with exposure to trade policies and international relations affecting aerospace and industrial markets.
Which company shows a better risk-adjusted profile?
Eaton’s most critical risk lies in market competition and pricing pressure amid high valuation multiples. AMETEK’s primary concern is weak interest coverage and operational vulnerabilities. Eaton’s strong leverage management and robust interest coverage give it a safer risk-adjusted profile. AMETEK’s very strong Piotroski score signals financial strength but is offset by debt servicing challenges. The data reveal Eaton’s balance sheet resilience and operational scale better mitigate 2026’s systemic risks.
Final Verdict: Which stock to choose?
Eaton Corporation plc’s superpower lies in its durable competitive advantage, demonstrated by a growing ROIC well above its cost of capital. Its efficient capital deployment and strong profitability underpin a resilient business model. The point of vigilance remains its premium valuation, which demands caution. Eaton fits well in an Aggressive Growth portfolio aiming for long-term value creation.
AMETEK, Inc. boasts a strategic moat in specialized manufacturing with solid free cash flow and a very strong Piotroski score, signaling financial health. It carries less leverage and offers a more stable risk profile compared to Eaton. AMETEK suits a GARP (Growth at a Reasonable Price) portfolio that balances steady growth with moderate risk.
If you prioritize sustainable economic moats and high return on invested capital, Eaton outshines with its value-creating engine despite valuation headwinds. However, if you seek better financial stability and consistent cash flow with a reasonable price, AMETEK offers superior safety and operational efficiency. Both present compelling analytical scenarios tailored to distinct investor profiles.
Disclaimer: Investment carries a risk of loss of initial capital. The past performance is not a reliable indicator of future results. Be sure to understand risks before making an investment decision.
Go Further
I encourage you to read the complete analyses of Eaton Corporation plc and AMETEK, Inc. to enhance your investment decisions: