Home > Comparison > Industrials > AME vs DOV
The strategic rivalry between AMETEK, Inc. and Dover Corporation shapes the industrial machinery sector’s evolution. AMETEK operates as a diversified manufacturer of electronic instruments and electromechanical devices, focusing on precision and aerospace markets. Dover, by contrast, delivers broad industrial equipment and digital solutions with a strong emphasis on clean energy and automation. This analysis aims to identify which operational model offers superior risk-adjusted returns for a diversified portfolio amid shifting industrial dynamics.
Table of contents
Companies Overview
AMETEK and Dover Corporation both command significant influence in the industrial machinery sector, shaping global manufacturing landscapes.
AMETEK, Inc.: Precision Instruments Powerhouse
AMETEK leads with advanced electronic instruments and electromechanical devices globally. Its revenue stems from two segments: Electronic Instruments and Electromechanical, serving aerospace, industrial, and medical markets. In 2026, AMETEK focuses on expanding its process and analytical instruments, enhancing aerospace sensors, and growing its precision motion control products.
Dover Corporation: Diverse Industrial Solutions Leader
Dover Corporation specializes in equipment, components, and software solutions across multiple industries including clean energy, aerospace, and industrial automation. Its revenue engine is diversified through segments like Engineered Products and Climate & Sustainability Technologies. Dover’s 2026 strategy emphasizes innovation in clean fuel transport and refrigeration technologies while expanding aftermarket and digital solutions.
Strategic Collision: Similarities & Divergences
Both firms compete in industrial machinery but diverge in business philosophy: AMETEK emphasizes precision instruments and sensor technologies, while Dover leans on broad equipment offerings and software integration. Their primary battleground is industrial automation and energy solutions. AMETEK projects a focused tech-driven profile; Dover offers a wider, diversified industrial exposure.
Income Statement Comparison
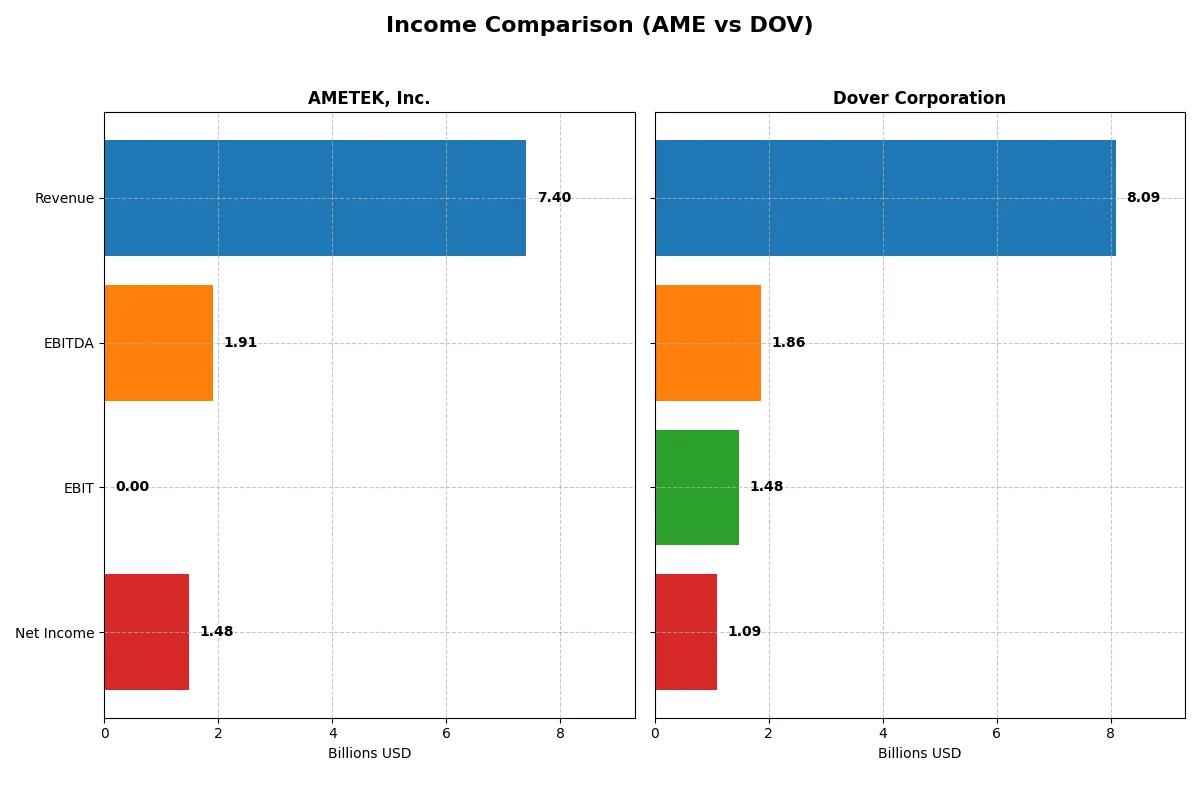
This data dissects the core profitability and scalability of both corporate engines to reveal who dominates the bottom line:
| Metric | AMETEK, Inc. (AME) | Dover Corporation (DOV) |
|---|---|---|
| Revenue | 7.4B | 8.1B |
| Cost of Revenue | 0 | 4.9B |
| Operating Expenses | 5.5B | 1.8B |
| Gross Profit | 0 | 3.2B |
| EBITDA | 1.9B | 1.9B |
| EBIT | 0 | 1.5B |
| Interest Expense | -81M | 110M |
| Net Income | 1.5B | 1.1B |
| EPS | 6.42 | 7.97 |
| Fiscal Year | 2025 | 2025 |
Income Statement Analysis: The Bottom-Line Duel
This income statement comparison reveals which company runs a more efficient and profitable corporate engine over recent years.
AMETEK, Inc. Analysis
AMETEK’s revenue grew steadily from 5.5B in 2021 to 7.4B in 2025, with net income rising from 990M to 1.48B. Despite missing gross profit data in 2025, its net margin holds firm at 20%, reflecting strong cost control. EPS improved 7.9% in the latest year, signaling solid earnings momentum and operational resilience.
Dover Corporation Analysis
Dover’s revenue increased modestly to 8.1B in 2025 from 7.9B in 2021, but net income declined from 1.12B to 1.09B. Gross margin remains healthy near 40%, yet a sharp net margin drop to 13.5% in 2025 highlights margin pressure. EPS fell nearly 60% year-over-year, indicating challenges in maintaining profitability despite scale.
Margin Power vs. Revenue Scale
AMETEK shows clear superiority in profit growth and margin expansion, with a 49.5% net income increase over five years. Dover’s scale is larger, but profit erosion and margin contraction undermine efficiency. For investors, AMETEK’s improving margins and earnings momentum offer a more attractive profile than Dover’s stagnant income and margin headwinds.
Financial Ratios Comparison
These vital ratios act as a diagnostic tool to expose the underlying fiscal health, valuation premiums, and capital efficiency of the companies compared below:
| Ratios | AMETEK, Inc. (AME) | Dover Corporation (DOV) |
|---|---|---|
| ROE | 14.3% (2024) | 38.8% (2024) |
| ROIC | 11.1% (2024) | 8.9% (2024) |
| P/E | 30.3 (2024) | 9.6 (2024) |
| P/B | 4.32 (2024) | 3.72 (2024) |
| Current Ratio | 1.24 (2024) | 2.04 (2024) |
| Quick Ratio | 0.75 (2024) | 1.52 (2024) |
| D/E | 0.24 (2024) | 0.45 (2024) |
| Debt-to-Assets | 15.9% (2024) | 25.2% (2024) |
| Interest Coverage | 15.8x (2024) | 9.2x (2024) |
| Asset Turnover | 0.47 (2024) | 0.62 (2024) |
| Fixed Asset Turnover | 6.58 (2024) | 7.84 (2024) |
| Payout Ratio | 18.8% (2024) | 10.5% (2024) |
| Dividend Yield | 0.62% (2024) | 1.10% (2024) |
| Fiscal Year | 2024 | 2024 |
Efficiency & Valuation Duel: The Vital Signs
Ratios serve as a company’s DNA, unveiling hidden risks and operational strengths that raw figures alone cannot expose.
AMETEK, Inc.
AMETEK shows solid profitability with a 14.25% ROE and a strong 19.83% net margin, signaling efficient core operations. However, its valuation appears stretched, trading at a high P/E of 30.29 and a P/B of 4.32. Shareholder returns are modest, with a 0.62% dividend yield, reflecting a cautious payout and potential reinvestment strategy.
Dover Corporation
Dover’s net margin of 13.52% is favorable, yet its 0% ROE flags profitability concerns or data gaps. The P/E ratio at 24.49 appears reasonable, neither cheap nor expensive. Dividend yield at 1.06% suggests a balanced shareholder return approach, while some key liquidity ratios remain unavailable or unfavorable, indicating caution on financial stability.
Valuation Stretch vs. Profitability Gaps
AMETEK’s higher profitability contrasts with a stretched valuation, while Dover offers a more moderate valuation but weaker returns. Investors prioritizing operational efficiency may lean toward AMETEK, whereas those seeking steadier income might consider Dover’s dividend profile.
Which one offers the Superior Shareholder Reward?
I compare AMETEK, Inc. (AME) and Dover Corporation (DOV) based on their distribution policies and buyback intensity. AME yields about 0.62% with a conservative 18.8% payout ratio, maintaining strong free cash flow coverage near 93%. DOV offers a higher 1.06% yield but pays out 25.9% of earnings, indicating a more aggressive dividend policy. Both companies invest heavily in buybacks; however, AME’s steady payout combined with robust free cash flow and moderate leverage signals a more sustainable shareholder return model in 2026. DOV’s higher yield is attractive but potentially less durable given its payout ratio and debt levels. I conclude AMETEK delivers a superior total return profile, balancing income and growth prudently.
Comparative Score Analysis: The Strategic Profile
The radar chart reveals the fundamental DNA and trade-offs of AMETEK, Inc. and Dover Corporation, highlighting their financial strengths and valuation nuances:
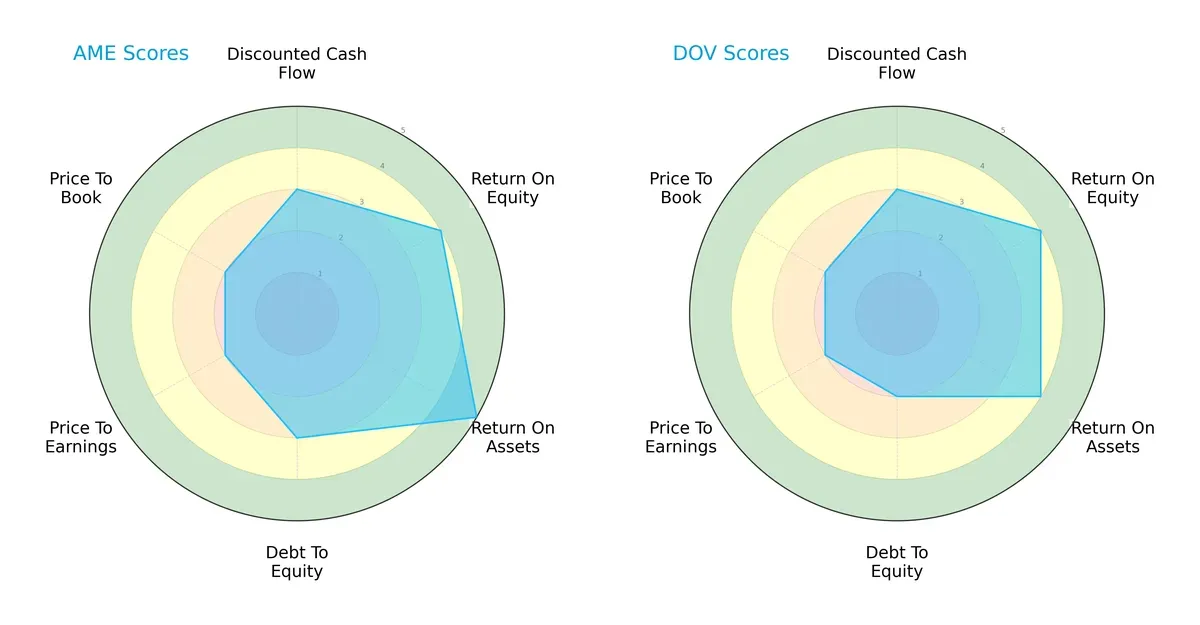
AMETEK exhibits a stronger asset utilization (ROA 5 vs. 4) and a more balanced debt profile (Debt/Equity 3 vs. 2) than Dover. Both share equal efficiency in equity returns (ROE 4) and DCF scores (3). However, AMETEK’s valuation metrics (PE/PB scores at 2) align closely with Dover’s, indicating similar market pricing. AMETEK’s profile is more balanced, while Dover leans slightly on lower leverage as its edge.
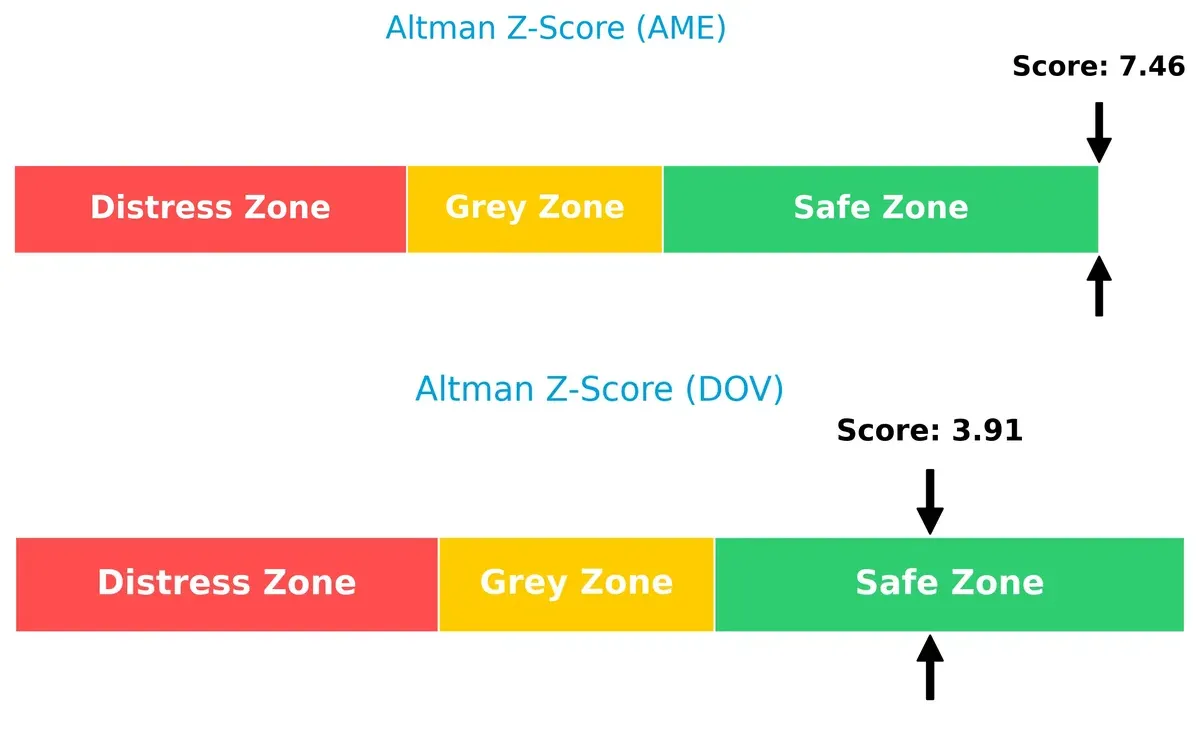
Bankruptcy Risk: Solvency Showdown
AMETEK’s Altman Z-Score of 7.46 significantly outpaces Dover’s 3.91, signaling a stronger cushion against bankruptcy risk in this cycle:
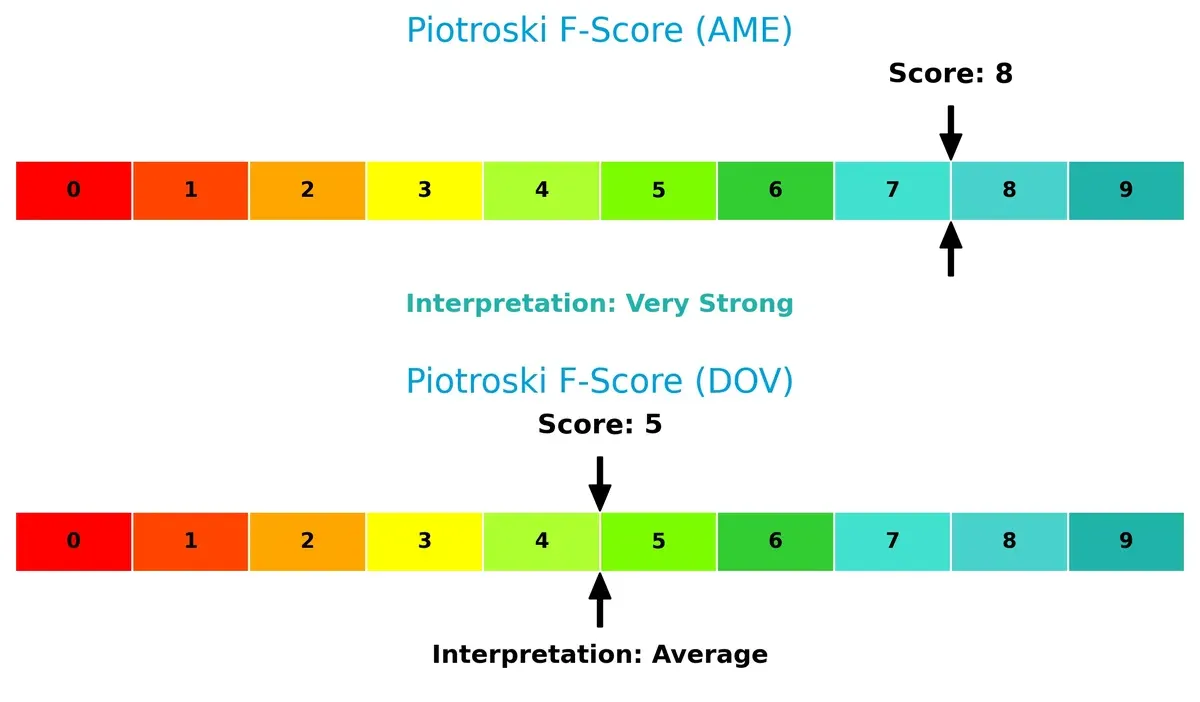
Financial Health: Quality of Operations
AMETEK’s Piotroski F-Score of 8 indicates very strong financial health, contrasting with Dover’s average score of 5, which raises moderate internal metric concerns:
How are the two companies positioned?
This section dissects AMETEK and Dover’s operational DNA by comparing their revenue distribution and internal dynamics. The goal is to confront their economic moats and identify which model offers the most resilient, sustainable advantage today.
Revenue Segmentation: The Strategic Mix
The following visual comparison dissects how both AMETEK, Inc. and Dover Corporation diversify their income streams and where their primary sector bets lie:
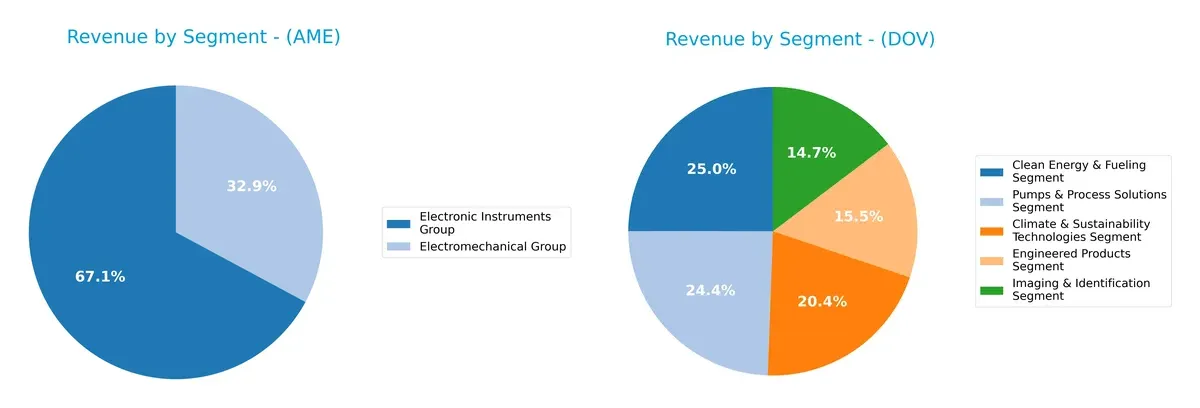
AMETEK leans heavily on two segments: Electronic Instruments at $4.66B and Electromechanical Group at $2.28B in 2024. Dover, conversely, spreads revenue across five segments, each ranging roughly from $1.14B to $1.94B, reflecting broader diversification. AMETEK’s concentration risks hinge on electronic instruments, while Dover’s balanced portfolio mitigates volatility but demands stronger cross-segment execution to sustain growth.
Strengths and Weaknesses Comparison
This table compares the Strengths and Weaknesses of AMETEK, Inc. and Dover Corporation:
AMETEK, Inc. Strengths
- Diverse revenue from Electromechanical and Electronic Instruments groups
- Favorable net margin at 19.83%
- Low debt-to-assets at 15.89%
- Strong fixed asset turnover at 6.58
- Balanced geographic sales with significant US and Asia exposure
Dover Corporation Strengths
- Broad diversification across five distinct segments
- Favorable net margin at 13.52%
- Strong interest coverage ratio at 13.52
- Favorable price-to-book ratio
- Extensive US and European market presence
AMETEK, Inc. Weaknesses
- Unfavorable PE and PB ratios suggest high valuation
- Weak quick ratio at 0.75 signals liquidity concerns
- Negative interest coverage ratio
- Unfavorable asset turnover at 0.47
- Low dividend yield at 0.62%
Dover Corporation Weaknesses
- Unfavorable ROE and ROIC at 0% indicate poor capital efficiency
- Unfavorable current and quick ratios
- Unfavorable asset and fixed asset turnover
- Neutral dividend yield at 1.06%
AMETEK exhibits strong profitability and asset utilization but faces valuation and liquidity challenges. Dover shows solid diversification and interest coverage but struggles with capital efficiency and turnover metrics. Both companies demonstrate slightly unfavorable overall financial ratio profiles, highlighting areas for strategic focus.
The Moat Duel: Analyzing Competitive Defensibility
A structural moat is the only reliable shield protecting long-term profits from relentless competition erosion. Let’s examine the core moats of two industrial machinery giants:
AMETEK, Inc.: Diversified Engineering Excellence
I see AMETEK’s moat rooted in intangible assets and broad product specialization. Its rising ROIC trend signals efficient capital use and margin resilience. Expansion in aerospace and industrial sensors could deepen this moat in 2026.
Dover Corporation: Broad Industrial Footprint
Dover relies on scale and diverse end-markets, contrasting AMETEK’s niche focus. However, its sharply declining ROIC warns of weakening competitive leverage. Future growth hinges on innovation in clean energy and automation sectors.
Intangible Assets vs. Scale: Who Holds the Stronger Moat?
AMETEK’s growing ROIC and specialized product range craft a deeper moat than Dover’s fading capital efficiency. AMETEK appears better positioned to defend and expand market share in a competitive industrial landscape.
Which stock offers better returns?
Over the past 12 months, AMETEK and Dover Corporation have shown strong upward price movements with accelerating bullish trends and increasing trading volumes.
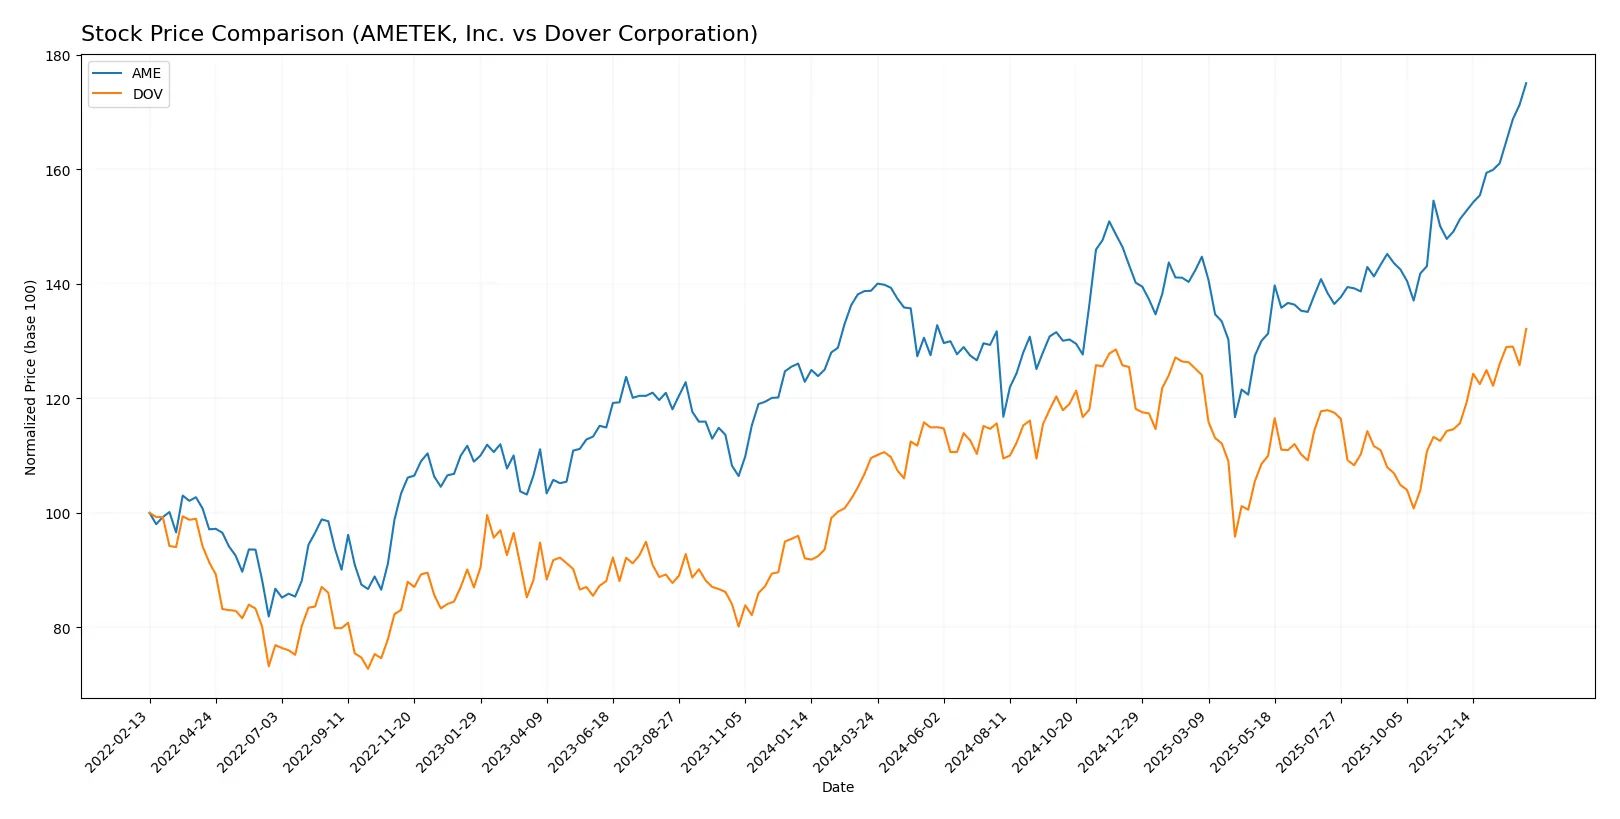
Trend Comparison
AMETEK’s stock rose 26.11% over the past year, showing an accelerating bullish trend with a high volatility level (14.45 std deviation). The price peaked at 228.92 and troughed at 152.66.
Dover’s stock gained 20.58% in the same period, also accelerating bullishly but with slightly lower volatility (11.58 std deviation). Its highest and lowest prices were 211.66 and 153.55 respectively.
AMETEK outperformed Dover by approximately 5.5 percentage points, delivering the stronger market performance over the last 12 months.
Target Prices
Analysts set a confident target consensus for AMETEK, Inc. and Dover Corporation, reflecting steady upside potential.
| Company | Target Low | Target High | Consensus |
|---|---|---|---|
| AMETEK, Inc. | 204 | 271 | 231.64 |
| Dover Corporation | 195 | 256 | 222.2 |
The consensus targets imply 1-7% upside for AMETEK and about 5% upside for Dover versus current prices. Analysts appear cautiously optimistic, pricing in moderate growth.

Don’t Let Luck Decide Your Entry Point
Optimize your entry points with our advanced ProRealTime indicators. You’ll get efficient buy signals with precise price targets for maximum performance. Start outperforming now!
How do institutions grade them?
The following tables summarize recent institutional grades for AMETEK, Inc. and Dover Corporation:
AMETEK, Inc. Grades
The table below shows recent grade actions by reputable firms on AMETEK shares.
| Grading Company | Action | New Grade | Date |
|---|---|---|---|
| Oppenheimer | Downgrade | Perform | 2026-01-27 |
| Morgan Stanley | Maintain | Equal Weight | 2026-01-12 |
| Keybanc | Maintain | Overweight | 2026-01-07 |
| Barclays | Maintain | Equal Weight | 2026-01-07 |
| Keybanc | Maintain | Overweight | 2026-01-06 |
| Mizuho | Maintain | Outperform | 2026-01-05 |
| TD Cowen | Upgrade | Buy | 2025-12-23 |
| DA Davidson | Maintain | Buy | 2025-12-08 |
| Baird | Maintain | Neutral | 2025-11-03 |
| Keybanc | Maintain | Overweight | 2025-10-31 |
Dover Corporation Grades
Below is a summary of recent institutional grades for Dover Corporation.
| Grading Company | Action | New Grade | Date |
|---|---|---|---|
| JP Morgan | Maintain | Overweight | 2026-01-30 |
| RBC Capital | Maintain | Sector Perform | 2026-01-30 |
| Wells Fargo | Maintain | Equal Weight | 2026-01-30 |
| Oppenheimer | Maintain | Outperform | 2026-01-26 |
| JP Morgan | Maintain | Overweight | 2026-01-16 |
| Barclays | Maintain | Equal Weight | 2026-01-07 |
| Wells Fargo | Maintain | Equal Weight | 2026-01-07 |
| UBS | Upgrade | Buy | 2026-01-05 |
| Wells Fargo | Maintain | Equal Weight | 2025-12-15 |
| Oppenheimer | Maintain | Outperform | 2025-11-14 |
Which company has the best grades?
Dover Corporation holds more consistent high grades, including multiple “Outperform” and “Buy” ratings. AMETEK shows mixed signals with recent downgrades, suggesting Dover may command stronger institutional confidence. Investors should weigh these trends carefully.
Risks specific to each company
In 2026, both AMETEK, Inc. and Dover Corporation face critical pressure points and systemic threats across seven key risk categories in the industrial machinery sector:
1. Market & Competition
AMETEK, Inc.
- Faces intense competition in electronic instruments and electromechanical devices with pricing pressure.
Dover Corporation
- Competes across diversified segments, risking margin erosion in industrial automation and clean energy markets.
2. Capital Structure & Debt
AMETEK, Inc.
- Maintains low debt levels (D/E 0.24) but struggles with weak interest coverage, signaling debt servicing risks.
Dover Corporation
- Shows zero reported debt, supported by strong interest coverage, indicating a conservative capital structure.
3. Stock Volatility
AMETEK, Inc.
- Beta near 1.04 implies moderate market sensitivity and relative stability.
Dover Corporation
- Higher beta at 1.29 suggests increased stock volatility and greater market risk.
4. Regulatory & Legal
AMETEK, Inc.
- Exposure to aerospace and medical regulatory changes may increase compliance costs.
Dover Corporation
- Faces evolving regulations in clean energy and environmental segments, potentially impacting operations.
5. Supply Chain & Operations
AMETEK, Inc.
- Complex global supply chains may face disruption risks in metals and electronic components.
Dover Corporation
- Diverse product lines increase operational complexity, risking supply chain inefficiencies.
6. ESG & Climate Transition
AMETEK, Inc.
- Moderate ESG focus with some exposure to environmental health markets but limited climate transition initiatives.
Dover Corporation
- Stronger emphasis on clean energy and sustainability technologies, facing transition risks but also opportunities.
7. Geopolitical Exposure
AMETEK, Inc.
- Global footprint exposes it to trade tensions and geopolitical risks in key industrial markets.
Dover Corporation
- Similar global exposure, with added sensitivity due to energy and defense-related segments.
Which company shows a better risk-adjusted profile?
AMETEK’s most impactful risk is its weak interest coverage, threatening financial flexibility despite low leverage. Dover’s key risk lies in its higher stock volatility and operational complexity amid regulatory shifts. AMETEK demonstrates a stronger balance sheet and financial health, evidenced by a superior Altman Z-Score (7.46 vs. 3.91) and Piotroski Score (8 vs. 5). This data justifies concern over Dover’s operational and market risks, suggesting AMETEK offers a better risk-adjusted profile for cautious investors.
Final Verdict: Which stock to choose?
AMETEK, Inc. excels as a cash-generating powerhouse with a steadily growing ROIC, signaling efficient capital use. Its main point of vigilance is a somewhat stretched valuation and a quick ratio that suggests liquidity caution. This stock suits investors chasing aggressive growth with a tolerance for valuation risk.
Dover Corporation boasts a strategic moat through its diversified industrial portfolio and solid interest coverage, reflecting financial resilience. Relative to AMETEK, it offers a more stable income profile but slower growth momentum. Dover fits well within a GARP (Growth at a Reasonable Price) strategy for investors seeking balance between growth and safety.
If you prioritize aggressive expansion and capital efficiency, AMETEK outshines with its upward ROIC trend and robust cash flow generation. However, if you seek better stability and income consistency, Dover offers a safer harbor with its financial resilience and moderate valuation. Both present slightly unfavorable ratio profiles, underscoring the need for cautious position sizing.
Disclaimer: Investment carries a risk of loss of initial capital. The past performance is not a reliable indicator of future results. Be sure to understand risks before making an investment decision.
Go Further
I encourage you to read the complete analyses of AMETEK, Inc. and Dover Corporation to enhance your investment decisions: