Home > Comparison > Industrials > CMI vs AME
The strategic rivalry between Cummins Inc. and AMETEK, Inc. shapes the Industrials sector’s competitive landscape. Cummins operates as a capital-intensive manufacturer of diesel engines and electrified powertrains across diverse heavy industries. AMETEK focuses on high-tech electronic instruments and electromechanical devices with significant exposure to aerospace and industrial markets. This analysis evaluates which model offers superior risk-adjusted returns, guiding portfolio allocation between industrial machinery manufacturing and precision instrumentation leadership.

Table of contents
Companies Overview
Cummins Inc. and AMETEK, Inc. stand as significant players in the industrial machinery sector, each with unique market footprints.
Cummins Inc.: Powertrain Pioneer
Cummins Inc. dominates as a designer and manufacturer of diesel and natural gas engines worldwide. Its core revenue stems from engines, power systems, and related components serving heavy-duty trucks, construction, and industrial markets. In 2026, Cummins focuses strategically on electrified power systems, including batteries and hydrogen technologies, signaling a pivot toward sustainable energy solutions.
AMETEK, Inc.: Precision Instruments Leader
AMETEK, Inc. excels in manufacturing electronic instruments and electromechanical devices across diverse industries like aerospace and pharmaceuticals. Its revenue hinges on two segments: Electronic Instruments and Electromechanical products, including sensors and precision motion controls. The company’s strategic thrust in 2026 emphasizes innovation in advanced instrumentation and engineered electrical connectors for critical industrial applications.
Strategic Collision: Similarities & Divergences
Both firms operate in industrial machinery but adopt distinct approaches: Cummins builds a broad powertrain ecosystem, while AMETEK offers specialized instrumentation and components. Their primary battleground lies in serving industrial and aerospace markets with high-precision, mission-critical products. Investors encounter contrasting profiles—Cummins bets on powertrain electrification, whereas AMETEK capitalizes on niche, high-tech instrumentation growth.
Income Statement Comparison
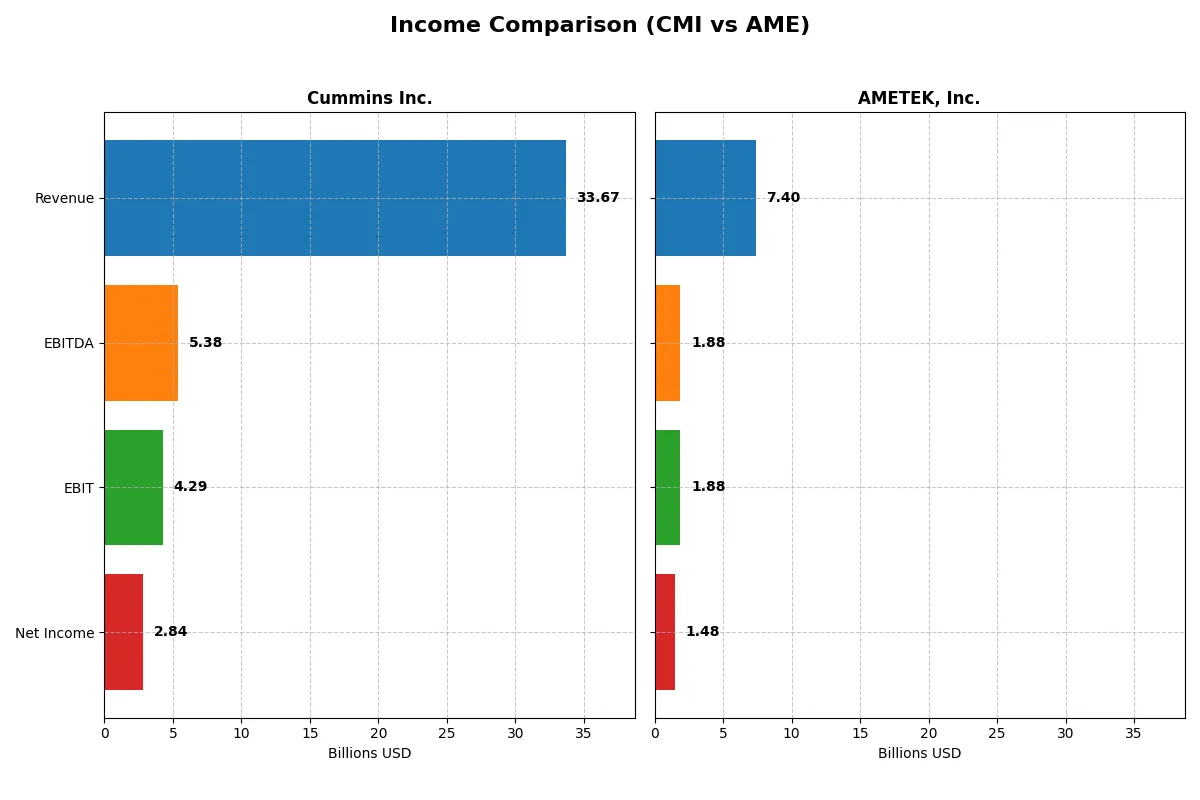
This data dissects the core profitability and scalability of both corporate engines to reveal who dominates the bottom line:
| Metric | Cummins Inc. (CMI) | AMETEK, Inc. (AME) |
|---|---|---|
| Revenue | 33.7B | 7.4B |
| Cost of Revenue | 25.2B | 4.7B |
| Operating Expenses | 4.5B | 757M |
| Gross Profit | 8.5B | 2.7B |
| EBITDA | 5.4B | 1.9B |
| EBIT | 4.3B | 1.9B |
| Interest Expense | 329M | 81M |
| Net Income | 2.8B | 1.5B |
| EPS | 20.62 | 6.42 |
| Fiscal Year | 2025 | 2025 |
Income Statement Analysis: The Bottom-Line Duel
This income statement comparison reveals which company operates its business more efficiently and generates stronger profits from its revenues.
Cummins Inc. Analysis
Cummins’ revenue grew 40% over five years but slipped 1.3% in the latest year to $33.7B. Net income rose 33% overall but dropped 28% in 2025 to $2.84B. Gross margin holds steady at 25.3%, while net margin declined to 8.4%. The recent fall in EBIT and net margin signals weakening profitability momentum.
AMETEK, Inc. Analysis
AMETEK’s revenue climbed 33% over five years, reaching $7.4B in 2025 with a 6.6% annual uptick. Net income surged 50% over the period to $1.48B, reflecting a 0.9% rise last year. Their gross margin excels at 36.4%, and net margin stands at a robust 20%. AMETEK shows consistent profit expansion and margin improvement.
Margin Strength vs. Scale Advantage
AMETEK delivers superior margin strength and steady profit growth, while Cummins boasts larger revenue scale but recent margin erosion. AMETEK’s rising net margin and EPS growth mark it as the more efficient operator. Investors favoring margin resilience and steady earnings growth may find AMETEK’s profile more attractive.
Financial Ratios Comparison
These vital ratios act as a diagnostic tool to expose the underlying fiscal health, valuation premiums, and capital efficiency of the companies compared below:
| Ratios | Cummins Inc. (CMI) | AMETEK, Inc. (AME) |
|---|---|---|
| ROE | 23.0% | 13.9% |
| ROIC | 12.0% | 11.0% |
| P/E | 24.8 | 32.0 |
| P/B | 5.7 | 4.5 |
| Current Ratio | 1.76 | 1.06 |
| Quick Ratio | 1.16 | 0.67 |
| D/E | 0.59 | 0.21 |
| Debt-to-Assets | 21.3% | 14.2% |
| Interest Coverage | 12.1 | 23.8 |
| Asset Turnover | 0.99 | 0.46 |
| Fixed Asset Turnover | 4.84 | 6.56 |
| Payout Ratio | 37.1% | 19.3% |
| Dividend Yield | 1.50% | 0.60% |
| Fiscal Year | 2025 | 2025 |
Efficiency & Valuation Duel: The Vital Signs
Financial ratios serve as a company’s DNA, uncovering hidden risks and revealing operational strengths beyond surface numbers.
Cummins Inc.
Cummins posts a robust 23.02% ROE and a 12.01% ROIC, signaling solid profitability above its 8.56% WACC. Its P/E of 24.76 appears fair, though a high 5.7 PB ratio flags premium asset pricing. The 1.5% dividend yield offers steady shareholder returns, complemented by efficient capital allocation and a strong current ratio at 1.76.
AMETEK, Inc.
AMETEK shows a strong 20% net margin but a more modest 13.93% ROE and 11.04% ROIC. Its valuation looks stretched with a P/E near 32 and a 4.45 PB ratio, reflecting growth expectations priced in. The low 0.6% dividend yield and weaker liquidity (quick ratio 0.67) suggest a more aggressive reinvestment and moderate risk profile.
Balanced Strength vs. Growth Premium
Cummins offers a better risk-reward balance with superior profitability metrics and healthier liquidity, supporting sustainable shareholder value. AMETEK’s premium valuation suits investors chasing growth but entails higher valuation risk. Conservative portfolios lean toward Cummins, while growth-seekers may prefer AMETEK’s profile.
Which one offers the Superior Shareholder Reward?
I see Cummins Inc. (CMI) delivers a higher dividend yield around 1.5%–2.7% with payout ratios near 25–40%, supported by strong free cash flow coverage above 65%. Its steady buybacks enhance total returns. AMETEK, Inc. (AME) pays a lower yield near 0.6%–0.6%, with a conservative payout ratio below 20%, reflecting a growth-focused reinvestment strategy. AME’s buybacks are active, but free cash flow metrics are less clear. I judge CMI’s balanced dividend and buyback model more sustainable and attractive for long-term shareholder reward in 2026.
Comparative Score Analysis: The Strategic Profile
The radar chart reveals the fundamental DNA and trade-offs of Cummins Inc. and AMETEK, Inc., highlighting their financial strengths and valuation nuances:
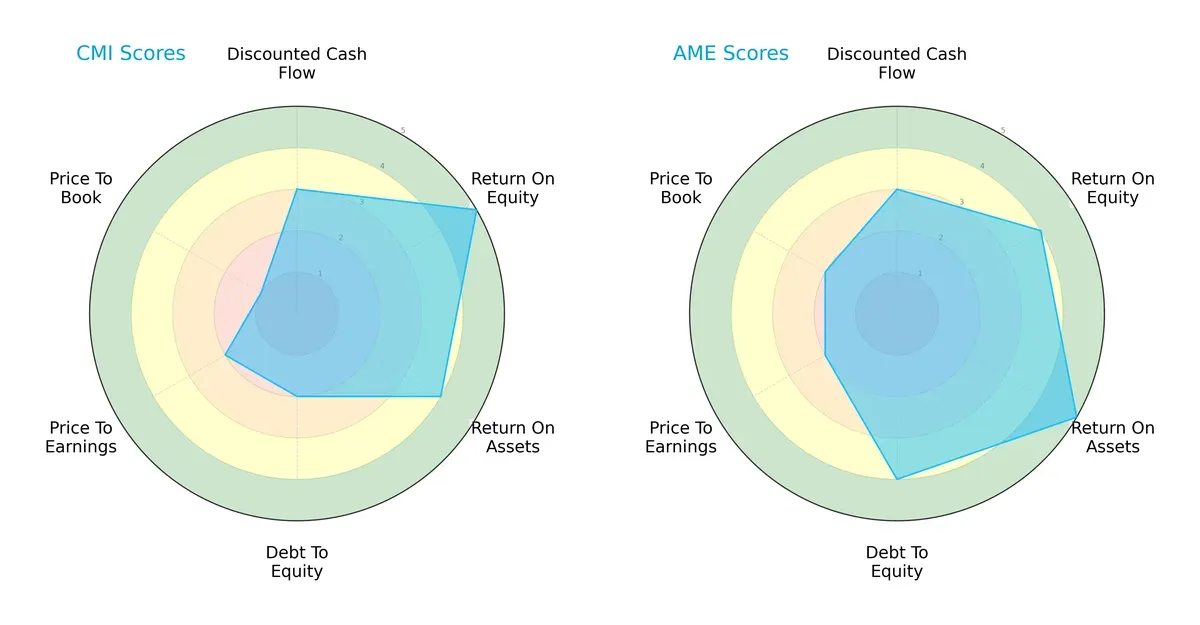
Cummins leans heavily on superior return on equity (5) and solid return on assets (4), yet struggles with debt (2) and valuation scores (P/E 2, P/B 1). AMETEK offers a more balanced profile with strong asset efficiency (5), healthier leverage (4), and modestly better valuation metrics (P/B 2). AMETEK’s diversified strengths suggest resilience, while Cummins relies on operational excellence but carries financial risk.
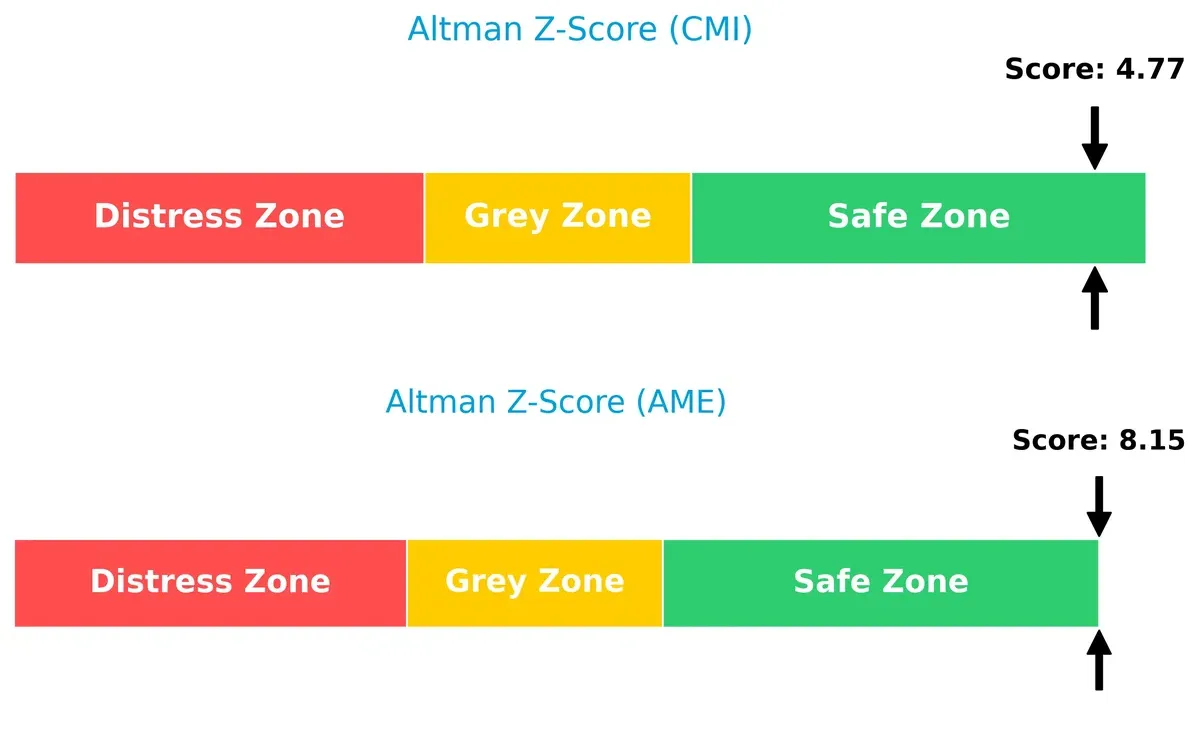
Bankruptcy Risk: Solvency Showdown
The Altman Z-Score gap favors AMETEK significantly, indicating stronger long-term solvency and lower bankruptcy risk in this cycle:
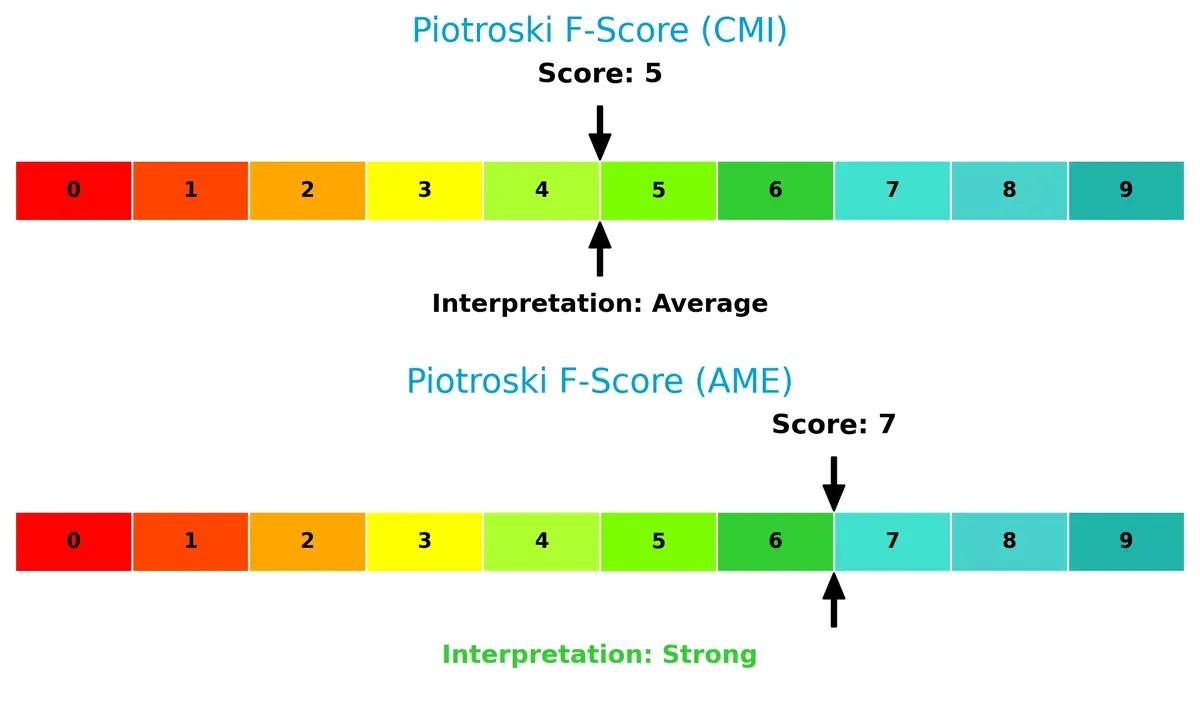
Financial Health: Quality of Operations
AMETEK’s Piotroski F-Score of 7 signals robust financial health, outperforming Cummins’ average score of 5, which suggests some red flags in operational efficiency and balance sheet quality:
How are the two companies positioned?
This section dissects the operational DNA of Cummins and AMETEK by comparing their revenue distribution and internal dynamics. The goal is to confront their economic moats to reveal which model delivers the most resilient competitive advantage today.
Revenue Segmentation: The Strategic Mix
This visual comparison dissects how Cummins Inc. and AMETEK, Inc. diversify their income streams and highlights their primary sector bets:
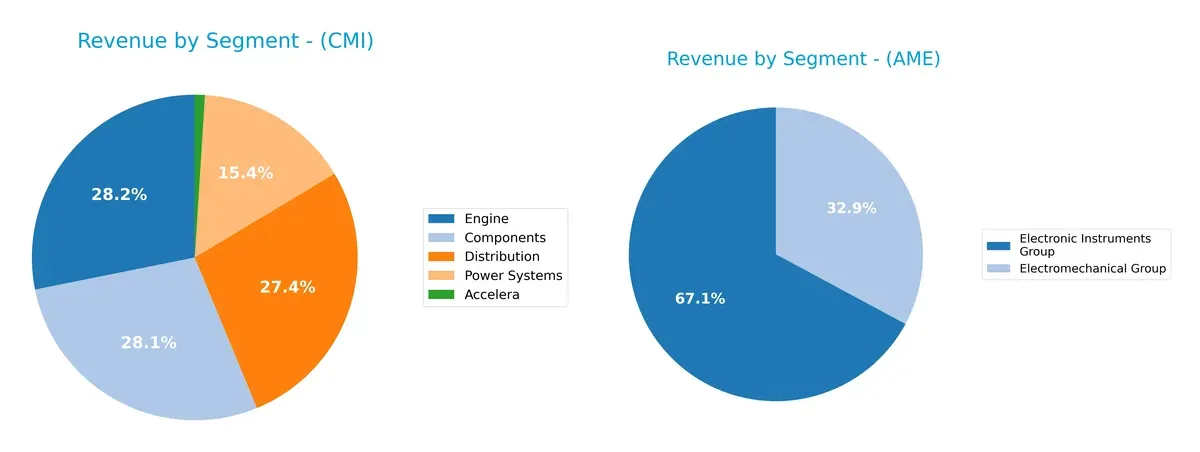
Cummins leans heavily on its Engine ($11.7B) and Components ($11.7B) segments, anchoring over half its revenue there. AMETEK, by contrast, balances between Electromechanical ($2.3B) and Electronic Instruments ($4.7B), reflecting a more diversified portfolio. Cummins’ concentrated engine focus risks cyclical exposure but gains infrastructure dominance. AMETEK’s dual-group split mitigates single-sector risks and supports steady growth through technological breadth.
Strengths and Weaknesses Comparison
This table compares the Strengths and Weaknesses of Cummins Inc. and AMETEK, Inc.:
Cummins Inc. Strengths
- Favorable ROE at 23.02% and ROIC at 12.01%
- Strong current and quick ratios above 1.0
- Balanced geographical presence with $19.4B US and $9.95B non-US revenue
- Diverse segments including Engine, Components, and Power Systems
- Favorable debt-to-assets ratio at 21.3%
- Solid interest coverage at 13.05
AMETEK, Inc. Strengths
- High net margin at 20% and favorable ROIC at 11.04%
- Very strong interest coverage at 23.13
- Favorable low debt-to-assets at 14.21% and debt/equity at 0.21
- Global footprint with $3.65B US and diversified foreign revenue
- Strong fixed asset turnover at 6.56
- Stable Electromechanical and Electronic Instruments segments
Cummins Inc. Weaknesses
- Unfavorable high PB ratio at 5.7
- Neutral net margin at 8.44% lower than AME
- Neutral PE at 24.76
- Neutral asset turnover at 0.99
- Heavy reliance on US market with $19.4B revenue
- Segment eliminations impact reported total revenue
AMETEK, Inc. Weaknesses
- Unfavorable high PE at 31.97 and low dividend yield at 0.6%
- Quick ratio below 1.0 at 0.67 indicates weaker liquidity
- Unfavorable asset turnover at 0.46
- Less segment diversification with two main groups
- Higher proportion of unfavorable financial ratios at 35.71%
- Smaller international revenue compared to domestic
Cummins demonstrates strong profitability metrics and balanced segment diversification, benefiting from a robust US and international presence. AMETEK excels in net margin and interest coverage but shows liquidity and valuation challenges, with less segment variety. Both companies maintain slightly favorable overall financial profiles, influencing strategic focus on capital allocation and market expansion.
The Moat Duel: Analyzing Competitive Defensibility
A structural moat is the only true shield preserving long-term profits from relentless competitive pressure. Let’s dissect the moat dynamics of two industrial giants:
Cummins Inc. (CMI): Intangible Assets and Innovation Backbone
Cummins leverages deep intangible assets and advanced powertrain technology. Its slightly favorable moat shows value creation with a 3.4% ROIC-WACC spread but declining profitability. Expansion into electrified powertrain markets could reinforce this edge, though margin pressures persist in 2026.
AMETEK, Inc. (AME): Precision Engineering and Operational Excellence
AMETEK’s moat rests on a cost advantage and diversified electromechanical portfolio. Its very favorable moat features a 2.6% ROIC-WACC spread with rising profitability trends. Growth in aerospace and industrial instrumentation signals robust expansion and competitive resilience ahead.
Moat Strength Showdown: Innovation Depth vs. Operational Agility
While Cummins boasts a wider moat through patented technologies, AMETEK’s rising ROIC and margin expansion demonstrate a deeper, more sustainable competitive advantage. I see AMETEK better positioned to defend market share amid evolving industrial demands in 2026.
Which stock offers better returns?
Key price movements over the past year show Cummins Inc. surging sharply, while AMETEK, Inc. also posts solid gains with accelerating trends in both stocks.
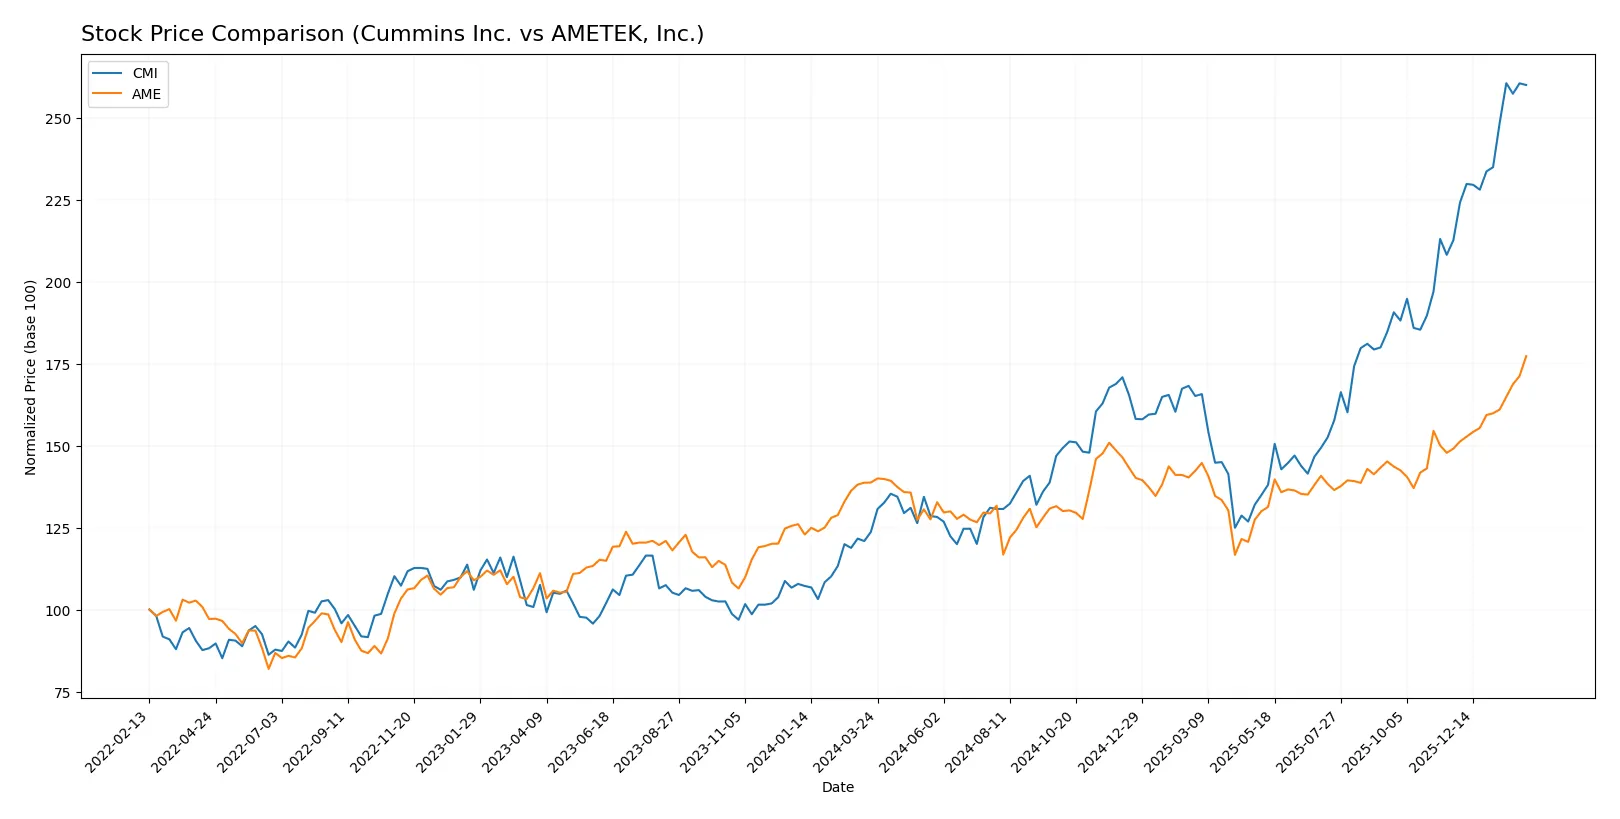
Trend Comparison
Cummins Inc. exhibits a strong bullish trend over 12 months with a 110.21% price increase and accelerating momentum. Volatility is high, with a standard deviation of 79.49.
AMETEK, Inc. also follows a bullish trend, gaining 27.76% in the same period with acceleration. Its volatility is moderate, marked by a 14.56 standard deviation.
Cummins outperforms AMETEK significantly in total returns, with a more pronounced acceleration and greater price appreciation over the past year.
Target Prices
Analysts present a moderately bullish consensus for both Cummins Inc. and AMETEK, Inc., reflecting confidence in their industrial machinery segments.
| Company | Target Low | Target High | Consensus |
|---|---|---|---|
| Cummins Inc. | 540 | 703 | 606.1 |
| AMETEK, Inc. | 215 | 271 | 241.64 |
The consensus target prices suggest upside potential of approximately 5% for Cummins and 4% for AMETEK compared to current prices, indicating modest appreciation expectations.

Don’t Let Luck Decide Your Entry Point
Optimize your entry points with our advanced ProRealTime indicators. You’ll get efficient buy signals with precise price targets for maximum performance. Start outperforming now!
How do institutions grade them?
Cummins Inc. Grades
The following table summarizes recent institutional grades for Cummins Inc.:
| Grading Company | Action | New Grade | Date |
|---|---|---|---|
| Truist Securities | Maintain | Buy | 2026-02-06 |
| Wolfe Research | Downgrade | Peer Perform | 2026-01-26 |
| Barclays | Maintain | Overweight | 2026-01-23 |
| Wells Fargo | Maintain | Overweight | 2026-01-23 |
| JP Morgan | Maintain | Neutral | 2026-01-14 |
| Citigroup | Maintain | Buy | 2026-01-13 |
| Raymond James | Upgrade | Outperform | 2025-12-22 |
| Barclays | Upgrade | Overweight | 2025-12-19 |
| Truist Securities | Maintain | Buy | 2025-12-18 |
| Citigroup | Maintain | Buy | 2025-12-11 |
AMETEK, Inc. Grades
Below is the recent institutional grading overview for AMETEK, Inc.:
| Grading Company | Action | New Grade | Date |
|---|---|---|---|
| DA Davidson | Maintain | Buy | 2026-02-05 |
| Barclays | Maintain | Equal Weight | 2026-02-04 |
| Keybanc | Maintain | Overweight | 2026-02-04 |
| DA Davidson | Maintain | Buy | 2026-02-04 |
| Oppenheimer | Downgrade | Perform | 2026-01-27 |
| Morgan Stanley | Maintain | Equal Weight | 2026-01-12 |
| Keybanc | Maintain | Overweight | 2026-01-07 |
| Barclays | Maintain | Equal Weight | 2026-01-07 |
| Keybanc | Maintain | Overweight | 2026-01-06 |
| Mizuho | Maintain | Outperform | 2026-01-05 |
Which company has the best grades?
Cummins Inc. holds generally stronger grades with multiple “Buy” and “Overweight” ratings versus AMETEK’s more mixed profile including several “Equal Weight” ratings. Investors might view Cummins as having more robust institutional support, possibly reducing perceived downside risk.
Risks specific to each company
The following categories identify the critical pressure points and systemic threats facing both firms in the 2026 market environment:
1. Market & Competition
Cummins Inc.
- Faces intense competition in industrial engines and powertrains with a broad product portfolio but limited diversification outside core markets.
AMETEK, Inc.
- Competes in niche electronic instruments and electromechanical devices markets, benefiting from specialized products but exposed to slower growth sectors.
2. Capital Structure & Debt
Cummins Inc.
- Moderate leverage (D/E 0.59) with favorable debt-to-assets (21.3%) and strong interest coverage (13.05x); balance sheet shows financial flexibility.
AMETEK, Inc.
- Low leverage (D/E 0.21), superior debt-to-assets ratio (14.21%), and very strong interest coverage (23.13x) indicate robust financial stability and lower risk.
3. Stock Volatility
Cummins Inc.
- Beta 1.12 suggests slightly higher volatility than market average, reflecting sensitivity to industrial cycle swings.
AMETEK, Inc.
- Beta 1.04 indicates moderate volatility, closer to the market average, reducing exposure to abrupt market fluctuations.
4. Regulatory & Legal
Cummins Inc.
- Subject to stringent emission standards impacting engine design and costs; ongoing regulatory shifts in climate policy could increase compliance expenses.
AMETEK, Inc.
- Faces regulatory scrutiny primarily on product safety and environmental standards but less exposed to direct emission regulations compared to Cummins.
5. Supply Chain & Operations
Cummins Inc.
- Complex global supply chain with risks from raw material price volatility and geopolitical disruptions affecting manufacturing and delivery timelines.
AMETEK, Inc.
- Supply chain less complex but reliant on specialized components; potential risks from supplier concentration and logistics delays remain.
6. ESG & Climate Transition
Cummins Inc.
- Active in electrification and hydrogen technologies, facing pressure to accelerate climate transition investments while managing legacy diesel business risks.
AMETEK, Inc.
- ESG focus on energy efficiency and emissions reduction in products; slower transition risk but less exposure to fossil fuel dependency.
7. Geopolitical Exposure
Cummins Inc.
- Significant global operations expose it to trade tensions, tariffs, and regional instability impacting sales and supply chains.
AMETEK, Inc.
- Less globally diversified, reducing geopolitical risk but limiting growth opportunities in emerging markets.
Which company shows a better risk-adjusted profile?
Cummins’ biggest risk lies in regulatory shifts and supply chain complexity, which could pressure margins. AMETEK faces valuation and liquidity concerns but boasts stronger financial health and lower leverage. AMETEK’s higher Altman Z-score and Piotroski score suggest a safer risk profile. However, Cummins’ leadership in climate tech offers long-term upside despite near-term risks. Recent data show AMETEK’s superior interest coverage and lower debt-to-equity ratio justify its stronger balance sheet resilience.
Final Verdict: Which stock to choose?
Cummins Inc. stands out as a powerhouse of operational efficiency and robust capital allocation. Its ability to generate returns significantly above its cost of capital underscores a solid value creation engine. The main point of vigilance remains its declining ROIC trend, which suggests caution. Cummins fits well within aggressive growth portfolios seeking industrial strength with a value tilt.
AMETEK, Inc. boasts a strategic moat rooted in its sustainable competitive advantage and steadily growing profitability. It offers a safer profile with strong balance sheet metrics and a very favorable ROIC trajectory. This positions AMETEK as a compelling candidate for investors favoring GARP—growth at a reasonable price—with an emphasis on stability.
If you prioritize operational efficiency and value creation amid some margin pressure, Cummins outshines as the compelling choice due to its strong returns and industrial leverage. However, if you seek a more stable growth story with a durable moat and improving profitability, AMETEK offers better stability and a more consistent upward trajectory. Both carry risks, but their profiles cater to distinct investor archetypes.
Disclaimer: Investment carries a risk of loss of initial capital. The past performance is not a reliable indicator of future results. Be sure to understand risks before making an investment decision.
Go Further
I encourage you to read the complete analyses of Cummins Inc. and AMETEK, Inc. to enhance your investment decisions: