Home > Comparison > Industrials > AME vs ATS
The strategic rivalry between AMETEK, Inc. and ATS Corporation shapes the industrial machinery sector’s evolution. AMETEK operates as a diversified manufacturer with advanced electronic instruments and electromechanical devices. ATS focuses on automation solutions, emphasizing integrated systems and digital factory innovations. This head-to-head pits manufacturing scale against automation expertise. I will analyze which trajectory offers a superior risk-adjusted return for a diversified portfolio, balancing growth potential and operational resilience.
Table of contents
Companies Overview
AMETEK and ATS Corporation stand as influential players in the industrial machinery sector, each with distinct market approaches.
AMETEK, Inc.: Global Industrial Instrumentation Leader
AMETEK dominates the industrial machinery market with advanced electronic instruments and electromechanical devices. Its revenue stems from two segments: Electronic Instruments serving aerospace and process industries, and Electromechanical offering precision motion control and metal products. In 2026, AMETEK focuses on expanding its aerospace and power quality monitoring solutions to solidify its competitive advantage.
ATS Corporation: Automation Solutions Specialist
ATS Corporation excels in delivering custom automation and manufacturing systems worldwide. It generates revenue by designing, building, and servicing automation equipment alongside software that enhances factory floor efficiency. ATS’s 2026 strategy prioritizes integrating digital solutions and connected factory management to drive sustainable production improvements across diverse sectors.
Strategic Collision: Similarities & Divergences
Both companies serve the industrial machinery arena but diverge sharply. AMETEK emphasizes a broad portfolio of precision instruments and components, while ATS commits to bespoke automation systems and digital integration. Their primary battleground is manufacturing efficiency and innovation. AMETEK presents a diversified industrial exposure; ATS offers a niche focus on automation technology with a digital edge.
Income Statement Comparison
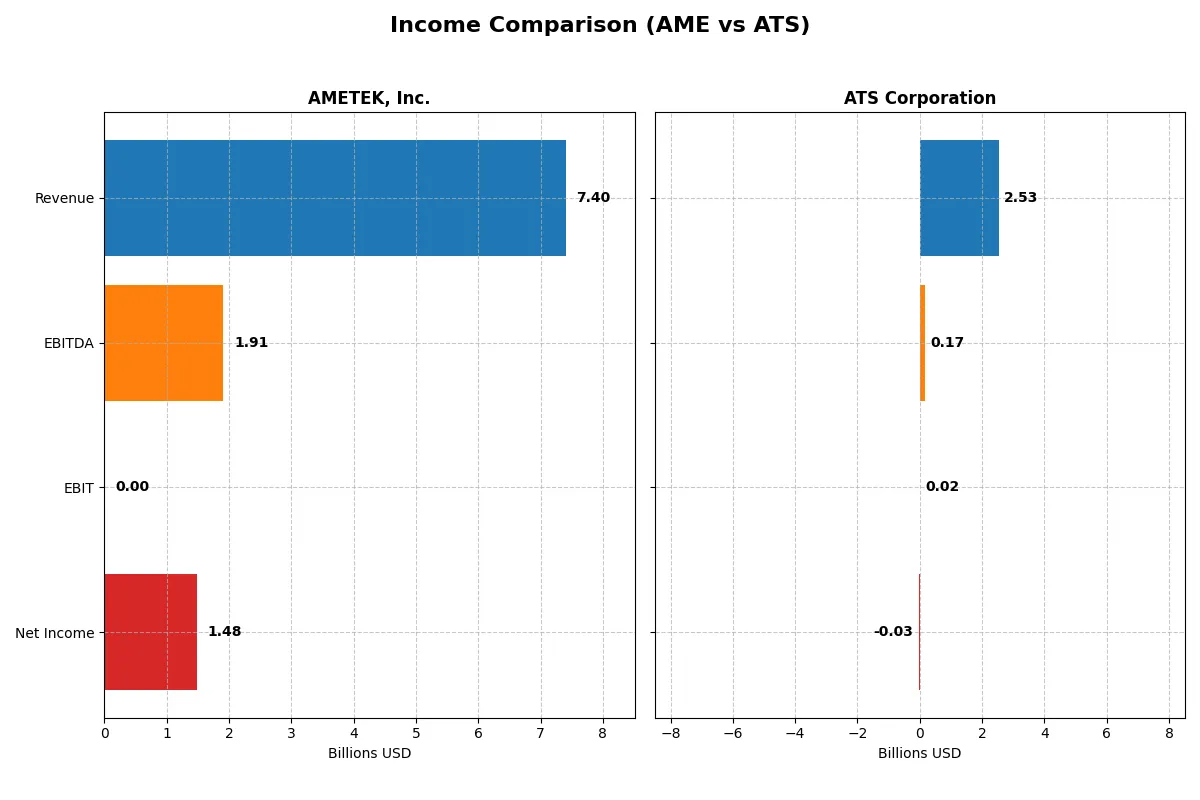
This data dissects the core profitability and scalability of both corporate engines to reveal who dominates the bottom line:
| Metric | AMETEK, Inc. (AME) | ATS Corporation (ATS) |
|---|---|---|
| Revenue | 7.4B | 2.5B |
| Cost of Revenue | 0 | 1.9B |
| Operating Expenses | 5.5B | 637M |
| Gross Profit | 0 | 647M |
| EBITDA | 1.9B | 168M |
| EBIT | 0 | 15M |
| Interest Expense | 81M | 98M |
| Net Income | 1.5B | -28M |
| EPS | 6.42 | -0.29 |
| Fiscal Year | 2025 | 2025 |
Income Statement Analysis: The Bottom-Line Duel
This income statement comparison reveals the true efficiency of AMETEK, Inc. and ATS Corporation’s corporate engines over recent years.
AMETEK, Inc. Analysis
AMETEK’s revenue rose steadily from 5.5B in 2021 to 7.4B in 2025, with net income climbing from 990M to 1.48B. Its net margin held strong at 20%, reflecting solid profitability despite unfavorable gross margin reporting in 2025. The company’s 2025 momentum shows efficient cost control and EPS growth of nearly 8%, signaling robust operational execution.
ATS Corporation Analysis
ATS’s revenue peaked at 3B CAD in 2024 but fell to 2.5B CAD in 2025, dragging net income into a 28M CAD loss. Gross margin remained favorable at 25.5%, but EBIT and net margins weakened sharply, turning negative. The 2025 results highlight deteriorating profitability and a steep EPS decline, undermining operational efficiency despite solid longer-term revenue growth.
Profitability Resilience vs. Margin Pressure
AMETEK outperforms ATS with consistent profit growth and stable net margins, delivering reliability and scale. ATS’s fluctuating revenue and sharp margin declines reveal vulnerability in cost management and earnings quality. For investors, AMETEK’s resilient profitability profile offers a more attractive foundation than ATS’s current margin struggles.
Financial Ratios Comparison
These vital ratios act as a diagnostic tool to expose the underlying fiscal health, valuation premiums, and capital efficiency of the companies analyzed:
| Ratios | AMETEK, Inc. (AME) | ATS Corporation (ATS) |
|---|---|---|
| ROE | 14.3% | -1.6% |
| ROIC | 11.1% | 0.09% |
| P/E | 30.3 | -125.3 |
| P/B | 4.32 | 2.06 |
| Current Ratio | 1.24 | 1.69 |
| Quick Ratio | 0.75 | 1.41 |
| D/E | 0.24 | 1.00 |
| Debt-to-Assets | 15.9% | 36.8% |
| Interest Coverage | 15.8 | 0.09 |
| Asset Turnover | 0.47 | 0.55 |
| Fixed Asset Turnover | 6.58 | 5.66 |
| Payout ratio | 18.8% | 0% |
| Dividend yield | 0.62% | 0% |
| Fiscal Year | 2024 | 2025 |
Efficiency & Valuation Duel: The Vital Signs
Financial ratios serve as a company’s DNA, exposing hidden risks and operational strengths crucial for sound investment decisions.
AMETEK, Inc.
AMETEK shows solid profitability with a 14.25% ROE and a favorable 19.83% net margin, reflecting efficient core operations. However, its valuation appears stretched with a high P/E of 30.29 and P/B of 4.32. Shareholder returns include a modest 0.62% dividend yield, indicating a cautious payout alongside reinvestment in R&D.
ATS Corporation
ATS exhibits weak profitability, posting negative net margin (-1.11%) and ROE (-1.64%), signaling operational challenges. The valuation metrics are mixed: an unusual negative P/E but a reasonable P/B of 2.06. ATS pays no dividends, focusing instead on maintaining liquidity with a strong current ratio and managing debt carefully.
Premium Valuation vs. Operational Safety
AMETEK commands a premium valuation backed by consistent profitability, while ATS struggles with losses but maintains better liquidity ratios. AMETEK balances risk and reward for growth-focused investors. ATS suits those prioritizing operational stability amid uncertainty.
Which one offers the Superior Shareholder Reward?
I see AMETEK, Inc. (AME) delivers consistent dividends with a 0.62% yield and a sustainable payout ratio near 18.8%. It pairs this with robust buybacks, fueling total returns. ATS Corporation (ATS) pays no dividend and suffers negative free cash flow, limiting shareholder distributions. ATS reinvests heavily in capex but struggles with profitability and has no buybacks. Historically, AME’s balanced distribution strategy outperforms ATS’s growth-at-all-costs model. I conclude AMETEK offers the more attractive total return profile for 2026 investors.
Comparative Score Analysis: The Strategic Profile
The radar chart reveals the fundamental DNA and trade-offs of AMETEK, Inc. and ATS Corporation, clarifying their strategic strengths and weaknesses:
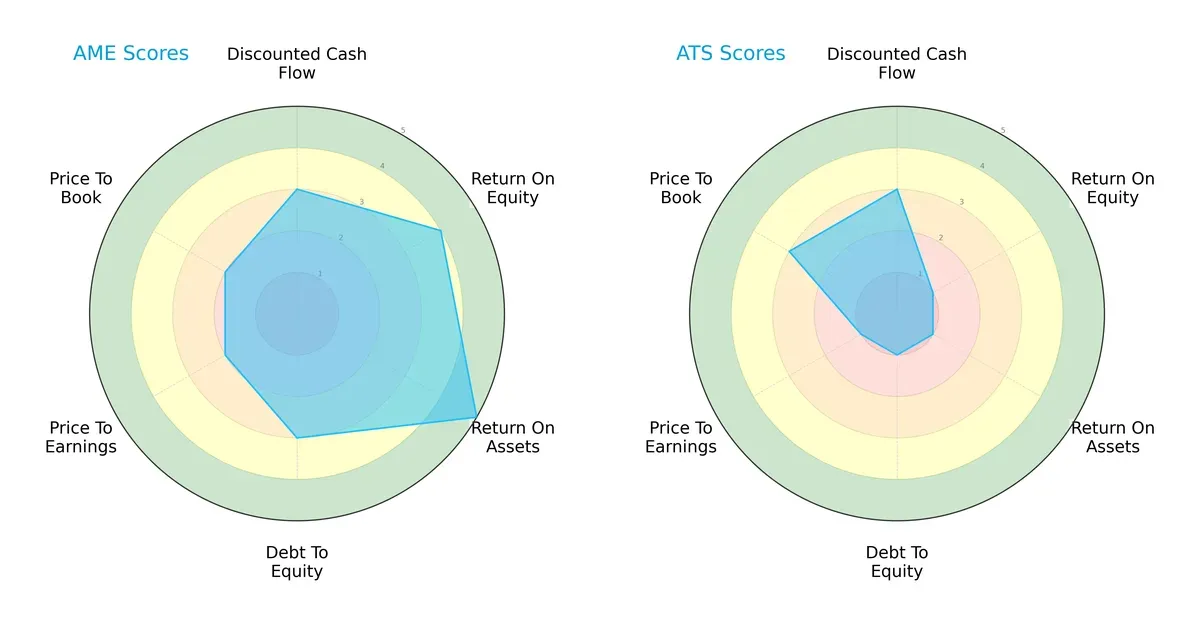
AMETEK shows a balanced profile with strong ROE (4) and ROA (5) scores, indicating efficient profit generation and asset use. ATS relies on a weaker operational base, marked by very unfavorable ROE (1) and ROA (1) scores. Both have moderate DCF scores (3), but AMETEK’s better debt management (3 vs. 1) and valuation metrics (PE and PB scores at 2 vs. ATS’s 1 and 3) suggest a more stable financial footing.
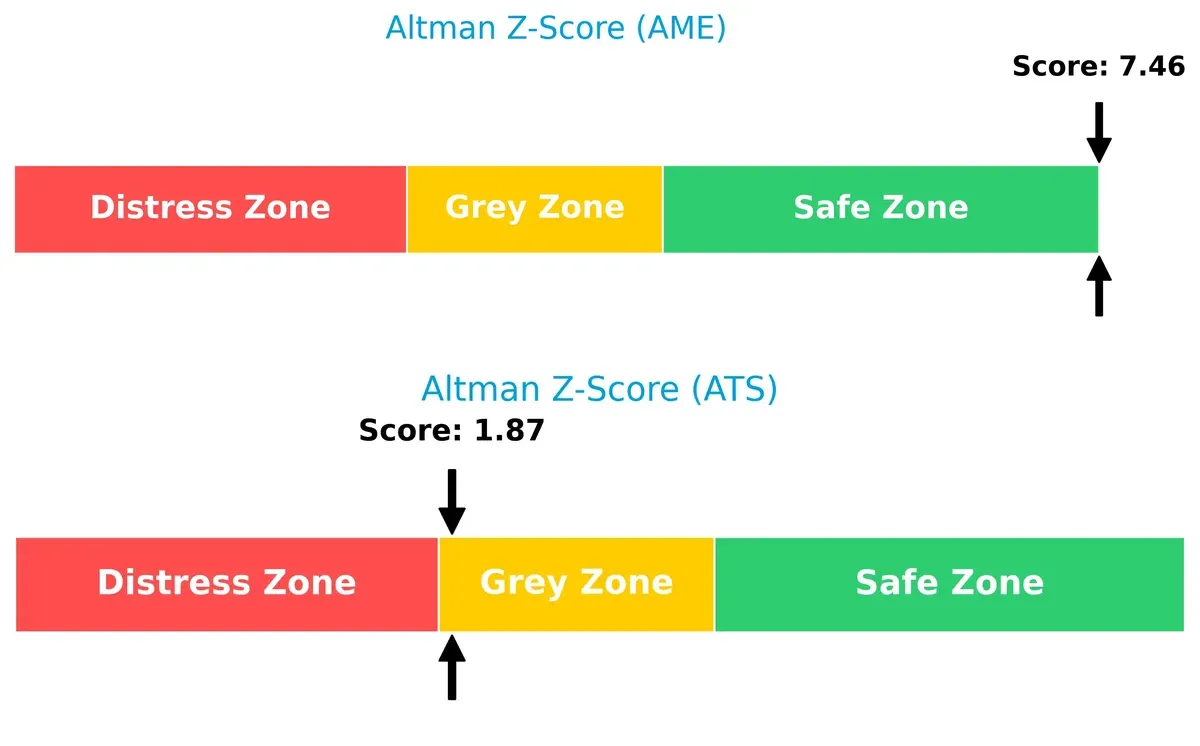
Bankruptcy Risk: Solvency Showdown
AMETEK’s Altman Z-Score of 7.46 places it comfortably in the safe zone, while ATS’s 1.87 positions it in the grey zone, signaling elevated bankruptcy risk amid current market pressures:
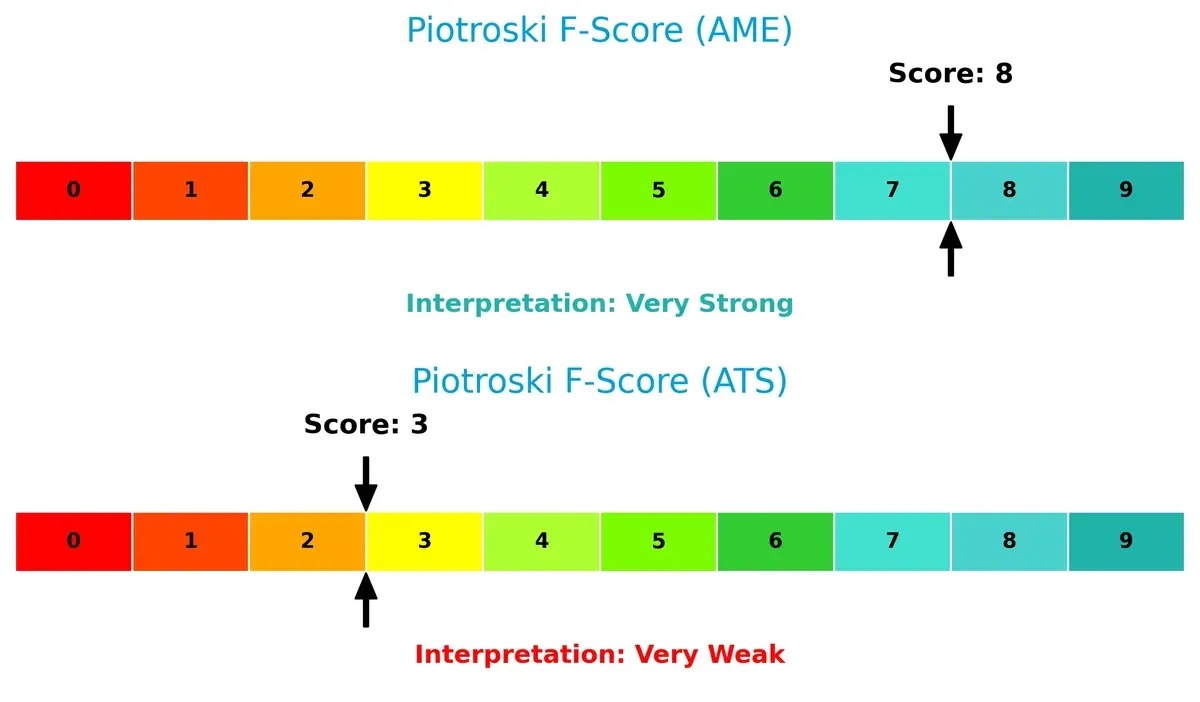
Financial Health: Quality of Operations
AMETEK’s Piotroski F-Score of 8 demonstrates very strong financial health and operational quality. ATS’s low score of 3 raises red flags, suggesting weaker internal financial controls and profitability challenges:
How are the two companies positioned?
This section dissects AMETEK and ATS’s operational DNA by comparing their revenue mix and internal strengths and weaknesses. The goal is to confront their economic moats and identify which model offers a more resilient, sustainable advantage today.
Revenue Segmentation: The Strategic Mix
This visual comparison dissects how AMETEK, Inc. and ATS Corporation diversify their income streams and where their primary sector bets lie:
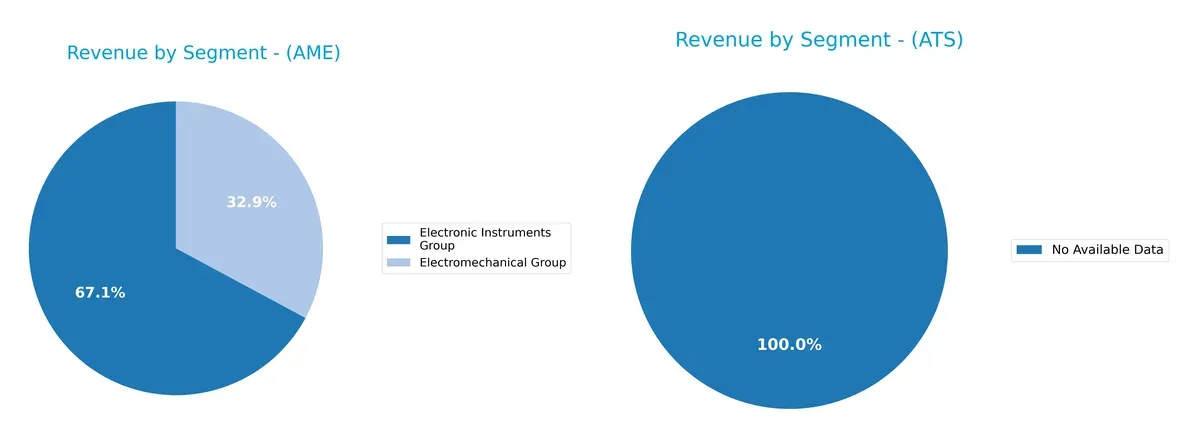
AMETEK, Inc. generates $4.66B from its Electronic Instruments Group and $2.28B from Electromechanical Group in 2024, showing a balanced two-segment mix. ATS Corporation lacks available data, preventing direct comparison. AMETEK’s dual-segment revenue anchors its strategy, reducing concentration risk and leveraging complementary technologies within its industrial ecosystem. This diversification supports resilience amid sector shifts.
Strengths and Weaknesses Comparison
This table compares the Strengths and Weaknesses of AMETEK, Inc. and ATS Corporation:
AMETEK, Inc. Strengths
- Strong net margin at 19.83%
- Favorable debt-to-equity at 0.24
- Robust fixed asset turnover at 6.58
- Large revenue base diversified in two segments
- Solid US and international geographic presence
ATS Corporation Strengths
- Favorable WACC at 7.7%
- Strong current and quick ratios at 1.69 and 1.41
- Favorable fixed asset turnover at 5.66
- Significant US and European market presence
AMETEK, Inc. Weaknesses
- Unfavorable P/E of 30.29 and P/B of 4.32
- Low quick ratio at 0.75
- Negative interest coverage
- Unfavorable asset turnover at 0.47
- Modest dividend yield at 0.62%
ATS Corporation Weaknesses
- Negative net margin and ROE
- Minimal ROIC at 0.09%
- Unfavorable interest coverage
- No dividend yield
- High debt-to-assets at 36.79%
AMETEK shows stronger profitability and asset efficiency but faces valuation and liquidity challenges. ATS’s financial health is mixed, with liquidity strengths but significant profitability weaknesses. These profiles reflect contrasting strategic and operational priorities.
The Moat Duel: Analyzing Competitive Defensibility
A structural moat is the only reliable barrier protecting long-term profits from relentless competitive erosion:
AMETEK, Inc.: Engineering Precision with Intangible Assets
I see AMETEK’s moat rooted in strong intangible assets and diversified industrial expertise. Its stable net margins near 20% and growing ROIC demonstrate efficient capital use. New aerospace and process control products could deepen this moat in 2026.
ATS Corporation: Automation at a Cost Disadvantage
ATS relies on specialized automation systems but suffers from a declining ROIC and negative net margins. Unlike AMETEK, ATS faces shrinking profitability. Expansion into digital factory solutions offers growth potential but risks remain high.
Durable Intangibles vs. Struggling Automation: Who Defends Better?
AMETEK’s widening moat from intangible assets and improving returns outpaces ATS’s value-destroying automation segment. AMETEK stands far better to defend its market share amid economic cycles and competitive pressures.
Which stock offers better returns?
Over the past 12 months, AMETEK, Inc. surged 26.11%, showing accelerating gains and notable volatility; ATS Corporation declined 22.28% but reversed recently with modest upward momentum.
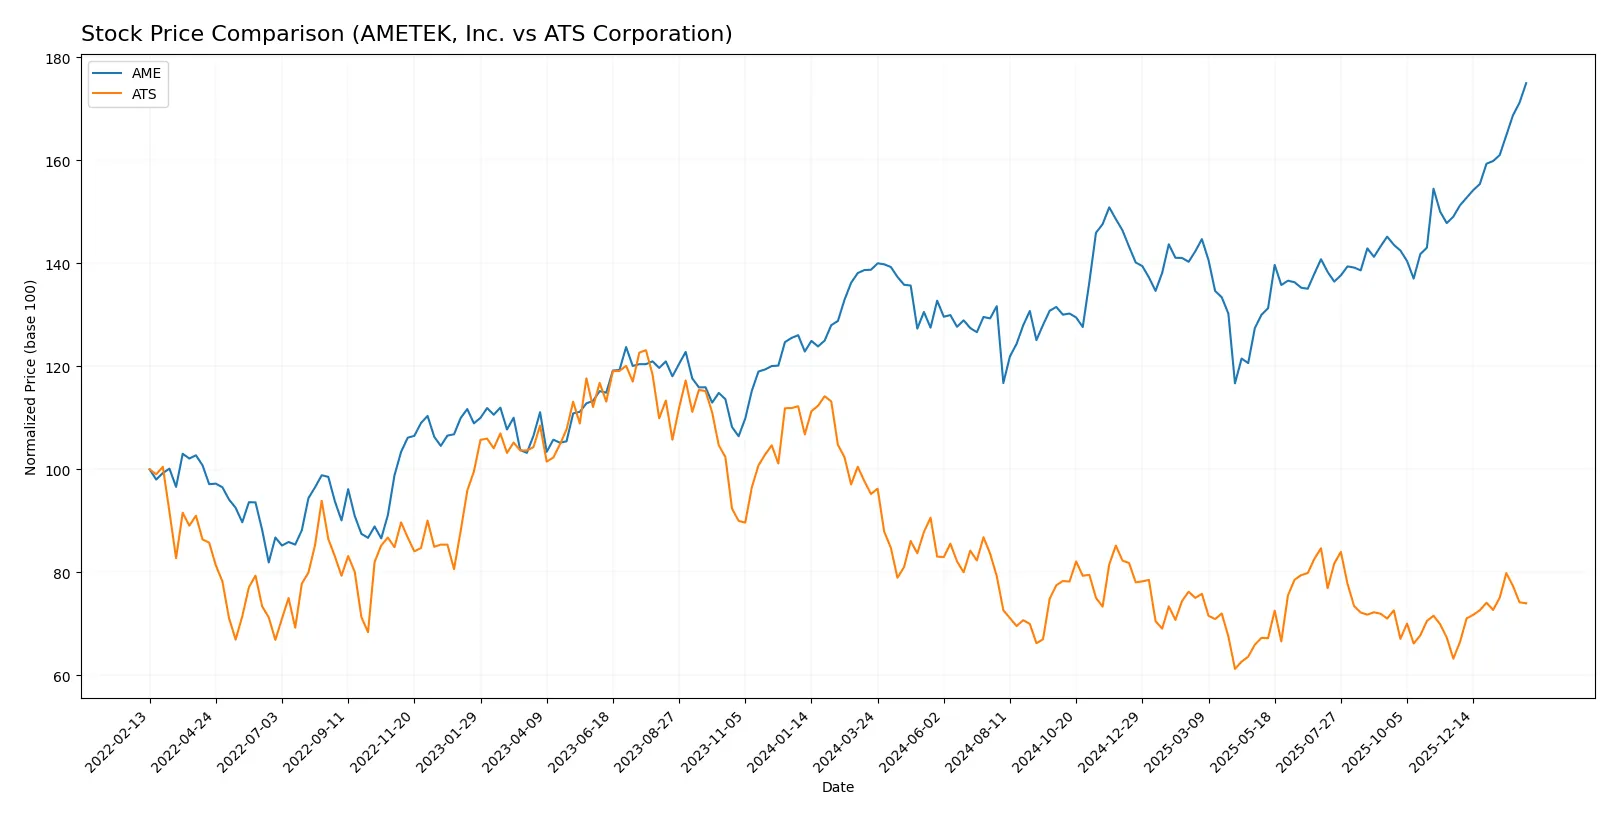
Trend Comparison
AMETEK, Inc. exhibits a bullish trend with a 26.11% price increase over the past year, accelerating gains, and high volatility, hitting a peak of 228.92.
ATS Corporation shows a bearish full-year trend with a 22.28% decline but recent modest recovery of 17.02%, low volatility, and a flattening upward slope.
Comparing both, AMETEK delivered superior market performance with sustained strong gains. ATS’s overall decline limits its relative return despite recent improvement.
Target Prices
Analysts show a moderately bullish consensus for AMETEK, Inc. and a steady outlook for ATS Corporation.
| Company | Target Low | Target High | Consensus |
|---|---|---|---|
| AMETEK, Inc. | 204 | 271 | 231.64 |
| ATS Corporation | 34 | 34 | 34 |
AMETEK’s target consensus at 231.64 slightly exceeds its current price of 228.92, indicating modest upside potential. ATS’s consensus stands firm at 34, well above its current 28.39, suggesting room for growth.

Don’t Let Luck Decide Your Entry Point
Optimize your entry points with our advanced ProRealTime indicators. You’ll get efficient buy signals with precise price targets for maximum performance. Start outperforming now!
How do institutions grade them?
AMETEK, Inc. Grades
The following table summarizes recent institutional grades for AMETEK, Inc.:
| Grading Company | Action | New Grade | Date |
|---|---|---|---|
| Oppenheimer | Downgrade | Perform | 2026-01-27 |
| Morgan Stanley | Maintain | Equal Weight | 2026-01-12 |
| Keybanc | Maintain | Overweight | 2026-01-07 |
| Barclays | Maintain | Equal Weight | 2026-01-07 |
| Keybanc | Maintain | Overweight | 2026-01-06 |
| Mizuho | Maintain | Outperform | 2026-01-05 |
| TD Cowen | Upgrade | Buy | 2025-12-23 |
| DA Davidson | Maintain | Buy | 2025-12-08 |
| Baird | Maintain | Neutral | 2025-11-03 |
| Keybanc | Maintain | Overweight | 2025-10-31 |
ATS Corporation Grades
The following table summarizes recent institutional grades for ATS Corporation:
| Grading Company | Action | New Grade | Date |
|---|---|---|---|
| JP Morgan | Maintain | Neutral | 2026-01-16 |
| JP Morgan | Maintain | Neutral | 2024-08-13 |
| Goldman Sachs | Maintain | Sell | 2024-08-13 |
| JP Morgan | Maintain | Neutral | 2024-05-24 |
Which company has the best grades?
AMETEK, Inc. holds stronger grades with multiple Buy and Overweight ratings, contrasting ATS Corporation’s consistent Neutral and Sell grades. This disparity may influence investor confidence and portfolio positioning.
Risks specific to each company
The following categories identify the critical pressure points and systemic threats facing both firms in the 2026 market environment:
1. Market & Competition
AMETEK, Inc.
- Operates in diverse industrial segments with strong product breadth; faces intense competition in advanced instruments and electromechanical devices.
ATS Corporation
- Focuses on automation solutions, competing in niche markets but vulnerable to large automation providers and technological shifts.
2. Capital Structure & Debt
AMETEK, Inc.
- Maintains low debt-to-equity (0.24) and debt-to-assets (15.9%), reflecting prudent leverage and financial stability.
ATS Corporation
- Higher leverage with debt-to-equity at 1.0 and debt-to-assets at 36.8%, increasing financial risk in volatile markets.
3. Stock Volatility
AMETEK, Inc.
- Beta around 1.04 indicates market-correlated volatility, suggesting moderate risk consistent with industrial peers.
ATS Corporation
- Higher beta at 1.16 signals greater sensitivity to market swings, elevating stock price volatility risk.
4. Regulatory & Legal
AMETEK, Inc.
- Exposure to aerospace, medical, and environmental sectors demands compliance with complex regulations, increasing operational risk.
ATS Corporation
- Automation in regulated industries like life sciences and nuclear introduces regulatory complexities but with focused compliance efforts.
5. Supply Chain & Operations
AMETEK, Inc.
- Global manufacturing footprint heightens exposure to supply chain disruptions but benefits from diversified supplier base.
ATS Corporation
- Heavy reliance on integrated automation supply chains creates vulnerability to component shortages and logistics bottlenecks.
6. ESG & Climate Transition
AMETEK, Inc.
- ESG pressure due to energy-intensive manufacturing and aerospace exposure; ongoing initiatives to improve sustainability are critical.
ATS Corporation
- Faces growing ESG demands in automation and nuclear sectors; must enhance climate transition strategies to meet investor expectations.
7. Geopolitical Exposure
AMETEK, Inc.
- US-based with global operations; geopolitical tensions and trade policies may disrupt supply chains and market access.
ATS Corporation
- Canadian HQ with global reach; geopolitical risks include cross-border trade barriers and exposure to volatile international markets.
Which company shows a better risk-adjusted profile?
AMETEK’s strongest risk lies in supply chain complexity and regulatory compliance, while ATS struggles most with capital structure and financial health. Despite ATS’s neutral global ratio stance, AMETEK’s robust Altman Z-Score (7.46, safe zone) and Piotroski Score (8, very strong) underscore superior financial resilience. AMETEK’s moderate stock volatility and low leverage offer a more balanced risk profile. ATS’s elevated debt and weak profitability metrics heighten its risk exposure. Recent data show AMETEK’s stable financial footing contrasts sharply with ATS’s precarious leverage and negative returns, justifying my cautious preference for AMETEK in risk-adjusted terms.
Final Verdict: Which stock to choose?
AMETEK, Inc. (AME) excels as a cash-generating powerhouse with a steadily growing return on invested capital. Its core strength lies in operational efficiency and consistent profitability. However, a point of vigilance is its relatively high valuation multiples, which may pressure future returns. AME suits investors targeting disciplined, long-term growth in industrial sectors.
ATS Corporation (ATS) offers a strategic moat in specialized automation solutions, with a reasonable capital structure and solid liquidity. Compared to AME, ATS presents greater operational challenges and weaker profitability metrics, reflecting a turnaround profile. This makes ATS more fitting for risk-tolerant investors seeking potential value recovery and industry niche exposure.
If you prioritize capital efficiency and stable growth, AMETEK outshines with superior profitability and financial strength. However, if you seek speculative upside in a restructuring play, ATS offers a scenario for higher risk-adjusted returns despite current margin pressures. Each stock appeals to distinct investor avatars requiring tailored risk appetites and time horizons.
Disclaimer: Investment carries a risk of loss of initial capital. The past performance is not a reliable indicator of future results. Be sure to understand risks before making an investment decision.
Go Further
I encourage you to read the complete analyses of AMETEK, Inc. and ATS Corporation to enhance your investment decisions: