Home > Comparison > Financial Services > BK vs AMP
The strategic rivalry between The Bank of New York Mellon Corporation and Ameriprise Financial, Inc. shapes the landscape of the Financial Services sector. BNY Mellon operates as a capital-intensive asset manager focusing on custody and wealth services. Ameriprise excels as a high-margin wealth management and advisory firm. This analysis will assess which company’s business model offers a superior risk-adjusted return for diversified portfolios in today’s evolving market environment.

Table of contents
Companies Overview
The Bank of New York Mellon and Ameriprise Financial dominate key niches in asset management and wealth services.
The Bank of New York Mellon Corporation: Custodian and Asset Servicer Giant
The Bank of New York Mellon is a global leader in securities services and asset management. Its primary revenue comes from custody, trust, and middle-office solutions supporting financial institutions and high-net-worth clients. In 2026, it emphasizes integrated cash management and data analytics to enhance client operational efficiency and maintain its competitive edge.
Ameriprise Financial, Inc.: Comprehensive Wealth Manager
Ameriprise Financial operates as a full-service wealth and asset management firm focused on financial planning, advice, and retirement solutions. Its core revenue derives from advisory fees, insurance products, and institutional asset management. The firm’s 2026 strategy centers on expanding advisory services and diversifying its retirement and protection solutions to capture broader market segments.
Strategic Collision: Similarities & Divergences
Both firms operate in asset management but diverge markedly: BNY Mellon prioritizes institutional custody and infrastructure, while Ameriprise focuses on retail advisory and insurance products. Their primary battle for market share lies between institutional clients versus individual investors. This distinction shapes unique investment profiles—BNY Mellon as a financial infrastructure powerhouse and Ameriprise as a client-centric advisory specialist.
Income Statement Comparison
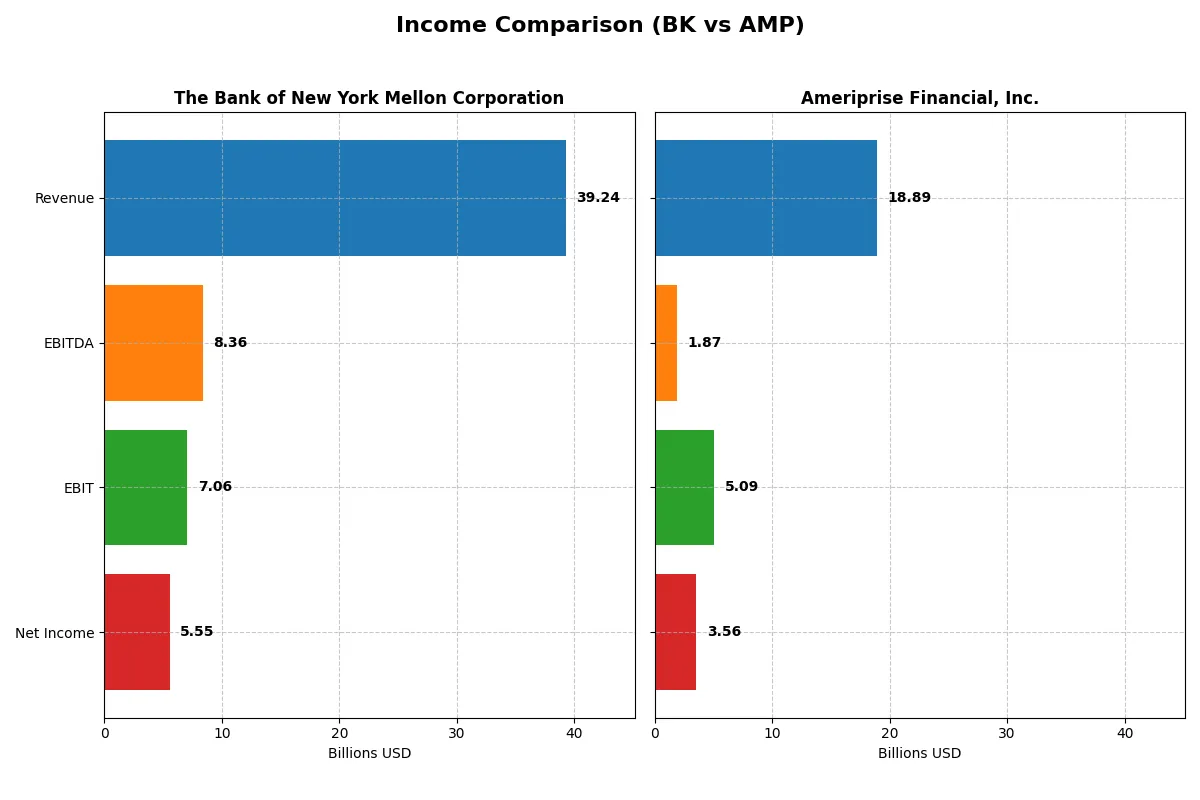
This data dissects the core profitability and scalability of both corporate engines to reveal who dominates the bottom line:
| Metric | The Bank of New York Mellon Corporation (BK) | Ameriprise Financial, Inc. (AMP) |
|---|---|---|
| Revenue | 39.2B | 18.9B |
| Cost of Revenue | 19.4B | 8.7B |
| Operating Expenses | 12.8B | 5.1B |
| Gross Profit | 19.9B | 10.2B |
| EBITDA | 8.4B | 1.9B |
| EBIT | 7.1B | 5.1B |
| Interest Expense | 20.7B | 0.3B |
| Net Income | 5.5B | 3.6B |
| EPS | 7.46 | 36.9 |
| Fiscal Year | 2025 | 2025 |
Income Statement Analysis: The Bottom-Line Duel
This income statement comparison reveals which corporate engine drives efficiency and profitability with more power and consistency.
The Bank of New York Mellon Corporation Analysis
BK’s revenue grew sharply by 147% over five years, though it slipped slightly in 2025 to $39.2B. Net income climbed 48% overall, reaching $5.5B in 2025. The firm sustains strong gross margins above 50%, with net margins improving to 14.1%. Rising EBIT and EPS growth signal robust momentum despite a modest revenue dip.
Ameriprise Financial, Inc. Analysis
AMP’s revenue rose steadily by 41% over five years, hitting $18.9B in 2025. Net income growth remained modest at 4%, totaling $3.6B in 2025. The company boasts superior gross (54%) and net margins (18.9%), but recent declines in EBIT and net margin suggest efficiency challenges. EPS growth remains positive, reflecting disciplined capital management.
Margin Power vs. Revenue Scale
BK outpaces AMP in revenue and net income growth, fueled by strong margin expansion and operational leverage. AMP leads in margin percentages but faces recent margin compression and slower top-line growth. For investors, BK offers a dynamic growth profile; AMP’s appeal lies in higher profitability but with less momentum.
Financial Ratios Comparison
These vital ratios act as a diagnostic tool to expose underlying fiscal health, valuation premiums, and capital efficiency for the companies compared below:
| Ratios | The Bank of New York Mellon Corporation (BK) | Ameriprise Financial, Inc. (AMP) |
|---|---|---|
| ROE | 12.5% | 54.4% |
| ROIC | 6.4% | 60.4% |
| P/E | 14.7 | 0 (not available) |
| P/B | 1.85 | 0 (not available) |
| Current Ratio | 0.70 | 0 |
| Quick Ratio | 0.70 | 0 |
| D/E (Debt-to-Equity) | 0.76 | 0.90 |
| Debt-to-Assets | 7.2% | 60.8% |
| Interest Coverage | 0.34 | 0 (not available) |
| Asset Turnover | 0.08 | 1.96 |
| Fixed Asset Turnover | 10.96 | 0 (not applicable) |
| Payout ratio | 25.4% | 0% |
| Dividend yield | 1.72% | 0% |
| Fiscal Year | 2025 | 2025 |
Efficiency & Valuation Duel: The Vital Signs
Financial ratios act as a company’s DNA, revealing hidden risks and operational strengths that shape investor decisions.
The Bank of New York Mellon Corporation
The bank posts a solid 12.5% ROE and a healthy 14.1% net margin, reflecting steady profitability. Its P/E of 14.7 indicates a fairly valued stock, not overstretched. Dividend yield stands at 1.72%, offering moderate shareholder returns amid neutral capital efficiency and slightly unfavorable liquidity ratios.
Ameriprise Financial, Inc.
Ameriprise impresses with a robust 54.4% ROE and 18.8% net margin, signaling exceptional profitability. P/E and P/B ratios are favorable though exact values are unavailable. The company lacks dividends, suggesting it prioritizes reinvestment into growth and operational expansion. Liquidity ratios appear weak, posing a risk factor.
Balanced Profitability vs. Growth Ambition
Ameriprise offers superior profitability and growth potential but carries liquidity risks. Bank of New York Mellon presents a steadier, dividend-paying profile with moderate valuation. Investors seeking operational safety may prefer the bank, while those chasing aggressive returns might lean toward Ameriprise.
Which one offers the Superior Shareholder Reward?
I find The Bank of New York Mellon (BK) delivers a more balanced shareholder reward than Ameriprise Financial (AMP). BK offers a 1.7-3.6% dividend yield with a steady payout ratio near 25-54%. Its buybacks have been moderate but consistent, reinforcing capital return without overstretching. AMP pays a lower 1.0-1.5% dividend yield with a payout ratio below 22%, yet it channels excess cash into growth and buybacks, signaling aggressive capital allocation. However, BK’s dividend coverage and free cash flow stability make its distribution model more sustainable amid market cycles. I conclude BK offers a superior total return profile for 2026 investors prioritizing income and steady capital return.
Comparative Score Analysis: The Strategic Profile
The radar chart reveals the fundamental DNA and trade-offs of The Bank of New York Mellon Corporation and Ameriprise Financial, Inc.:
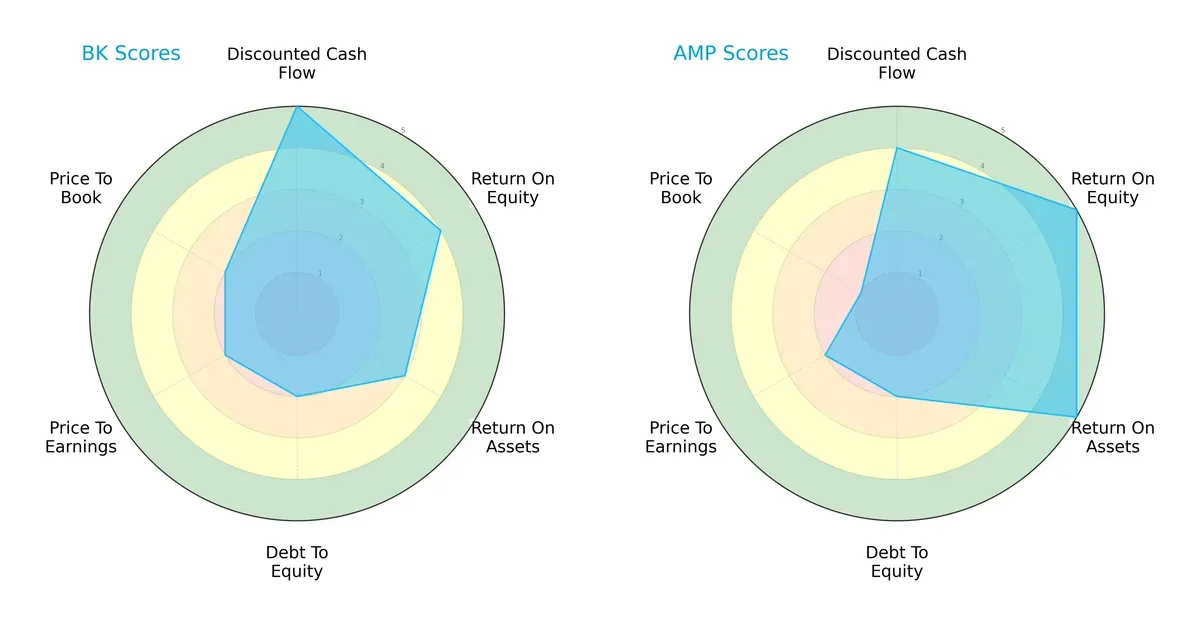
I observe that BK excels in discounted cash flow with a score of 5, showing strong valuation discipline, while AMP leads in profitability metrics, scoring 5 in both ROE and ROA. Both have moderate debt-to-equity and P/E scores, but AMP’s very unfavorable price-to-book score of 1 contrasts with BK’s moderate 2. BK presents a balanced financial profile, relying on valuation strength, whereas AMP leverages operational efficiency but shows valuation concerns.
Bankruptcy Risk: Solvency Showdown
The Altman Z-Score gap between BK (0.10, distress zone) and AMP (7.68, safe zone) is stark:
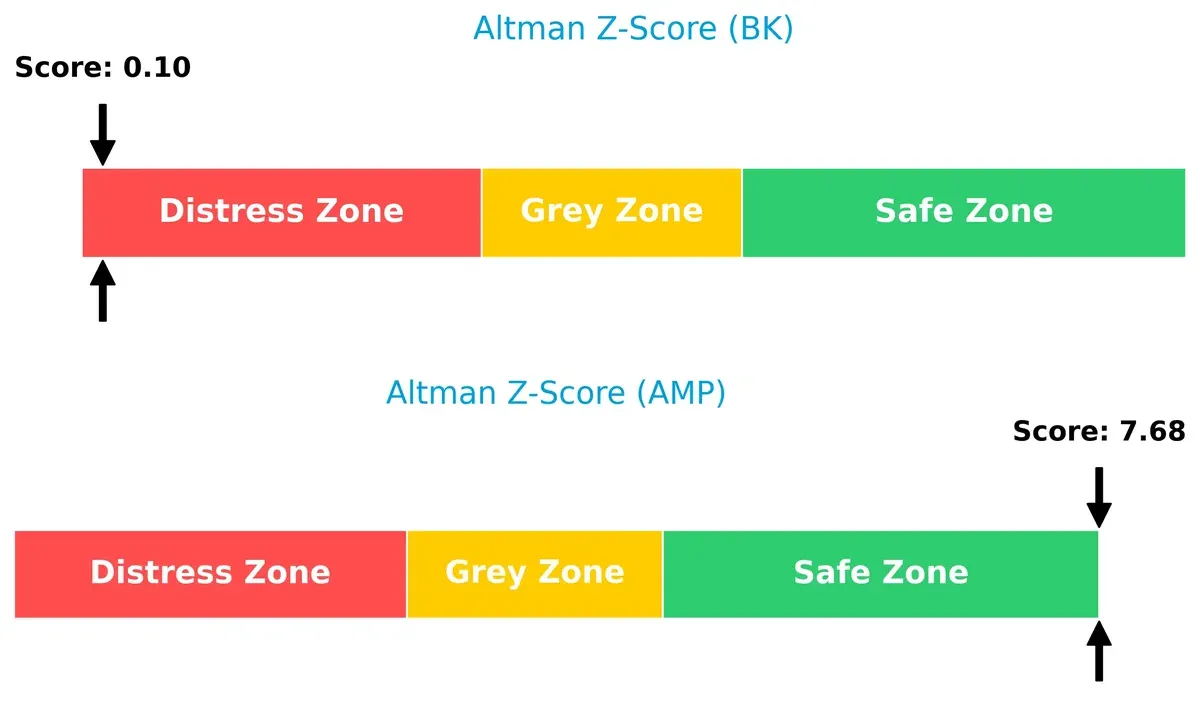
This signals BK faces high bankruptcy risk amid current cycles, indicating financial distress. Conversely, AMP’s position in the safe zone suggests strong long-term solvency and resilience to economic shocks.
Financial Health: Quality of Operations
Both firms score 6 on the Piotroski F-Score, placing them in the average category:
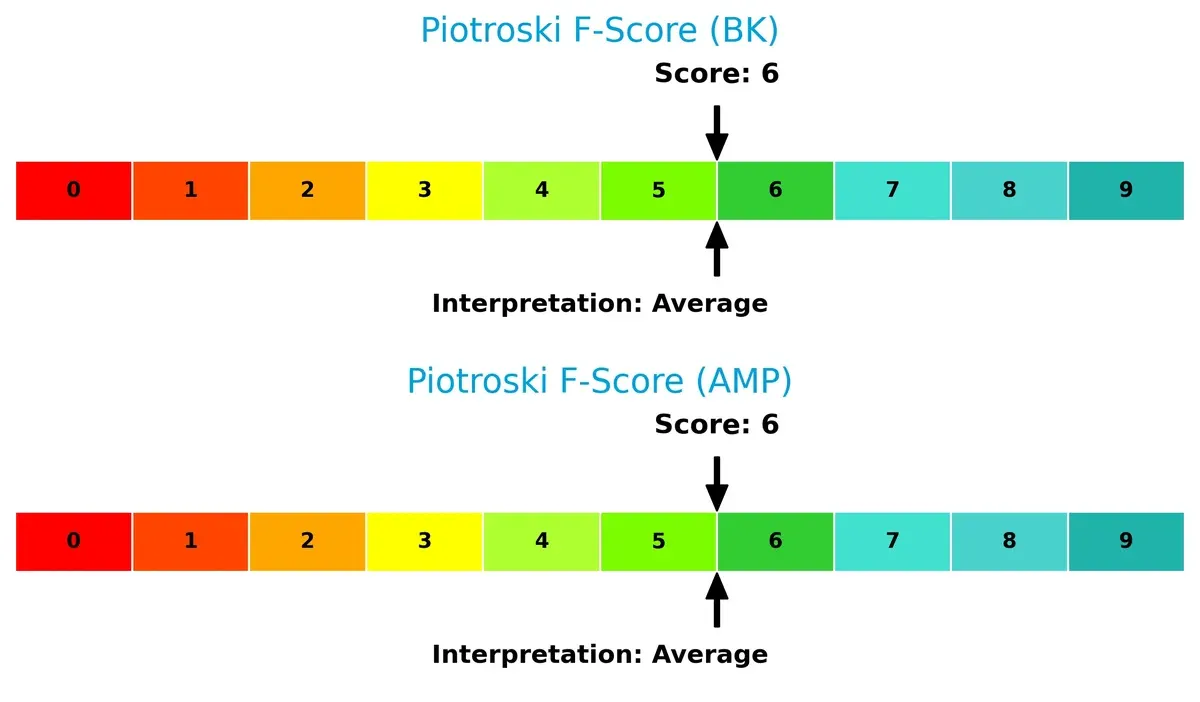
This parity indicates moderate operational quality and financial health for both companies. Neither shows immediate red flags, but there’s room for improvement in internal metrics to reach peak financial strength.
How are the two companies positioned?
This section dissects BK and AMP’s operational DNA by comparing their revenue distribution and internal dynamics, including strengths and weaknesses. The goal is to confront their economic moats to identify which model offers the most resilient competitive advantage today.
Revenue Segmentation: The Strategic Mix
The following visual comparison dissects how The Bank of New York Mellon Corporation and Ameriprise Financial, Inc. diversify their income streams and where their primary sector bets lie:
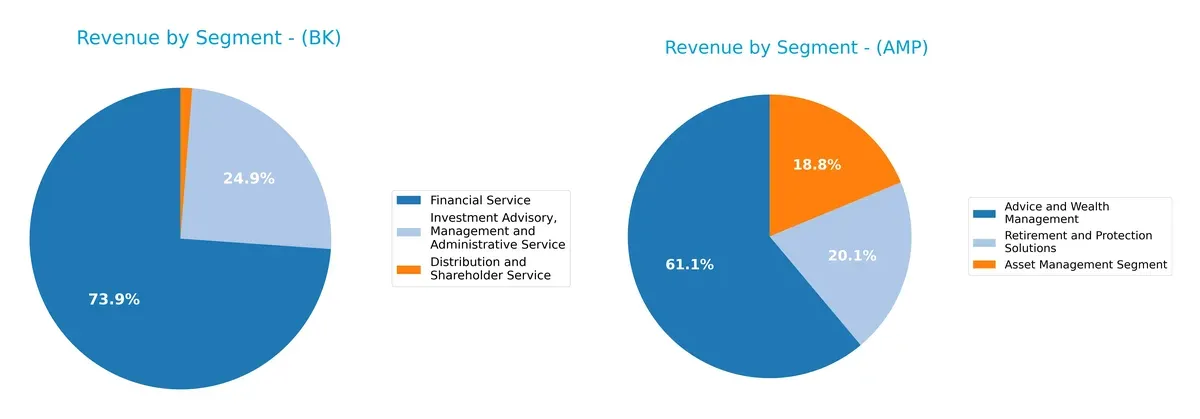
The Bank of New York Mellon leans heavily on Financial Service with $9.34B, anchoring its revenue, while Ameriprise Financial spreads its bets more evenly across Advice and Wealth Management ($11.44B), Asset Management ($3.52B), and Retirement Solutions ($3.77B). BK’s concentration signals infrastructure dominance but risks exposure to sector-specific shocks. AMP’s diversified mix suggests stronger ecosystem lock-in and resilience amid market shifts.
Strengths and Weaknesses Comparison
This table compares the Strengths and Weaknesses of BK and AMP:
BK Strengths
- Diversified revenue streams across financial and investment services
- Favorable net margin at 14.14%
- Favorable debt to assets at 7.17%
- Strong fixed asset turnover at 10.96
- Significant US and EMEA revenue presence
AMP Strengths
- High profitability with net margin 18.83%
- Exceptional ROE at 54.41% and ROIC at 60.42%
- Favorable asset turnover at 1.96
- Strong interest coverage at 15.72
- Diversified wealth management and protection segments
BK Weaknesses
- Unfavorable WACC at 19.98% exceeds ROIC
- Low current and quick ratios at 0.7 indicate liquidity concerns
- Unfavorable interest coverage at 0.34
- Asset turnover low at 0.08
- Slightly unfavorable global ratio trend
AMP Weaknesses
- High debt to assets at 60.75% raises financial risk
- Current and quick ratios reported as zero indicating liquidity issues
- Unfavorable fixed asset turnover at 0
- Zero dividend yield may deter income investors
BK demonstrates solid diversification and controlled leverage but faces liquidity and cost of capital challenges. AMP excels in profitability and operational efficiency but carries risks from high leverage and liquidity gaps. These contrasts highlight differing strategic focuses and financial structures.
The Moat Duel: Analyzing Competitive Defensibility
A structural moat is the only shield protecting long-term profits from relentless competitive erosion. Let’s dissect how these two asset managers defend their turf:
The Bank of New York Mellon Corporation: Intangible Assets and Scale as a Moat
I see BNY Mellon’s moat rooted in its vast network of custody and trust services, leveraging intangible assets like client relationships. Its slightly unfavorable ROIC vs. WACC signals value erosion, yet growth in ROIC hints at potential recovery fueled by expanded global services in 2026.
Ameriprise Financial, Inc.: Advice & Wealth Management with Strong Capital Efficiency
Ameriprise’s moat centers on personalized financial advice and wealth management, contrasting BNY’s asset servicing. It creates value with a ROIC far exceeding WACC, demonstrating superior capital allocation and profitability that should accelerate through new advisory tech and product innovation in 2026.
Custody Network vs. Personalized Advice: Who Holds the Deeper Moat?
Ameriprise commands the deeper moat with a robust ROIC and expanding profitability, clearly outpacing BNY Mellon’s value-destroying trend. Ameriprise is better equipped to defend and grow market share amid intensifying industry competition.
Which stock offers better returns?
The past year shows strong bullish momentum for both stocks, with notable price appreciation and distinct trading volume patterns shaping their trajectories.
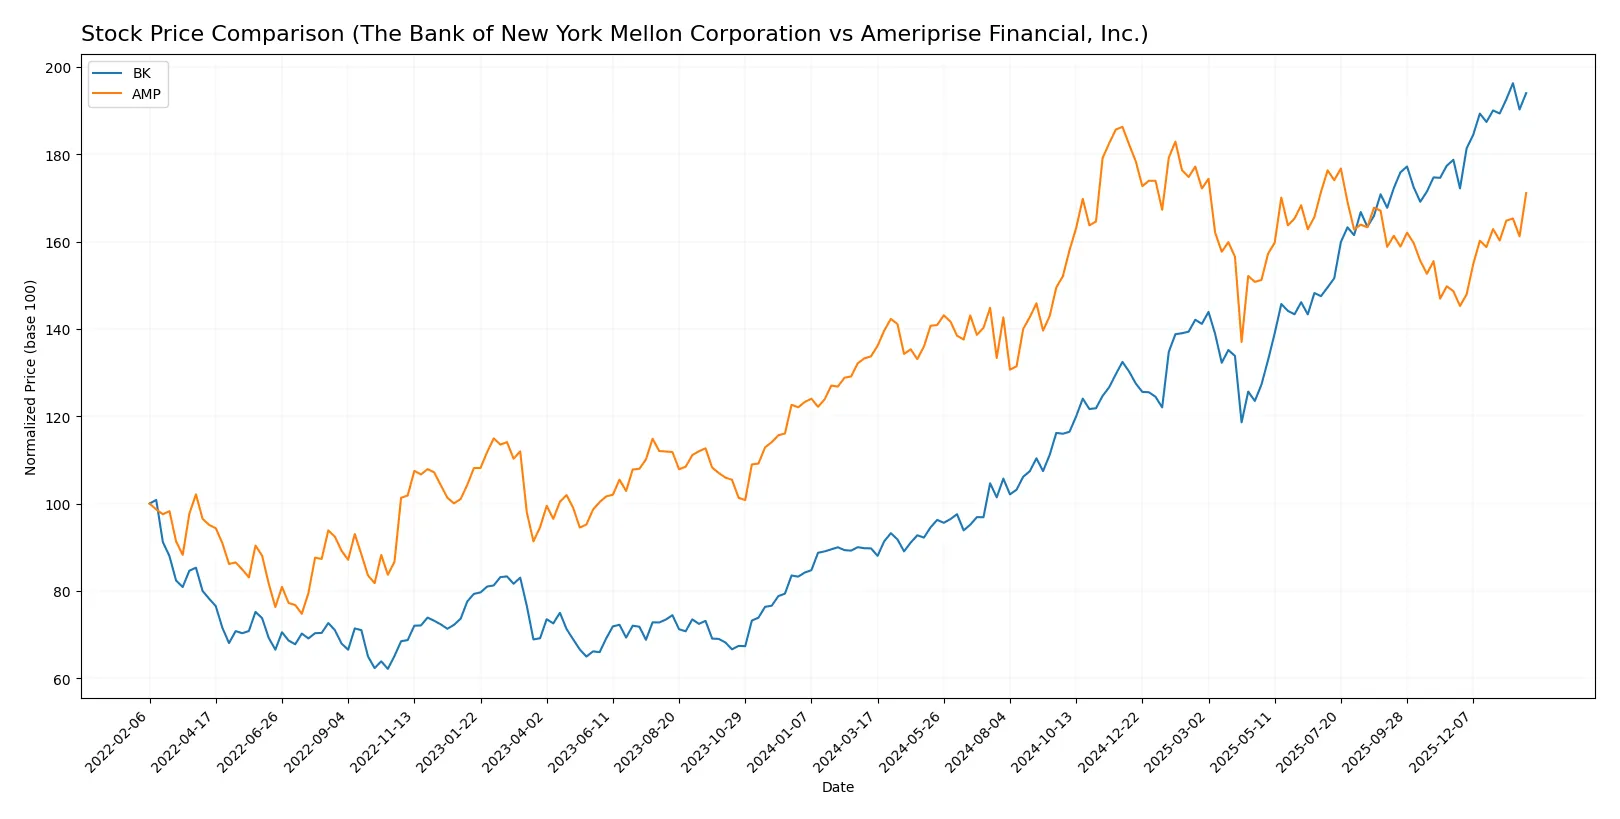
Trend Comparison
The Bank of New York Mellon Corporation (BK) gained 116.19% over the past 12 months, displaying a bullish trend with accelerating momentum and a volatility standard deviation of 19.39. It reached a high of 121.33 and a low of 54.41.
Ameriprise Financial, Inc. (AMP) rose 27.96% in the same period, also bullish with acceleration. Its volatility is higher at 45.04, with a peak at 573.97 and a trough at 402.61.
BK’s return vastly outpaces AMP’s, delivering the highest market performance despite AMP’s more volatile price swings.
Target Prices
Analysts present a bullish consensus for both The Bank of New York Mellon Corporation and Ameriprise Financial, Inc.
| Company | Target Low | Target High | Consensus |
|---|---|---|---|
| The Bank of New York Mellon Corporation | 110 | 143 | 130.25 |
| Ameriprise Financial, Inc. | 485 | 570 | 528.33 |
The Bank of New York Mellon’s consensus target of 130.25 exceeds its current price of 119.92, signaling moderate upside potential. Ameriprise Financial’s consensus target of 528.33 aligns closely with its current price of 527.19, indicating market expectations are priced in.

Don’t Let Luck Decide Your Entry Point
Optimize your entry points with our advanced ProRealTime indicators. You’ll get efficient buy signals with precise price targets for maximum performance. Start outperforming now!
How do institutions grade them?
The Bank of New York Mellon Corporation Grades
The following table shows recent institutional grades for The Bank of New York Mellon Corporation:
| Grading Company | Action | New Grade | Date |
|---|---|---|---|
| Citigroup | maintain | Neutral | 2026-01-14 |
| Morgan Stanley | maintain | Overweight | 2026-01-14 |
| RBC Capital | maintain | Sector Perform | 2026-01-14 |
| Wells Fargo | maintain | Equal Weight | 2026-01-14 |
| Keefe, Bruyette & Woods | maintain | Outperform | 2026-01-14 |
| Truist Securities | upgrade | Buy | 2026-01-07 |
| TD Cowen | maintain | Buy | 2026-01-07 |
| Barclays | maintain | Overweight | 2026-01-05 |
Ameriprise Financial, Inc. Grades
The following table shows recent institutional grades for Ameriprise Financial, Inc.:
| Grading Company | Action | New Grade | Date |
|---|---|---|---|
| Piper Sandler | upgrade | Neutral | 2026-01-30 |
| Morgan Stanley | maintain | Underweight | 2025-12-22 |
| Argus Research | maintain | Buy | 2025-11-13 |
| RBC Capital | maintain | Outperform | 2025-11-03 |
| Keefe, Bruyette & Woods | maintain | Market Perform | 2025-11-03 |
| Evercore ISI Group | maintain | In Line | 2025-10-09 |
| Raymond James | maintain | Strong Buy | 2025-07-25 |
| William Blair | downgrade | Market Perform | 2025-07-25 |
Which company has the best grades?
The Bank of New York Mellon holds more consistent buy and overweight ratings, reflecting stronger institutional confidence. Ameriprise shows mixed grades, including underweight and downgrades, signaling varied analyst views. Investors may view BNY Mellon’s grades as more favorable for stability.
Risks specific to each company
The following categories identify the critical pressure points and systemic threats facing both firms in the 2026 market environment:
1. Market & Competition
The Bank of New York Mellon Corporation
- Faces intense competition in asset servicing and custody with pressure on fees and technology upgrades.
Ameriprise Financial, Inc.
- Competes in wealth management with strong brand but must innovate amid fintech disruption.
2. Capital Structure & Debt
The Bank of New York Mellon Corporation
- Maintains moderate debt with favorable debt-to-assets (7.17%) but weak interest coverage (0.34).
Ameriprise Financial, Inc.
- Higher leverage (60.75% debt-to-assets) but strong interest coverage (15.72), indicating manageable debt cost.
3. Stock Volatility
The Bank of New York Mellon Corporation
- Beta of 1.109 signals moderate sensitivity to market swings, typical for financial services.
Ameriprise Financial, Inc.
- Beta of 1.256 suggests higher stock volatility, reflecting greater sensitivity to market cycles.
4. Regulatory & Legal
The Bank of New York Mellon Corporation
- Subject to stringent global custody and banking regulations; compliance costs remain high.
Ameriprise Financial, Inc.
- Faces complex regulatory environment in insurance and wealth sectors with evolving standards.
5. Supply Chain & Operations
The Bank of New York Mellon Corporation
- Dependent on technology infrastructure with risks from cyber threats and system outages.
Ameriprise Financial, Inc.
- Operations rely on advisor networks and technology platforms; disruption risks include advisor attrition.
6. ESG & Climate Transition
The Bank of New York Mellon Corporation
- Increasing pressure on sustainable investing and renewable energy allocations within portfolio services.
Ameriprise Financial, Inc.
- ESG integration in products and underwriting is critical; lagging in climate risk disclosures.
7. Geopolitical Exposure
The Bank of New York Mellon Corporation
- Global footprint exposes it to cross-border regulatory changes and geopolitical tensions.
Ameriprise Financial, Inc.
- Primarily US-focused but exposed to international markets through asset management subsidiaries.
Which company shows a better risk-adjusted profile?
Ameriprise’s most significant risk is high leverage, though strong interest coverage and superior profitability support its balance sheet. BNY Mellon struggles with weak liquidity ratios and interest coverage despite lower leverage. Ameriprise’s safe-zone Altman Z-score contrasts sharply with BNY Mellon’s distress zone score. This indicates Ameriprise has a better risk-adjusted profile amid 2026’s financial environment.
Final Verdict: Which stock to choose?
The Bank of New York Mellon Corporation (BK) excels as a cash-generating powerhouse with a solid income stream and improving profitability. Its main point of vigilance is the weak liquidity position, which suggests caution in turbulent markets. BK fits best in portfolios seeking steady income with moderate growth.
Ameriprise Financial, Inc. (AMP) boasts a durable competitive moat grounded in exceptional return on invested capital and robust profitability. Its strategic strength lies in high capital efficiency and superior interest coverage, offering better stability than BK. AMP suits investors targeting growth at a reasonable price with a safety cushion.
If you prioritize resilient cash flow and income generation, BK is the compelling choice due to its proven ability to generate free cash despite liquidity concerns. However, if you seek superior capital returns and a durable competitive advantage, AMP outshines with its strong moat and stable financial health. Each represents a distinct analytical scenario fitting different investor profiles.
Disclaimer: Investment carries a risk of loss of initial capital. The past performance is not a reliable indicator of future results. Be sure to understand risks before making an investment decision.
Go Further
I encourage you to read the complete analyses of The Bank of New York Mellon Corporation and Ameriprise Financial, Inc. to enhance your investment decisions: