Home > Comparison > Financial Services > AMP vs TROW
The strategic rivalry between Ameriprise Financial, Inc. and T. Rowe Price Group, Inc. defines the current trajectory of asset management. Ameriprise operates a diversified financial services model with wealth management and insurance, while T. Rowe Price focuses on pure investment management with a strong emphasis on fundamental analysis and ESG. This head-to-head pits a broad financial services firm against a specialized asset manager. This analysis will identify which offers the superior risk-adjusted return for diversified portfolios.

Table of contents
Companies Overview
Ameriprise Financial and T. Rowe Price Group hold prominent roles in the US asset management industry, shaping wealth strategies nationwide.
Ameriprise Financial, Inc.: Comprehensive Wealth Architect
Ameriprise Financial leads as a diversified financial services provider. It generates revenue through advice and wealth management, asset management, and retirement products. In 2026, Ameriprise prioritizes expanding its advisory and insurance segments to deepen client relationships and enhance fee-based income.
T. Rowe Price Group, Inc.: Focused Investment Manager
T. Rowe Price Group stands out as a specialized investment manager focusing on equity and fixed income mutual funds. It drives revenue by managing public markets investments with a bottom-up approach. Its 2026 strategy emphasizes ESG investing and selective late-stage venture capital to align with evolving investor preferences.
Strategic Collision: Similarities & Divergences
Both firms operate in asset management but diverge philosophically: Ameriprise favors a broad financial solutions model, while T. Rowe Price centers on focused fund management and ESG. They compete primarily for institutional and high-net-worth clients seeking tailored investment strategies. Their distinct profiles reflect Ameriprise’s multi-segment scope versus T. Rowe Price’s concentrated investment expertise.
Income Statement Comparison
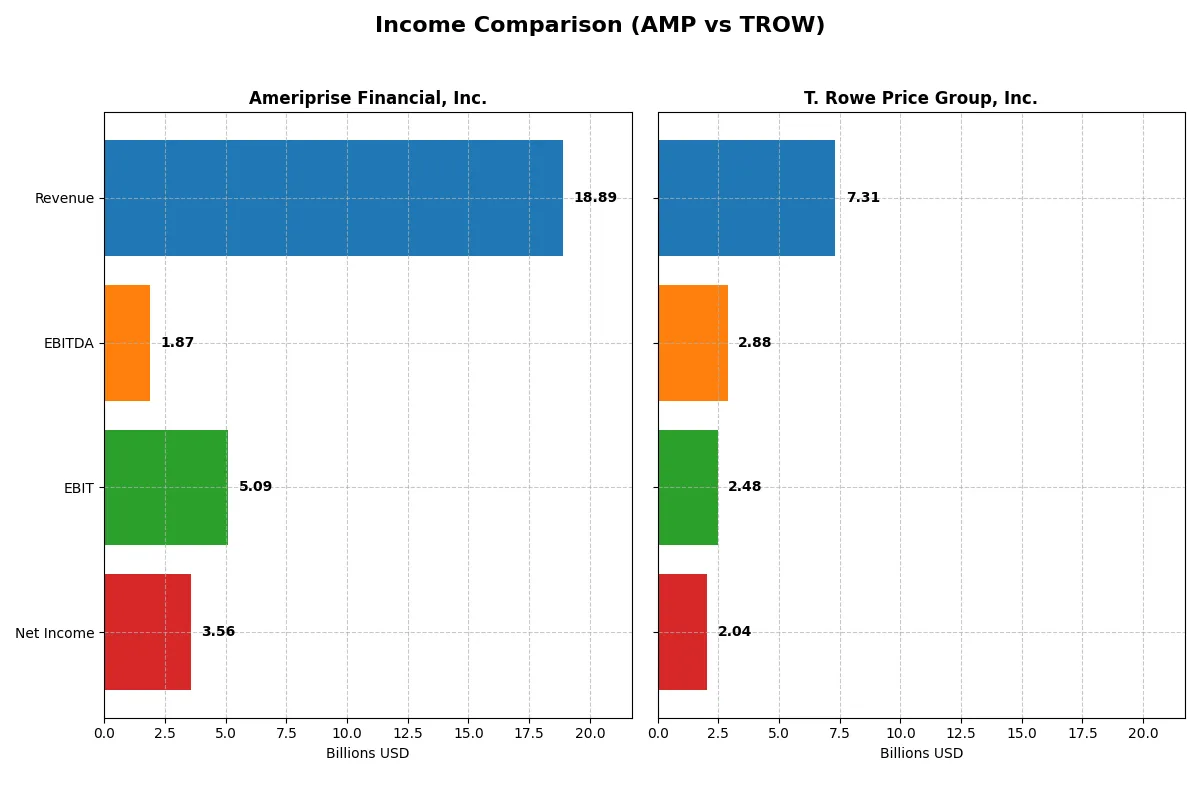
This data dissects the core profitability and scalability of both corporate engines to reveal who dominates the bottom line:
| Metric | Ameriprise Financial, Inc. (AMP) | T. Rowe Price Group, Inc. (TROW) |
|---|---|---|
| Revenue | 18.9B | 7.3B |
| Cost of Revenue | 8.7B | 1.1B |
| Operating Expenses | 5.1B | 5.1B |
| Gross Profit | 10.2B | 6.2B |
| EBITDA | 1.9B | 2.9B |
| EBIT | 5.1B | 2.5B |
| Interest Expense | 324M | 0 |
| Net Income | 3.6B | 2.0B |
| EPS | 36.9 | 9.3 |
| Fiscal Year | 2025 | 2025 |
Income Statement Analysis: The Bottom-Line Duel
This income statement comparison reveals the true operational efficiency and profitability trends of two financial industry leaders over recent years.
Ameriprise Financial, Inc. Analysis
Ameriprise’s revenue grew steadily from 13.4B in 2021 to 18.9B in 2025, showing consistent expansion. Net income rose modestly to 3.56B in 2025, with a solid gross margin near 54% and net margin around 19%. Despite a slight dip in EBIT, Ameriprise maintains strong profitability and stable margin health, signaling operational resilience.
T. Rowe Price Group, Inc. Analysis
T. Rowe Price saw revenue peak at 7.7B in 2021 but declined to 7.3B in 2025, reflecting softness in top-line growth. Net income dropped significantly by 34% over five years, ending at 2.04B in 2025. Despite a high gross margin of 84% and net margin near 28%, shrinking revenue and net income pressures highlight challenges in sustaining growth momentum.
Steady Growth vs. Shrinking Scale
Ameriprise Financial demonstrates superior revenue growth and a more resilient net income trajectory compared to T. Rowe Price’s declining scale. Ameriprise’s favorable margin stability contrasts with T. Rowe Price’s erosion in earnings despite higher margins. For investors prioritizing consistent growth and margin durability, Ameriprise offers a clearer fundamental advantage.
Financial Ratios Comparison
These vital ratios act as a diagnostic tool to expose the underlying fiscal health, valuation premiums, and capital efficiency of the companies analyzed:
| Ratios | Ameriprise Financial, Inc. (AMP) | T. Rowe Price Group, Inc. (TROW) |
|---|---|---|
| ROE | 65.1% (2024) | 20.3% (2024) |
| ROIC | 2.8% (2024) | 13.6% (2024) |
| P/E | 15.8 (2024) | 12.0 (2024) |
| P/B | 10.3 (2024) | 2.44 (2024) |
| Current Ratio | 107.2 (2024) | 8.01 (2024) |
| Quick Ratio | 107.2 (2024) | 8.01 (2024) |
| D/E | 1.05 (2024) | 0.027 (2024) |
| Debt-to-Assets | 3.0% (2024) | 2.1% (2024) |
| Interest Coverage | 19.6 (2024) | N/A |
| Asset Turnover | 0.099 (2024) | 0.53 (2024) |
| Fixed Asset Turnover | N/A | 5.89 (2024) |
| Payout ratio | 16.9% (2024) | 54.1% (2024) |
| Dividend yield | 1.07% (2024) | 4.51% (2024) |
| Fiscal Year | 2024 | 2024 |
Efficiency & Valuation Duel: The Vital Signs
Financial ratios serve as a company’s DNA, exposing hidden risks and measuring operational excellence in a concise, revealing snapshot.
Ameriprise Financial, Inc.
Ameriprise exhibits robust profitability with a 54.41% ROE and a strong 18.83% net margin, signaling operational efficiency. Its valuation metrics are favorable despite a zero P/E reported, indicating potential undervaluation or data nuances. The absence of dividends highlights a reinvestment focus, likely driving growth or debt management, though a high debt-to-assets ratio at 60.75% signals caution.
T. Rowe Price Group, Inc.
T. Rowe Price posts a solid 27.84% net margin and a reasonable P/E of 11.08, suggesting a fairly valued stock with efficient earnings generation. However, ROE and ROIC are unavailable or zero, which clouds profitability assessment. The company rewards shareholders with a 4.96% dividend yield, reflecting a shareholder-friendly capital allocation amid low debt metrics.
Profitability Strength vs. Shareholder Income Focus
Ameriprise leads on return metrics and operational efficiency but carries higher leverage risk and no dividend income. T. Rowe Price offers steady profitability with direct shareholder returns and conservative leverage. Investors prioritizing growth and operational strength may prefer Ameriprise, while income-focused investors might find T. Rowe Price’s dividend profile more fitting.
Which one offers the Superior Shareholder Reward?
I see Ameriprise Financial (AMP) pays a modest dividend yield of ~1.07% with a low payout ratio around 17%. It reinvests heavily, maintaining strong free cash flow coverage near 97%, signaling sustainable dividends. Buybacks appear limited, so total return leans on capital growth. T. Rowe Price (TROW) offers a robust 4.96% dividend yield but pays out over 54% of earnings, risking sustainability. However, its consistent buyback programs and higher net margins support total shareholder returns. Historically, TROW’s high payout and buybacks deliver superior immediate income, but AMP’s conservative payout and reinvestment strategy promise steadier long-term value. For 2026, I favor TROW for superior total returns due to its higher yield and buyback intensity, but AMP appeals to risk-conscious investors prioritizing sustainability.
Comparative Score Analysis: The Strategic Profile
The radar chart reveals the fundamental DNA and trade-offs of Ameriprise Financial, Inc. and T. Rowe Price Group, Inc., highlighting their financial strengths and valuation nuances:
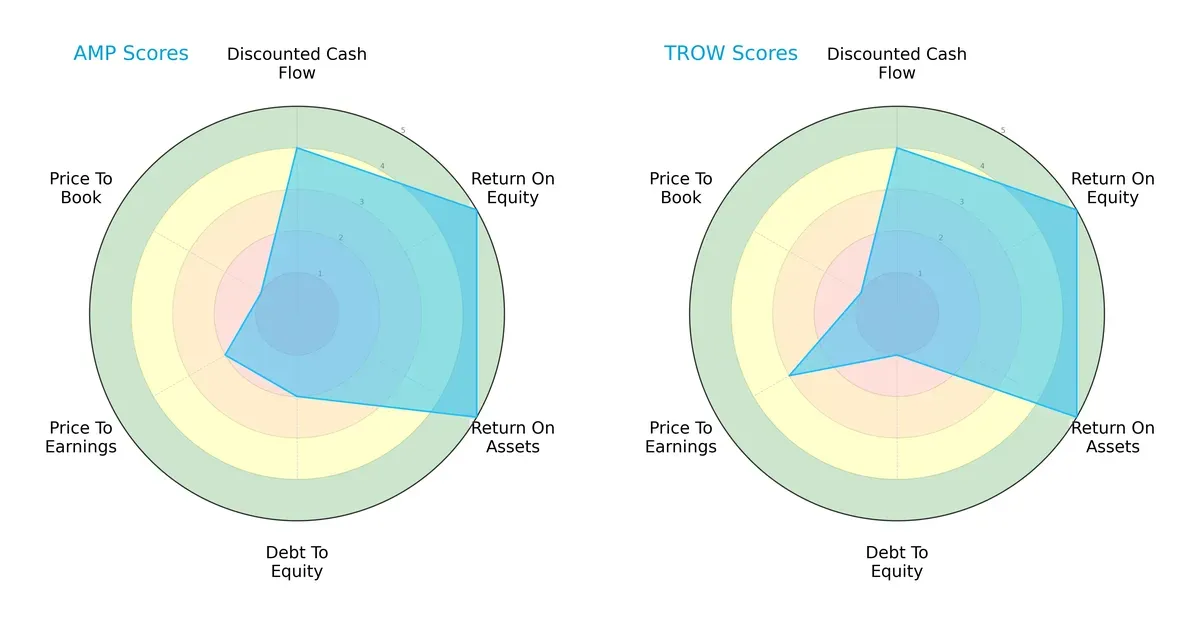
Both firms share strong operational efficiency, with top marks in ROE and ROA (5 each). Ameriprise shows a moderately better debt profile (Debt/Equity score 2 vs. 1), indicating less financial risk than T. Rowe Price, which has a weaker balance sheet. Valuation metrics reveal both companies face challenges, scoring low in Price-to-Book (1 each) and moderate to low in Price-to-Earnings (2 for Ameriprise, 3 for T. Rowe). Ameriprise presents a more balanced profile, while T. Rowe Price relies heavily on operational excellence despite higher leverage.
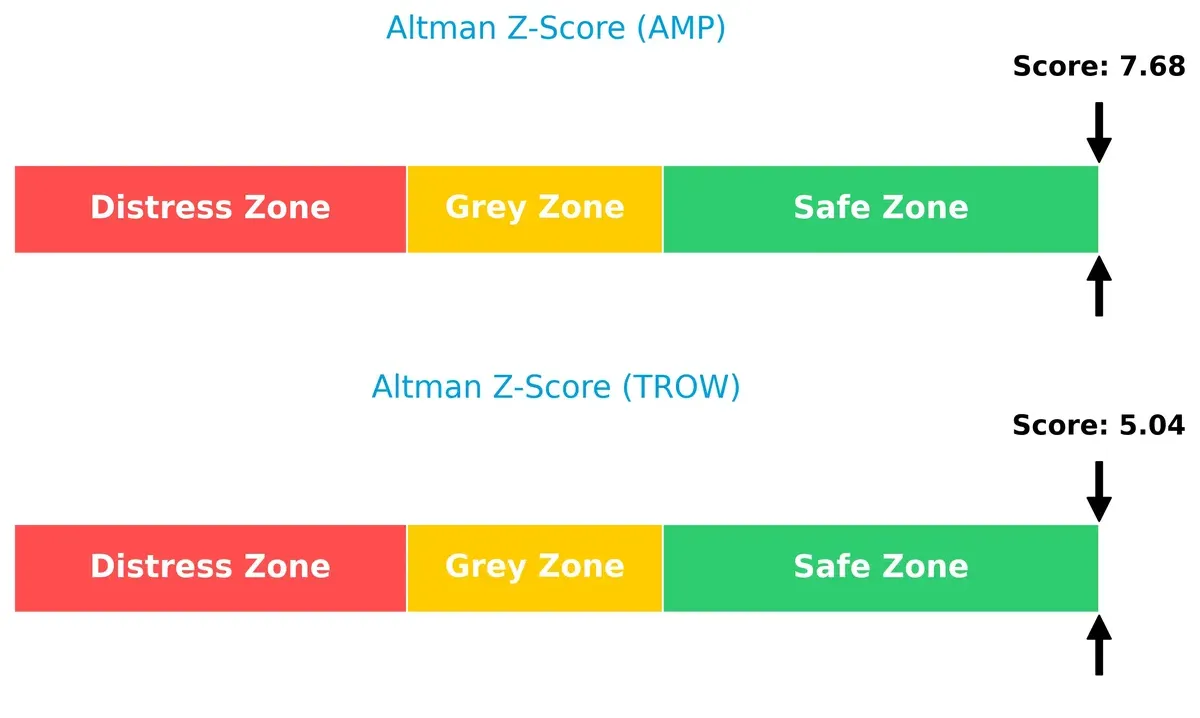
Bankruptcy Risk: Solvency Showdown
Ameriprise’s Altman Z-Score of 7.68 outpaces T. Rowe Price’s 5.04, signaling stronger solvency and lower bankruptcy risk for Ameriprise in this economic cycle:
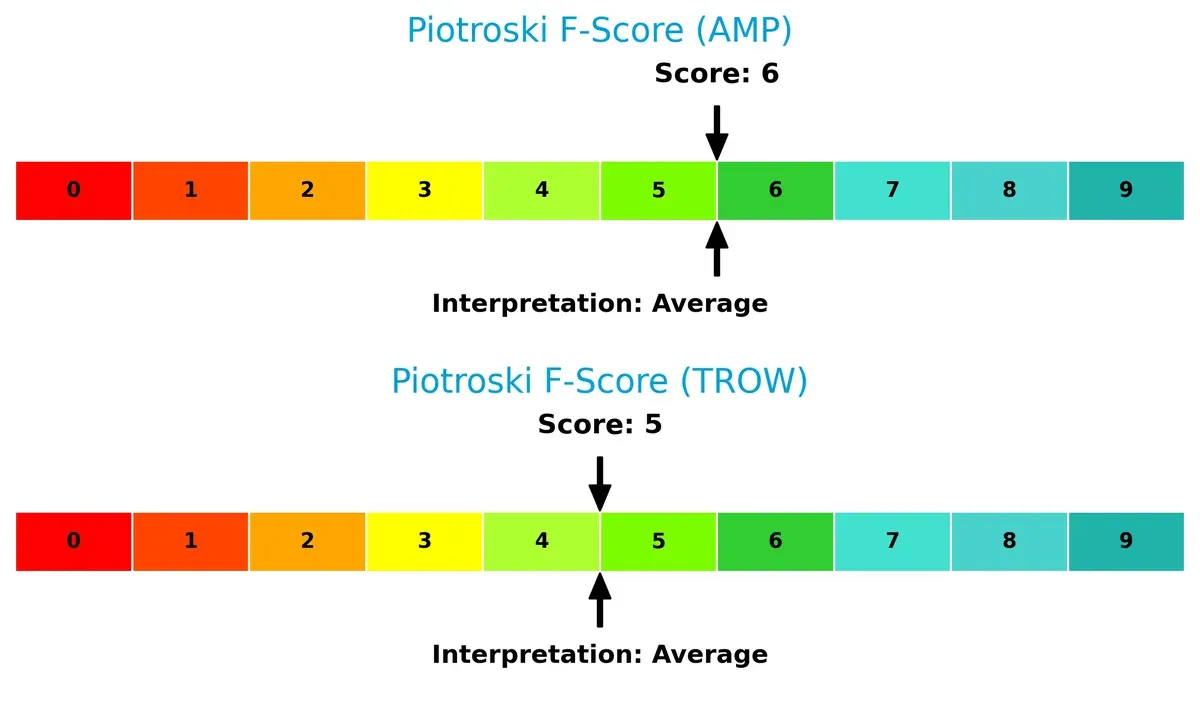
Financial Health: Quality of Operations
Ameriprise scores a 6 on the Piotroski F-Score versus T. Rowe Price’s 5, both in the average range, but Ameriprise shows marginally stronger internal financial health:
How are the two companies positioned?
This section dissects the operational DNA of Ameriprise Financial and T. Rowe Price by comparing their revenue distribution and internal dynamics. The goal is to confront their economic moats to identify which business model offers the most resilient competitive advantage today.
Revenue Segmentation: The Strategic Mix
This visual comparison dissects how Ameriprise Financial and T. Rowe Price Group diversify their income streams and where their primary sector bets lie:
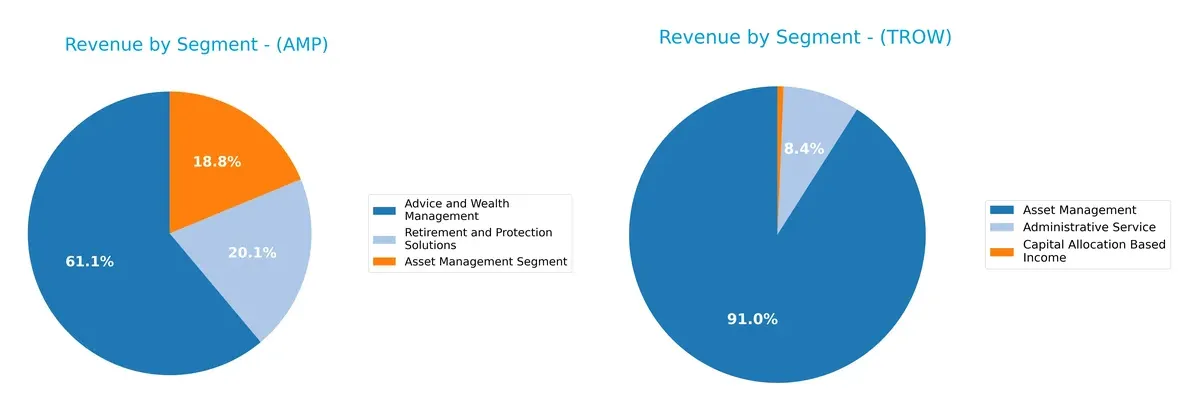
Ameriprise Financial anchors its revenue in Advice and Wealth Management with $11.4B, supported by Asset Management at $3.5B and Retirement Solutions at $3.8B. This mix shows moderate diversification across advisory and protection services. In contrast, T. Rowe Price relies heavily on Asset Management, generating $6.4B, with a smaller $588M Administrative Service segment. Ameriprise’s broader portfolio reduces concentration risk, while T. Rowe Price’s focus signals a strong moat in asset management but higher dependency on market cycles.
Strengths and Weaknesses Comparison
This table compares the Strengths and Weaknesses of Ameriprise Financial, Inc. (AMP) and T. Rowe Price Group, Inc. (TROW):
AMP Strengths
- Diverse revenue streams with Advice, Asset Management, and Retirement Solutions
- Strong profitability with ROIC 60.42% above WACC
- Favorable net margin of 18.83%
- Solid asset turnover of 1.96
- Interest coverage of 15.72 supports financial stability
TROW Strengths
- Highest net margin at 27.84% indicates strong profitability
- Favorable debt-to-equity ratio at 0 supports low leverage
- Interest coverage infinite, signaling excellent debt servicing
- Dividend yield of 4.96% adds shareholder value
- Consistent revenue from Asset Management and Administrative Services
AMP Weaknesses
- High debt to assets at 60.75% raises leverage concerns
- Unfavorable current and quick ratios suggest liquidity risks
- Dividend yield is zero, limiting income for investors
- Fixed asset turnover not favorable, indicating inefficient asset use
TROW Weaknesses
- Unfavorable ROE and ROIC metrics question capital efficiency
- Unfavorable asset and fixed asset turnover imply operational inefficiency
- Unavailable WACC data limits cost of capital assessment
- Unfavorable current and quick ratios highlight liquidity constraints
Despite both companies showing slightly favorable overall financial profiles, AMP carries higher leverage and liquidity risks, while TROW struggles with capital efficiency and asset utilization. These contrasting weaknesses suggest differing strategic priorities for financial management and operational improvement.
The Moat Duel: Analyzing Competitive Defensibility
A structural moat is the only shield protecting a company’s long-term profits from relentless competition erosion:
Ameriprise Financial, Inc.: Enduring Advice & Wealth Management Moat
Ameriprise leverages high switching costs via personalized financial advice, reflected in a very favorable ROIC 51% above WACC. Its expanding wealth management products deepen this moat in 2026.
T. Rowe Price Group, Inc.: Fund Management Expertise Facing Pressure
T. Rowe’s moat centers on fund management reputation, but declining ROIC signals eroding capital efficiency. Its lower market cap and flat revenue growth pose challenges for moat expansion.
Moat Strength: Personalized Advisory vs. Fund Brand Resilience
Ameriprise boasts a deeper moat with a robust, growing ROIC, while T. Rowe’s deteriorating returns undermine its competitive edge. Ameriprise stands better poised to defend market share in 2026.
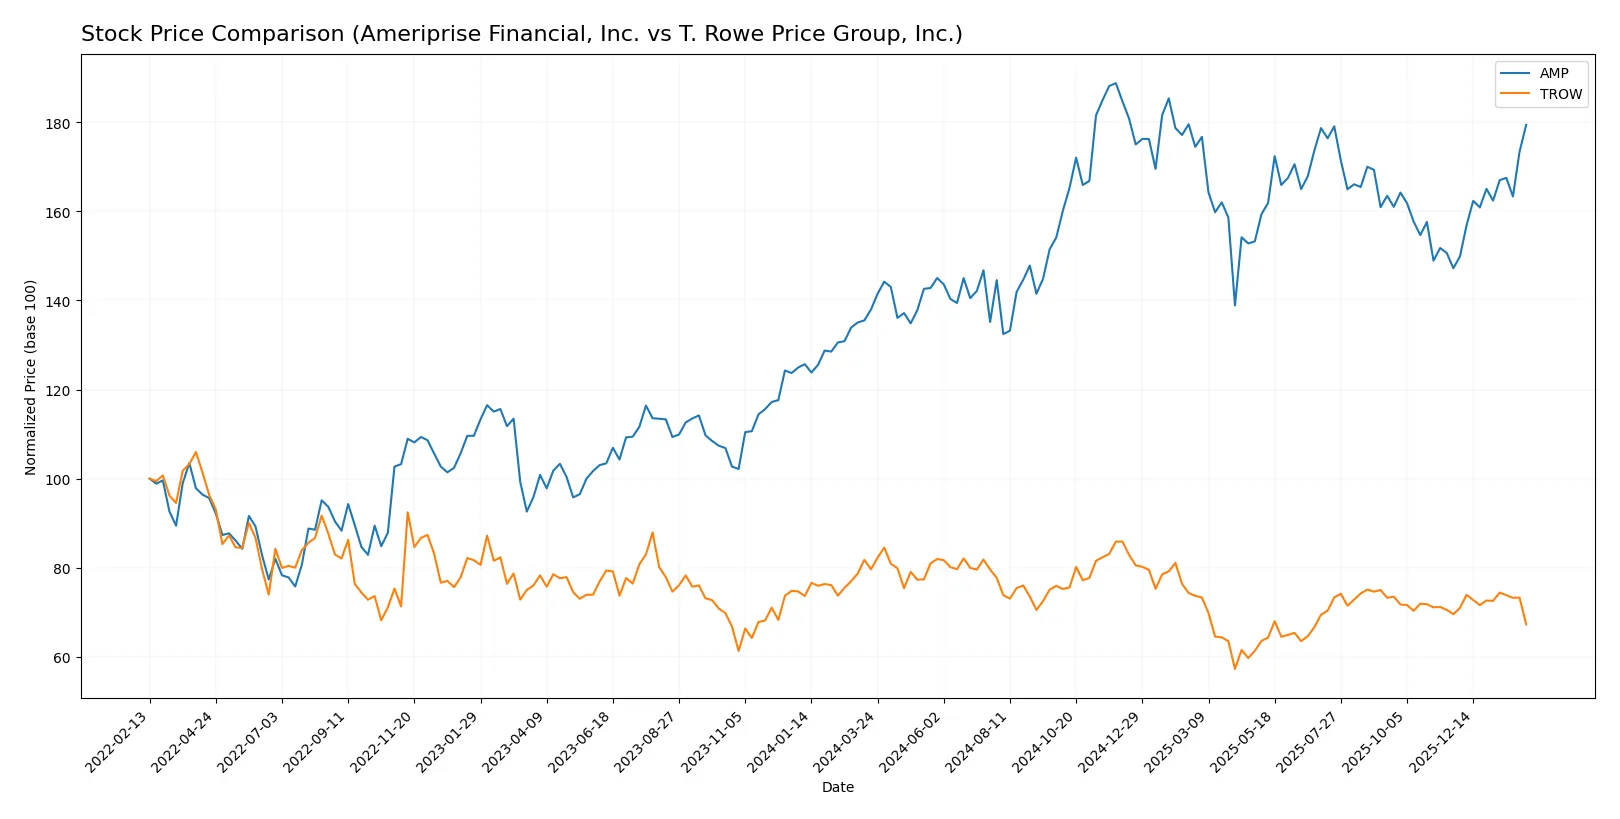
Which stock offers better returns?
The past year reveals starkly different price trajectories for Ameriprise Financial and T. Rowe Price, with AMP showing strong gains and TROW facing sustained declines.
Trend Comparison
Ameriprise Financial (AMP) shows a bullish trend with a 30.04% price increase over the past 12 months. The trend accelerates, reaching a high of 573.97 and a low of 402.61, with notable volatility (std deviation 44.85).
T. Rowe Price (TROW) exhibits a bearish trend, declining 15.53% over the same period. The trend also accelerates but remains negative, with a highest price of 123.84 and lowest of 82.6, and lower volatility (std deviation 8.83).
AMP outperforms TROW significantly, delivering the highest market returns amid accelerating bullish momentum, while TROW experiences persistent downward pressure.
Target Prices
Analysts present a balanced target price consensus for Ameriprise Financial and T. Rowe Price Group, reflecting moderate upside potential.
| Company | Target Low | Target High | Consensus |
|---|---|---|---|
| Ameriprise Financial, Inc. | 485 | 605 | 547.5 |
| T. Rowe Price Group, Inc. | 94 | 123 | 110.67 |
The target consensus for Ameriprise Financial sits slightly above its current price of 545.5, signaling modest growth expectations. T. Rowe Price’s consensus target at 110.67 implies a 14% upside from the current 97.02, indicating stronger analyst confidence.

Don’t Let Luck Decide Your Entry Point
Optimize your entry points with our advanced ProRealTime indicators. You’ll get efficient buy signals with precise price targets for maximum performance. Start outperforming now!
How do institutions grade them?
The following tables summarize recent institutional grades for Ameriprise Financial, Inc. and T. Rowe Price Group, Inc.:
Ameriprise Financial, Inc. Grades
This table shows recent grades from reputable financial institutions for Ameriprise Financial, Inc.
| Grading Company | Action | New Grade | Date |
|---|---|---|---|
| Jefferies | Maintain | Buy | 2026-02-02 |
| RBC Capital | Maintain | Outperform | 2026-02-02 |
| Piper Sandler | Upgrade | Neutral | 2026-01-30 |
| Morgan Stanley | Maintain | Underweight | 2025-12-22 |
| Argus Research | Maintain | Buy | 2025-11-13 |
| Keefe, Bruyette & Woods | Maintain | Market Perform | 2025-11-03 |
| RBC Capital | Maintain | Outperform | 2025-11-03 |
| Evercore ISI Group | Maintain | In Line | 2025-10-09 |
| Morgan Stanley | Maintain | Underweight | 2025-10-01 |
| RBC Capital | Maintain | Outperform | 2025-07-30 |
T. Rowe Price Group, Inc. Grades
This table presents recent grades from established financial firms for T. Rowe Price Group, Inc.
| Grading Company | Action | New Grade | Date |
|---|---|---|---|
| Keefe, Bruyette & Woods | Maintain | Market Perform | 2026-02-05 |
| Morgan Stanley | Maintain | Equal Weight | 2026-02-03 |
| JP Morgan | Maintain | Underweight | 2026-01-20 |
| Barclays | Maintain | Underweight | 2026-01-15 |
| TD Cowen | Maintain | Hold | 2026-01-14 |
| Keefe, Bruyette & Woods | Maintain | Market Perform | 2025-12-17 |
| Morgan Stanley | Maintain | Equal Weight | 2025-12-17 |
| Barclays | Maintain | Underweight | 2025-12-12 |
| Evercore ISI Group | Maintain | In Line | 2025-12-05 |
| Keefe, Bruyette & Woods | Maintain | Market Perform | 2025-11-03 |
Which company has the best grades?
Ameriprise Financial, Inc. has generally stronger grades, including multiple “Buy” and “Outperform” ratings. T. Rowe Price Group, Inc. mostly receives “Market Perform,” “Equal Weight,” and “Underweight” grades. This difference may influence investor confidence and perceived upside potential.
Risks specific to each company
The following categories identify the critical pressure points and systemic threats facing both firms in the 2026 market environment:
1. Market & Competition
Ameriprise Financial, Inc.
- Faces intense competition from diversified asset managers with broad service offerings.
T. Rowe Price Group, Inc.
- Experiences pressure from global asset managers and increasing passive investment trends.
2. Capital Structure & Debt
Ameriprise Financial, Inc.
- Debt-to-assets ratio at 60.75% signals high leverage risk despite favorable interest coverage.
T. Rowe Price Group, Inc.
- Virtually no debt, reflecting a strong balance sheet and lower financial risk.
3. Stock Volatility
Ameriprise Financial, Inc.
- Beta of 1.25 indicates moderate volatility aligned with industry norms.
T. Rowe Price Group, Inc.
- Higher beta at 1.55 suggests greater sensitivity to market swings and elevated risk.
4. Regulatory & Legal
Ameriprise Financial, Inc.
- Subject to stringent US financial regulations and evolving fiduciary standards.
T. Rowe Price Group, Inc.
- Faces complex international regulations due to global operations, increasing compliance costs.
5. Supply Chain & Operations
Ameriprise Financial, Inc.
- Operational risks include technology dependence and integration of diverse service lines.
T. Rowe Price Group, Inc.
- Operates with leaner staff and global reach, exposing it to operational complexity and talent retention challenges.
6. ESG & Climate Transition
Ameriprise Financial, Inc.
- ESG initiatives are growing but face pressure to align with evolving investor expectations.
T. Rowe Price Group, Inc.
- Strong focus on socially responsible investing, which may limit some investment flexibility.
7. Geopolitical Exposure
Ameriprise Financial, Inc.
- Primarily US-centric but exposed to international market volatility.
T. Rowe Price Group, Inc.
- Broad global footprint increases exposure to geopolitical tensions and regulatory shifts.
Which company shows a better risk-adjusted profile?
Ameriprise’s highest risk lies in its elevated leverage, which could amplify downturn shocks. T. Rowe Price faces significant market volatility and geopolitical risks due to its global presence. Overall, Ameriprise offers a marginally better risk-adjusted profile, supported by robust profitability and a safer Altman Z-score of 7.68 versus T. Rowe’s 5.04. However, Ameriprise’s high debt-to-assets ratio remains a red flag that investors must monitor closely.
Final Verdict: Which stock to choose?
Ameriprise Financial, Inc. (AMP) wields an impressive superpower in capital efficiency, consistently generating returns well above its cost of capital. This robust value creation signals a durable competitive edge. However, its elevated leverage and stretched liquidity ratios remain points of vigilance. AMP suits investors seeking aggressive growth with a tolerance for balance sheet risk.
T. Rowe Price Group, Inc. (TROW) benefits from a strategic moat rooted in recurring revenue streams and disciplined cost management, enhancing its safety profile. Its lower debt levels and stable dividend appeal to conservative investors. Relative to AMP, TROW offers better stability, fitting well into GARP (Growth at a Reasonable Price) portfolios.
If you prioritize dynamic capital efficiency and growth potential, Ameriprise Financial outshines as the compelling choice due to its superior ROIC and expanding profitability. However, if you seek steadier income with lower financial risk, T. Rowe Price offers better stability and a resilient moat, despite recent profitability headwinds. Each fits distinct investor profiles, underscoring the importance of aligning choice with risk tolerance and investment horizon.
Disclaimer: Investment carries a risk of loss of initial capital. The past performance is not a reliable indicator of future results. Be sure to understand risks before making an investment decision.
Go Further
I encourage you to read the complete analyses of Ameriprise Financial, Inc. and T. Rowe Price Group, Inc. to enhance your investment decisions: