Home > Comparison > Financial Services > AMP vs STT
The strategic rivalry between Ameriprise Financial, Inc. and State Street Corporation shapes the asset management industry’s evolution. Ameriprise operates as a diversified wealth manager with a retail focus, while State Street dominates institutional servicing and custody solutions. This head-to-head contrasts Ameriprise’s advice-driven growth model against State Street’s scale-driven efficiency. This analysis aims to identify which corporate trajectory offers superior risk-adjusted returns for a diversified portfolio navigating today’s financial services landscape.

Table of contents
Companies Overview
Ameriprise Financial and State Street Corporation stand as pivotal players in the US asset management sector.
Ameriprise Financial, Inc.: Holistic Wealth Management Leader
Ameriprise dominates as a diversified financial services provider focused on wealth management. Its core revenue stems from advice, asset management, and retirement solutions targeting individuals and institutions. In 2026, Ameriprise sharpens its strategic focus on integrated financial planning and insurance products to deepen client relationships.
State Street Corporation: Institutional Asset Servicing Powerhouse
State Street operates as a global institutional asset manager and custodian emphasizing investment servicing and portfolio management. Its revenue engine revolves around custody, risk analytics, and trading services for institutional clients worldwide. The firm prioritizes enhancing data-driven solutions and ESG investing strategies in 2026 to capture growing fiduciary demands.
Strategic Collision: Similarities & Divergences
Both firms excel in asset management but differ fundamentally in client focus and service scope. Ameriprise leans towards a retail-centric, advisory-driven model while State Street champions a vast institutional servicing infrastructure. Their battleground centers on capturing assets through tailored advice versus scalable institutional platforms. This contrast defines distinct investment profiles shaped by client segmentation and operational complexity.
Income Statement Comparison
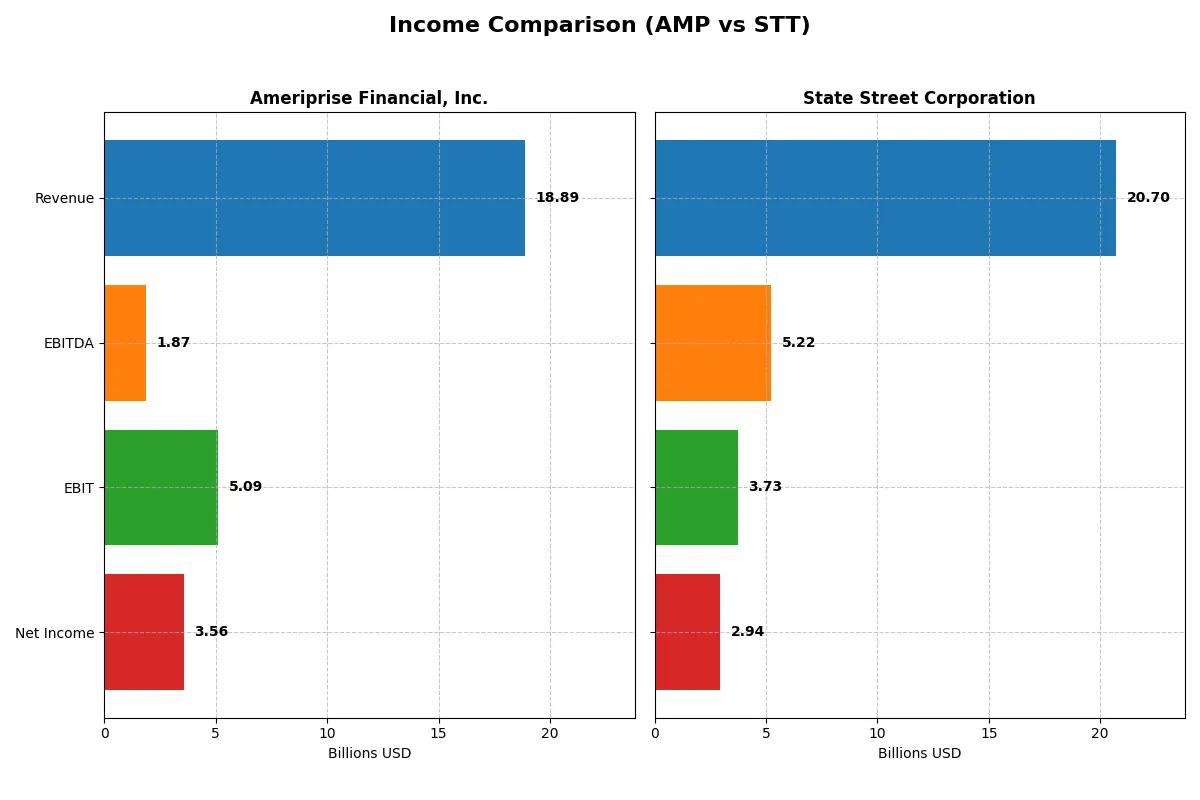
This data dissects the core profitability and scalability of both corporate engines to reveal who dominates the bottom line:
| Metric | Ameriprise Financial, Inc. (AMP) | State Street Corporation (STT) |
|---|---|---|
| Revenue | 18.9B | 20.7B |
| Cost of Revenue | 8.7B | 6.8B |
| Operating Expenses | 5.1B | 10.2B |
| Gross Profit | 10.2B | 13.9B |
| EBITDA | 1.9B | 5.2B |
| EBIT | 5.1B | 3.7B |
| Interest Expense | 324M | 8.7B |
| Net Income | 3.6B | 2.9B |
| EPS | 36.9 | 9.6 |
| Fiscal Year | 2025 | 2025 |
Income Statement Analysis: The Bottom-Line Duel
This income statement comparison reveals how Ameriprise Financial and State Street sharpen their operational efficiency and profitability engines.
Ameriprise Financial, Inc. Analysis
Ameriprise’s revenue climbed steadily from $13.4B in 2021 to $18.9B in 2025, showing a solid 41% growth over five years. Net income rose modestly to $3.56B in 2025 with a healthy net margin near 19%. However, EBIT slipped 21% in the latest year, signaling margin pressure despite stable revenue momentum.
State Street Corporation Analysis
State Street’s revenue expanded from $12.0B in 2021 to $20.7B in 2025, a robust 72% increase. Net income reached $2.95B with a 14.2% net margin, reflecting solid profitability. EBIT grew nearly 10% year-over-year, showing improving operational leverage despite a high and unfavorable 42% interest expense ratio.
Margin Power vs. Revenue Scale
Ameriprise demonstrates stronger net margins and better interest expense control, while State Street outpaces in revenue and EBIT growth. Ameriprise’s disciplined margin profile offers steadier profits. State Street’s scale and earnings momentum appeal to growth-focused investors. Ultimately, the choice hinges on preference for margin strength or top-line expansion.
Financial Ratios Comparison
These vital ratios act as a diagnostic tool to expose the underlying fiscal health, valuation premiums, and capital efficiency of each company:
| Ratios | Ameriprise Financial, Inc. (AMP) | State Street Corporation (STT) |
|---|---|---|
| ROE | 65.1% | 10.6% |
| ROIC | 2.8% | 2.7% |
| P/E | 15.8x | 12.3x |
| P/B | 10.3x | 1.30x |
| Current Ratio | 107.2 | 3.59 |
| Quick Ratio | 107.2 | 3.59 |
| D/E (Debt-to-Equity) | 1.05 | 1.07 |
| Debt-to-Assets | 3.0% | 8.1% |
| Interest Coverage | 19.6x | 0.43x |
| Asset Turnover | 0.10 | 0.06 |
| Fixed Asset Turnover | 0.00 | 6.52 |
| Payout ratio | 16.9% | 29.7% |
| Dividend yield | 1.07% | 2.42% |
| Fiscal Year | 2025 | 2025 |
Efficiency & Valuation Duel: The Vital Signs
Financial ratios act as a company’s DNA, revealing hidden risks and operational excellence beyond headline figures.
Ameriprise Financial, Inc.
Ameriprise exhibits robust profitability with a 54.41% ROE and 18.83% net margin, signaling efficiency. Its valuation metrics remain favorable, with no P/E concerns. Despite a lack of dividends, it drives shareholder value through strong capital returns, underpinned by high ROIC at 60.42%. Debt structure poses moderate caution with a 60.75% debt-to-assets ratio.
State Street Corporation
State Street shows moderate profitability, with a 10.58% ROE and a 14.23% net margin. Its P/E ratio of 12.27 and P/B of 1.3 indicate reasonable valuation. The company delivers shareholder returns via a 2.42% dividend yield. However, its low ROIC at 2.72% and high WACC of 16.53% suggest efficiency challenges and higher capital costs.
Operational Strength vs. Balanced Yield
Ameriprise dominates in profitability and capital efficiency but carries higher leverage risks. State Street offers stable dividends and a more conservative debt profile yet struggles with operational returns. Investors seeking growth and operational excellence may favor Ameriprise, while those prioritizing income and moderate risk might prefer State Street.
Which one offers the Superior Shareholder Reward?
I find Ameriprise Financial (AMP) favors growth over dividends, paying a modest 1.07% yield with a low 17% payout ratio and strong free cash flow coverage near 97%. It repurchases shares aggressively, fueling long-term capital appreciation. State Street (STT) delivers a higher 2.42% dividend yield but with a riskier payout near 30%, weaker free cash flow metrics, and less consistent buyback activity. Historically in financial services, sustainable shareholder rewards blend dividends and buybacks. AMP’s balanced, cash-backed buyback strategy offers a more durable total return profile than STT’s higher but less covered yield. I prefer AMP for superior, sustainable shareholder reward in 2026.
Comparative Score Analysis: The Strategic Profile
The radar chart reveals the fundamental DNA and strategic trade-offs of Ameriprise Financial and State Street Corporation:
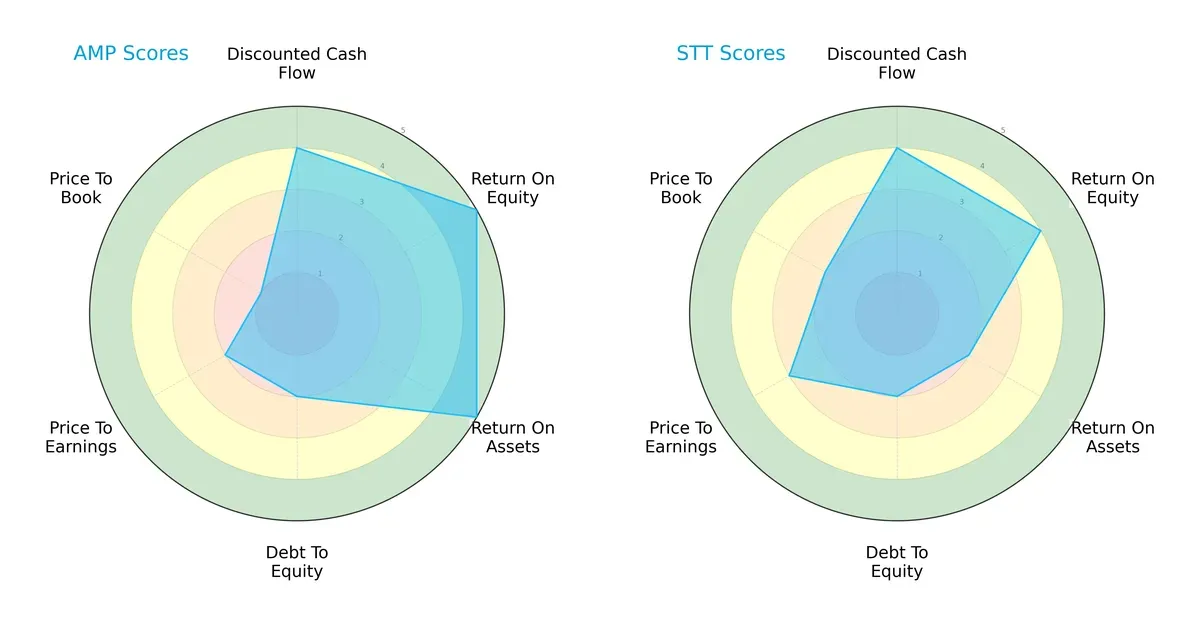
Ameriprise excels in profitability with top ROE (5) and ROA (5) scores, signaling efficient capital use. State Street shows moderate profitability (ROE 4, ROA 2) but slightly better valuation metrics (P/E 3 vs. 2 and P/B 2 vs. 1). Both share moderate debt profiles (Debt/Equity 2), but Ameriprise’s valuation scores lag, indicating potential overvaluation. Overall, Ameriprise offers a sharper profitability edge, while State Street presents a more balanced valuation stance.
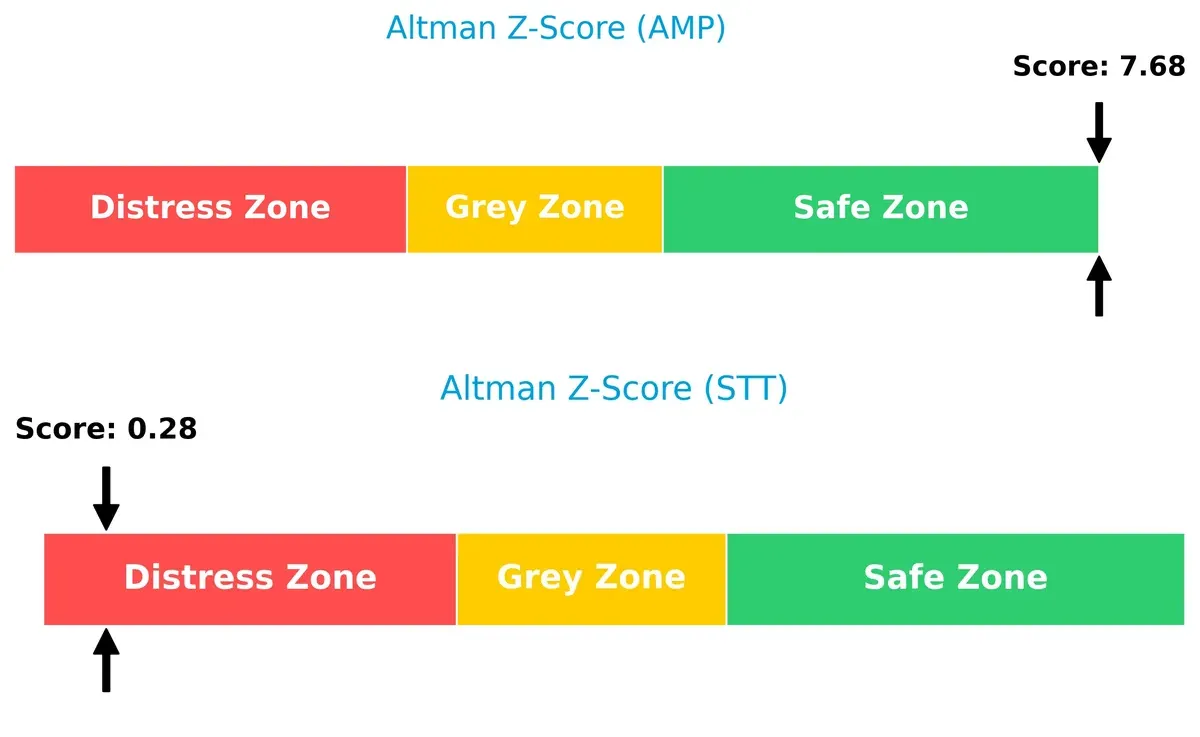
Bankruptcy Risk: Solvency Showdown
Ameriprise’s Altman Z-Score (7.68) vastly outperforms State Street’s (0.28), implying Ameriprise occupies a very safe zone while State Street faces significant bankruptcy risk in this cycle:
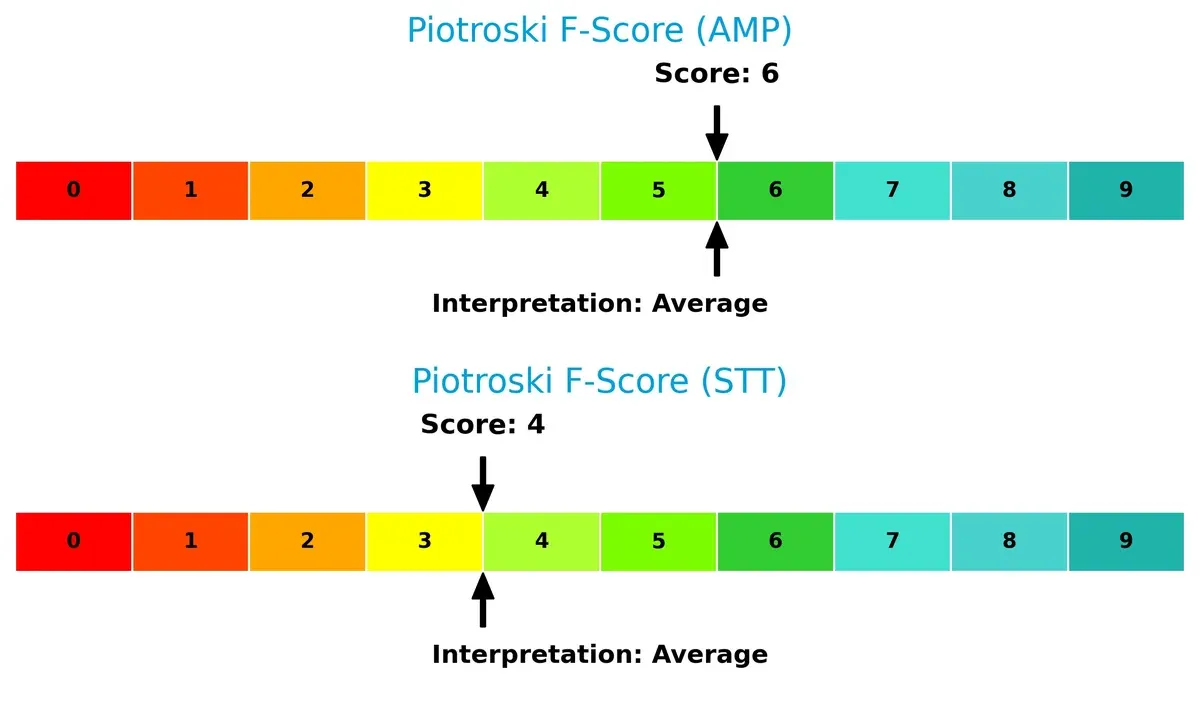
Financial Health: Quality of Operations
Ameriprise scores a stronger Piotroski F-Score (6) compared to State Street’s moderate 4, indicating Ameriprise maintains healthier internal financial metrics and fewer red flags:
How are the two companies positioned?
This section dissects Ameriprise and State Street’s operational DNA by comparing revenue distribution and internal strengths and weaknesses. The goal is to confront their economic moats to identify which model offers the most resilient competitive advantage today.
Revenue Segmentation: The Strategic Mix
This visual comparison dissects how Ameriprise Financial and State Street diversify their income streams and where their primary sector bets lie:
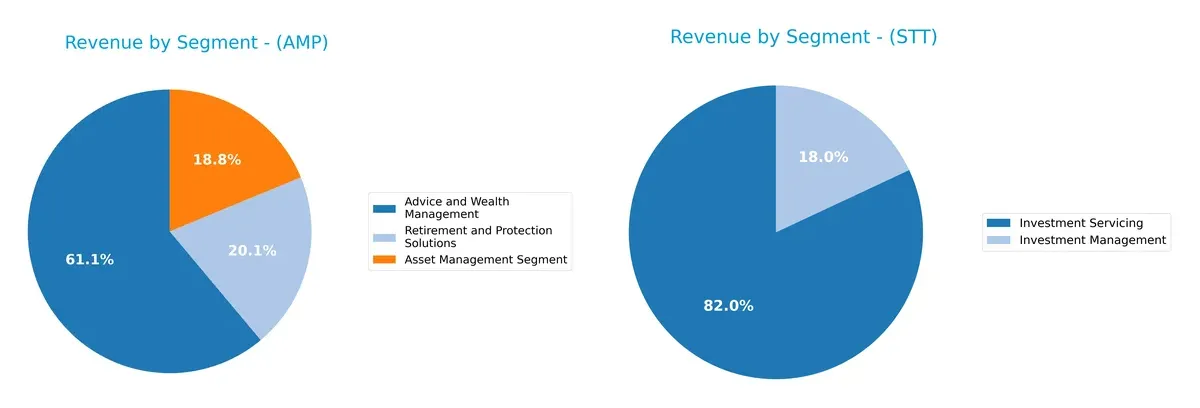
Ameriprise anchors its revenue in Advice and Wealth Management with $11.4B, supported by Asset Management at $3.5B and Retirement Solutions at $3.8B, reflecting a balanced diversification. State Street dwarfs with $10.7B from Investment Servicing, while Investment Management lags at $2.3B, signaling heavy reliance on servicing infrastructure. Ameriprise’s mix reduces concentration risk; State Street’s dominance suggests ecosystem lock-in but higher segment dependency.
Strengths and Weaknesses Comparison
This table compares the Strengths and Weaknesses of Ameriprise Financial, Inc. and State Street Corporation:
Ameriprise Financial Strengths
- Strong profitability with 18.83% net margin
- High ROE at 54.41%
- Robust ROIC at 60.42%
- Favorable PE and PB ratios
- Solid asset turnover of 1.96
State Street Strengths
- Favorable net margin at 14.23%
- Reasonable PE at 12.27 and PB at 1.3
- Strong fixed asset turnover of 6.52
- Positive quick ratio of 3.59
- Dividend yield of 2.42%
Ameriprise Financial Weaknesses
- Unfavorable current and quick ratios
- High debt-to-assets at 60.75%
- Unfavorable fixed asset turnover
- No dividend yield
- Moderate debt-to-equity at 0.9
State Street Weaknesses
- Low ROIC at 2.72% below WACC
- High WACC at 16.53%
- Weak interest coverage at 0.43
- Unfavorable asset turnover of 0.06
- Debt-to-equity above 1.0
- Unfavorable current ratio
Ameriprise exhibits strong profitability metrics but carries liquidity and leverage concerns. State Street shows operational strengths in asset efficiency and dividend yield but faces challenges in capital efficiency and liquidity. These profiles suggest contrasting strategic priorities regarding financial health and growth.
The Moat Duel: Analyzing Competitive Defensibility
A structural moat is the only shield protecting long-term profits from relentless competition’s erosion. Let’s dissect the moats of two asset managers:
Ameriprise Financial, Inc.: Durable Value Creator with Advice-Led Moat
Ameriprise leverages strong intangible assets through trusted financial advice, showing a soaring ROIC 51% above WACC. Its diverse wealth management deepens this moat amid 2026 market shifts.
State Street Corporation: Scale-Driven Custody and Data Moat
State Street relies on cost advantages and scale economies in institutional custody. Yet, its ROIC trails WACC, signaling shrinking competitive returns. Expansion into ESG and analytics could stabilize margins.
Moat Strength Showdown: Advice Trust vs. Institutional Scale
Ameriprise holds a deeper, more durable moat with growing profitability and value creation. State Street’s declining ROIC reveals vulnerability despite scale. Ameriprise is better positioned to defend market share long term.
Which stock offers better returns?
Over the past year, both Ameriprise Financial and State Street showed strong upward price movements, with notable acceleration in their trends and distinct volatility profiles.
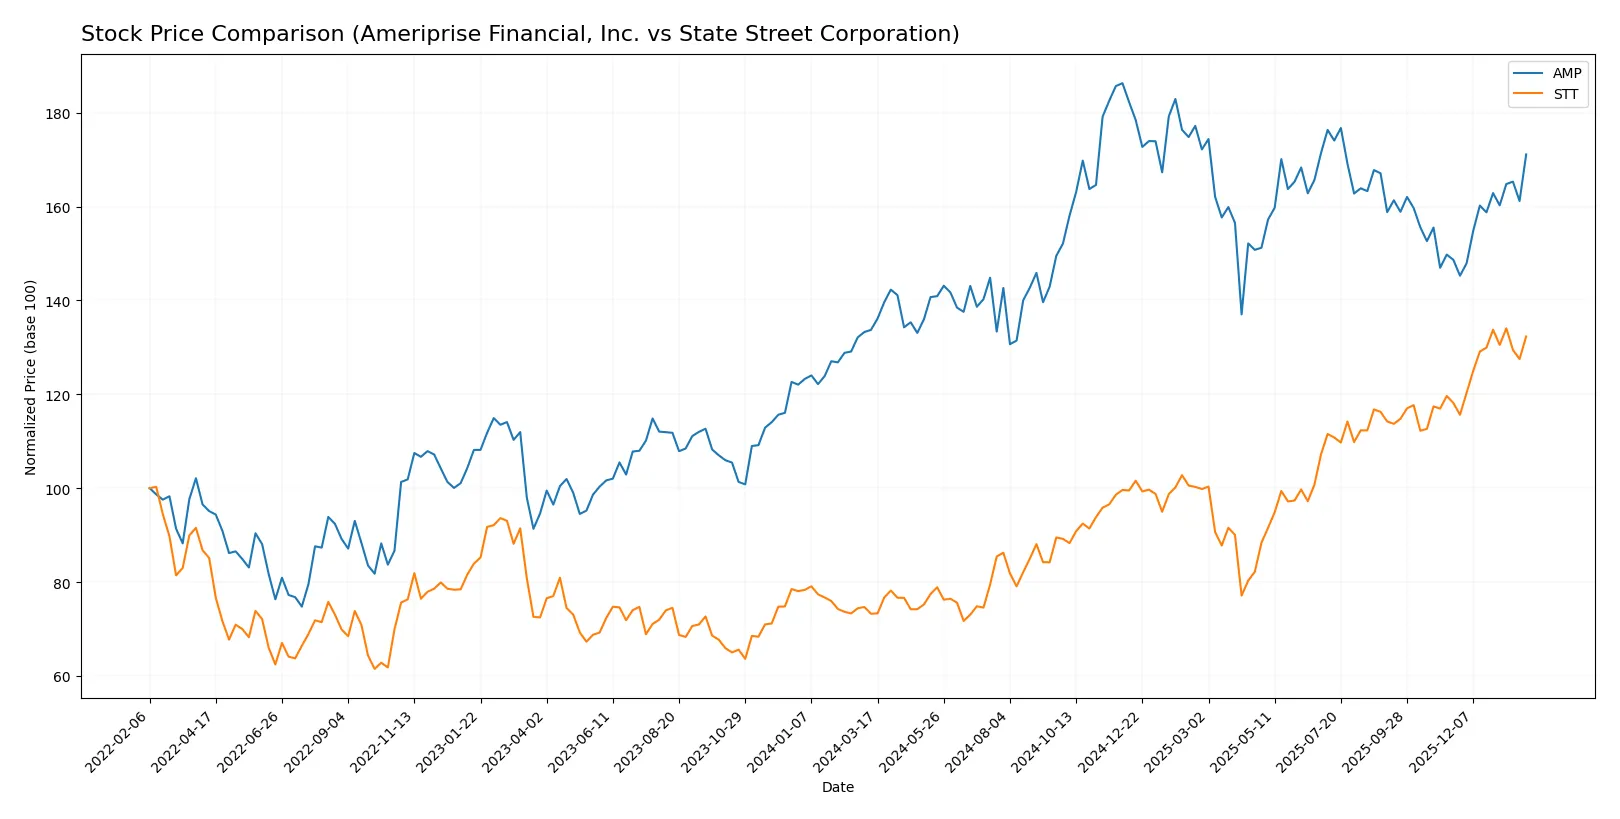
Trend Comparison
Ameriprise Financial’s stock rose 27.96% over the last 12 months, marking a bullish trend with accelerating momentum and a high price range between 403 and 574.
State Street’s stock surged 80.67% in the same period, also bullish with acceleration but lower volatility, ranging from 71 to 133.
State Street outperformed Ameriprise Financial, delivering the highest market return and steadier price appreciation during the analyzed year.
Target Prices
Analysts present a clear consensus with defined target ranges for both Ameriprise Financial and State Street Corporation.
| Company | Target Low | Target High | Consensus |
|---|---|---|---|
| Ameriprise Financial, Inc. | 485 | 570 | 528.33 |
| State Street Corporation | 128 | 164 | 142.17 |
The consensus target prices for Ameriprise Financial slightly exceed its current price of 527.19, indicating moderate upside potential. State Street’s consensus target is notably above its current price of 130.86, suggesting room for price appreciation.

Don’t Let Luck Decide Your Entry Point
Optimize your entry points with our advanced ProRealTime indicators. You’ll get efficient buy signals with precise price targets for maximum performance. Start outperforming now!
How do institutions grade them?
The following tables summarize recent institutional grades for Ameriprise Financial, Inc. and State Street Corporation:
Ameriprise Financial, Inc. Grades
This table shows the latest grades assigned by major analysts to Ameriprise Financial, Inc.
| Grading Company | Action | New Grade | Date |
|---|---|---|---|
| Piper Sandler | Upgrade | Neutral | 2026-01-30 |
| Morgan Stanley | Maintain | Underweight | 2025-12-22 |
| Argus Research | Maintain | Buy | 2025-11-13 |
| RBC Capital | Maintain | Outperform | 2025-11-03 |
| Keefe, Bruyette & Woods | Maintain | Market Perform | 2025-11-03 |
| Evercore ISI Group | Maintain | In Line | 2025-10-09 |
| Morgan Stanley | Maintain | Underweight | 2025-10-01 |
| RBC Capital | Maintain | Outperform | 2025-07-30 |
| Raymond James | Maintain | Strong Buy | 2025-07-25 |
| William Blair | Downgrade | Market Perform | 2025-07-25 |
State Street Corporation Grades
This table lists recent analyst grades for State Street Corporation from well-known firms.
| Grading Company | Action | New Grade | Date |
|---|---|---|---|
| Morgan Stanley | Maintain | Overweight | 2026-01-20 |
| Truist Securities | Downgrade | Hold | 2026-01-07 |
| TD Cowen | Maintain | Buy | 2026-01-07 |
| Barclays | Downgrade | Equal Weight | 2026-01-05 |
| Citigroup | Maintain | Buy | 2025-12-30 |
| Citigroup | Maintain | Buy | 2025-10-24 |
| Truist Securities | Maintain | Buy | 2025-10-20 |
| Wells Fargo | Maintain | Overweight | 2025-10-20 |
| Morgan Stanley | Maintain | Overweight | 2025-10-20 |
| Keefe, Bruyette & Woods | Maintain | Outperform | 2025-10-20 |
Which company has the best grades?
State Street Corporation received consistently stronger grades, including multiple “Buy” and “Overweight” ratings from top firms. Ameriprise shows more mixed signals, with several “Underweight” and “Market Perform” grades. Investors may interpret State Street’s better grades as greater analyst confidence, potentially supporting stronger market interest.
Risks specific to each company
The following categories identify the critical pressure points and systemic threats facing both firms in the 2026 market environment:
1. Market & Competition
Ameriprise Financial, Inc.
- Operates in diversified asset management with strong advice & wealth segment. Faces intense competition in wealth and institutional services.
State Street Corporation
- Focuses on institutional investment servicing and asset management with global reach. Competes heavily in custody and ETF markets.
2. Capital Structure & Debt
| Ameriprise Financial, Inc. | State Street Corporation | | Debt to assets high at 60.75%, indicating leverage risk despite solid interest coverage (15.72x). Debt-to-equity neutral at 0.9. | Low debt-to-assets at 8.14%, but interest coverage weak at 0.43x, signaling potential liquidity stress. Debt-to-equity at 1.07 is unfavorable. |
3. Stock Volatility
| Ameriprise Financial, Inc. | State Street Corporation | | Beta at 1.256 suggests moderate volatility aligned with sector averages. Price range relatively stable within $396-$552. | Higher beta of 1.448 indicates greater sensitivity to market swings. Wider trading volume suggests elevated volatility risk. |
4. Regulatory & Legal
| Ameriprise Financial, Inc. | State Street Corporation | | Operates under stringent US and international financial regulations; wealth management complexity adds compliance layers. | Faces extensive regulatory scrutiny globally due to custody and trading operations; compliance costs are significant and rising. |
5. Supply Chain & Operations
| Ameriprise Financial, Inc. | State Street Corporation | | Relies on technology infrastructure for advisory and asset management services; operational risk moderate but manageable. | Complex global operational network with higher exposure to technology and data management risks. |
6. ESG & Climate Transition
| Ameriprise Financial, Inc. | State Street Corporation | | Increasing ESG integration in investment products; transition risks manageable but pressure to innovate remains. | Strong focus on ESG investing and fiduciary solutions; exposed to reputational risk if ESG standards slip. |
7. Geopolitical Exposure
| Ameriprise Financial, Inc. | State Street Corporation | | Primarily US-focused with some international exposure; geopolitical risks moderate but could impact global asset management flows. | Broader international footprint increases exposure to geopolitical tensions and regulatory changes globally. |
Which company shows a better risk-adjusted profile?
Ameriprise’s most significant risk is its high leverage, raising capital structure concerns despite strong profitability. State Street’s critical vulnerability lies in weak interest coverage, threatening liquidity under stress. Ameriprise’s Z-score confirms robust financial health; State Street’s signals distress. Overall, Ameriprise exhibits a superior risk-adjusted profile, benefiting from stronger operational metrics and capital stability in a volatile 2026 environment.
Final Verdict: Which stock to choose?
Ameriprise Financial’s superpower lies in its exceptional capital efficiency and robust return on invested capital, signaling durable value creation. Its elevated debt levels warrant vigilance, especially in tightening credit markets. This stock suits investors aiming for aggressive growth with a tolerance for leverage risks.
State Street Corporation commands a strategic moat through its lower leverage and strong dividend yield, offering relative safety amid market fluctuations. However, its declining ROIC trend raises questions on long-term value creation. This name fits well with GARP investors prioritizing steady income and moderate growth.
If you prioritize capital efficiency and high returns, Ameriprise outshines due to its proven ability to create shareholder value despite leverage concerns. However, if you seek income stability and a conservative risk profile, State Street offers better stability with its safer balance sheet and dividend appeal. Both present distinct scenarios depending on your investment strategy.
Disclaimer: Investment carries a risk of loss of initial capital. The past performance is not a reliable indicator of future results. Be sure to understand risks before making an investment decision.
Go Further
I encourage you to read the complete analyses of Ameriprise Financial, Inc. and State Street Corporation to enhance your investment decisions: