Home > Comparison > Financial Services > AMP vs NTRS
The strategic rivalry between Ameriprise Financial, Inc. and Northern Trust Corporation shapes the competitive landscape of asset management. Ameriprise operates as a diversified financial services firm, blending wealth management with insurance solutions. Northern Trust focuses on specialized asset servicing and high-net-worth wealth management. This head-to-head pits broad market reach against niche expertise. This analysis will reveal which business model delivers superior risk-adjusted returns for a well-balanced portfolio.

Table of contents
Companies Overview
Ameriprise Financial and Northern Trust dominate the US asset management sector with distinct market footprints and service models.
Ameriprise Financial, Inc.: Integrated Wealth Management Powerhouse
Ameriprise stands as a diversified financial services firm focusing on advice, asset management, and retirement solutions. Its revenue primarily stems from advisory fees, mutual funds, and insurance products. In 2026, Ameriprise emphasizes expanding its Advice & Wealth Management segment, leveraging personalized financial planning to capture retail and institutional clients.
Northern Trust Corporation: Institutional Asset Servicing Leader
Northern Trust excels in asset servicing and wealth management, catering to corporations, institutions, and high-net-worth individuals. It generates income through custody, fund administration, and investment management services. In 2026, Northern Trust prioritizes enhancing its Asset Servicing segment, focusing on institutional clients with sophisticated risk management and alternative asset offerings.
Strategic Collision: Similarities & Divergences
Both firms operate in asset management but diverge in strategy: Ameriprise pursues a client-centric, advisory-driven model, while Northern Trust focuses on institutional asset servicing and custody. Their main marketplace clash occurs in wealth management for affluent clients. Ameriprise offers broader retail engagement, whereas Northern Trust targets institutional precision, defining two distinct investment profiles in this competitive landscape.
Income Statement Comparison
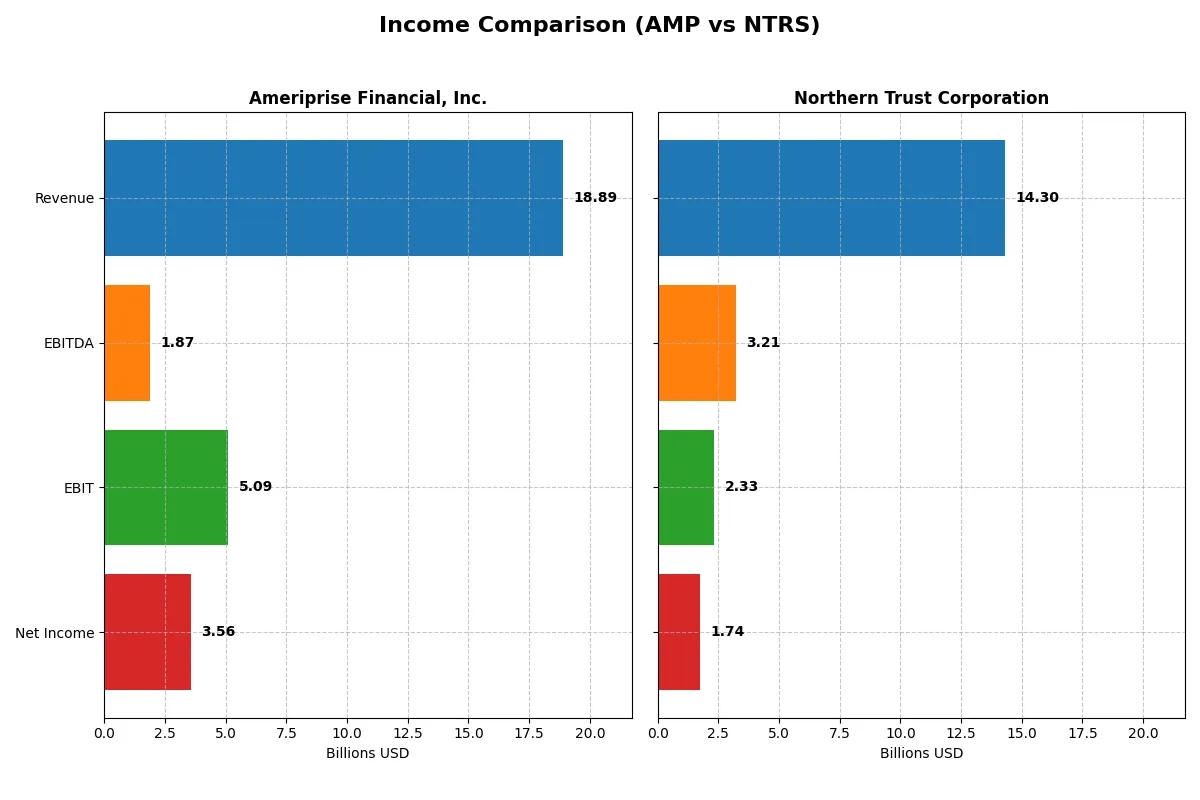
This data dissects the core profitability and scalability of both corporate engines to reveal who dominates the bottom line:
| Metric | Ameriprise Financial, Inc. (AMP) | Northern Trust Corporation (NTRS) |
|---|---|---|
| Revenue | 18.9B | 14.3B |
| Cost of Revenue | 8.7B | 6.2B |
| Operating Expenses | 5.1B | 5.8B |
| Gross Profit | 10.2B | 8.1B |
| EBITDA | 1.9B | 3.2B |
| EBIT | 5.1B | 2.3B |
| Interest Expense | 324M | 6.2B |
| Net Income | 3.6B | 1.7B |
| EPS | 36.9 | 8.8 |
| Fiscal Year | 2025 | 2025 |
Income Statement Analysis: The Bottom-Line Duel
This income statement comparison reveals each company’s efficiency in converting revenue into profit within a changing market environment.
Ameriprise Financial, Inc. Analysis
Ameriprise’s revenue climbed steadily from 13.4B in 2022 to 18.9B in 2025, reflecting solid top-line growth. Net income showed modest gains, peaking at 3.56B in 2025. Gross margin remains strong near 54%, with a net margin of 18.9%, signaling healthy profitability. Despite a 21% EBIT decline recently, EPS rose 10%, indicating operational resilience.
Northern Trust Corporation Analysis
Northern Trust posted a 14.3B revenue in 2025, down from 15.9B in 2024, marking recent contraction after robust growth since 2021. Net income fell to 1.74B in 2025, with gross margin steady at 56.5% but net margin compressing to 12.2%. EBIT and EPS declined over 10% last year, highlighting margin pressure amid elevated interest expenses.
Margin Strength vs. Growth Volatility
Ameriprise delivers superior net margin and a more consistent profit trajectory, despite some short-term EBIT softness. Northern Trust shows faster revenue growth over five years but struggles with margin erosion and recent profitability dips. Investors seeking stable earnings may favor Ameriprise’s efficiency profile over Northern Trust’s higher-growth yet volatile pattern.
Financial Ratios Comparison
These vital ratios act as a diagnostic tool to expose the underlying fiscal health, valuation premiums, and capital efficiency of these financial firms:
| Ratios | Ameriprise Financial, Inc. (AMP) | Northern Trust Corporation (NTRS) |
|---|---|---|
| ROE | 65.1% | 13.4% |
| ROIC | 2.8% | 5.0% |
| P/E | 15.8 | 14.7 |
| P/B | 10.3 | 2.0 |
| Current Ratio | 107.2 | 0.41 |
| Quick Ratio | 107.2 | 0.41 |
| D/E | 1.05 | 1.27 |
| Debt-to-Assets | 3.0% | 9.3% |
| Interest Coverage | 19.6 | 0.38 |
| Asset Turnover | 0.10 | 0.08 |
| Fixed Asset Turnover | 0 | 30.8 |
| Payout ratio | 16.9% | 33.5% |
| Dividend yield | 1.07% | 2.27% |
| Fiscal Year | 2025 | 2025 |
Efficiency & Valuation Duel: The Vital Signs
Financial ratios act as a company’s DNA, exposing hidden risks and operational strengths that drive investment decisions.
Ameriprise Financial, Inc.
Ameriprise boasts a stellar 54.4% ROE and 18.8% net margin, signaling strong profitability and operational efficiency. Its valuation metrics remain favorable despite limited price data. The firm prioritizes reinvestment over dividends, fueling growth through capital allocation. However, a high debt-to-assets ratio of 60.75% flags potential financial risk.
Northern Trust Corporation
Northern Trust shows moderate profitability with a 13.4% ROE and 12.2% net margin, reflecting steady but less dynamic returns. Its P/E of 14.75 suggests reasonable valuation. The company returns value via a 2.27% dividend yield, appealing to income-focused investors. Yet, weak liquidity ratios and interest coverage raise caution on financial stability.
Premium Profitability Battles Income Stability
Ameriprise leads with superior returns on equity and capital, though at the cost of higher leverage risk. Northern Trust offers a safer balance sheet and steady dividends but lags in efficiency. Growth investors may prefer Ameriprise’s operational strength, while income seekers might lean toward Northern Trust’s consistent payouts.
Which one offers the Superior Shareholder Reward?
Ameriprise Financial (AMP) opts for a balanced distribution with a modest 1.07% dividend yield and a 17% payout ratio, underpinned by strong free cash flow of $63.5/share fueling consistent dividends and buybacks. Northern Trust (NTRS) delivers a higher 2.27% yield but pays out 33% of earnings, with weaker free cash flow and less buyback activity. I observe AMP’s disciplined capital allocation and sustainable payout, coupled with active buybacks, position it for superior long-term shareholder returns compared to NTRS’s riskier, yield-focused model in 2026.
Comparative Score Analysis: The Strategic Profile
The radar chart reveals the fundamental DNA and trade-offs of Ameriprise Financial, Inc. and Northern Trust Corporation:
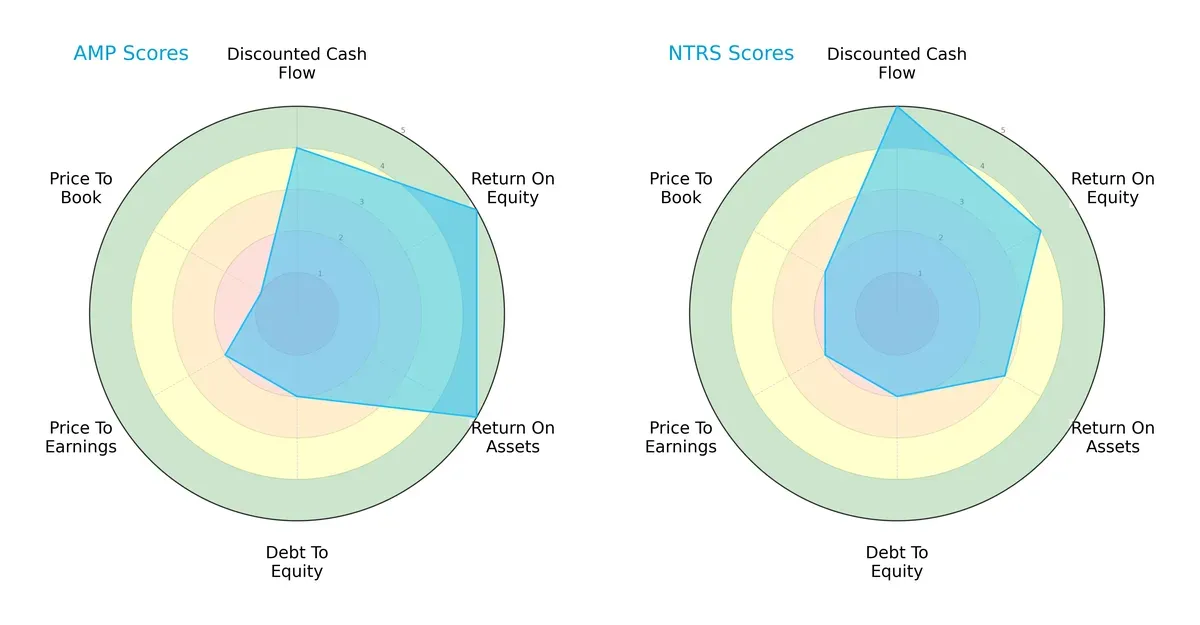
Ameriprise excels in operational efficiency with top ROE (5) and ROA (5) scores, showing strong profit generation and asset use. Northern Trust leads in discounted cash flow (5) and has a slightly better valuation balance with a higher price-to-book score (2 vs. 1). Both firms share moderate debt-to-equity and price-to-earnings scores (2). Ameriprise’s profile is more focused on operational strength, while Northern Trust presents a more balanced financial and valuation stance.
Bankruptcy Risk: Solvency Showdown
The Altman Z-Score delta signals a stark contrast in solvency for the current cycle:
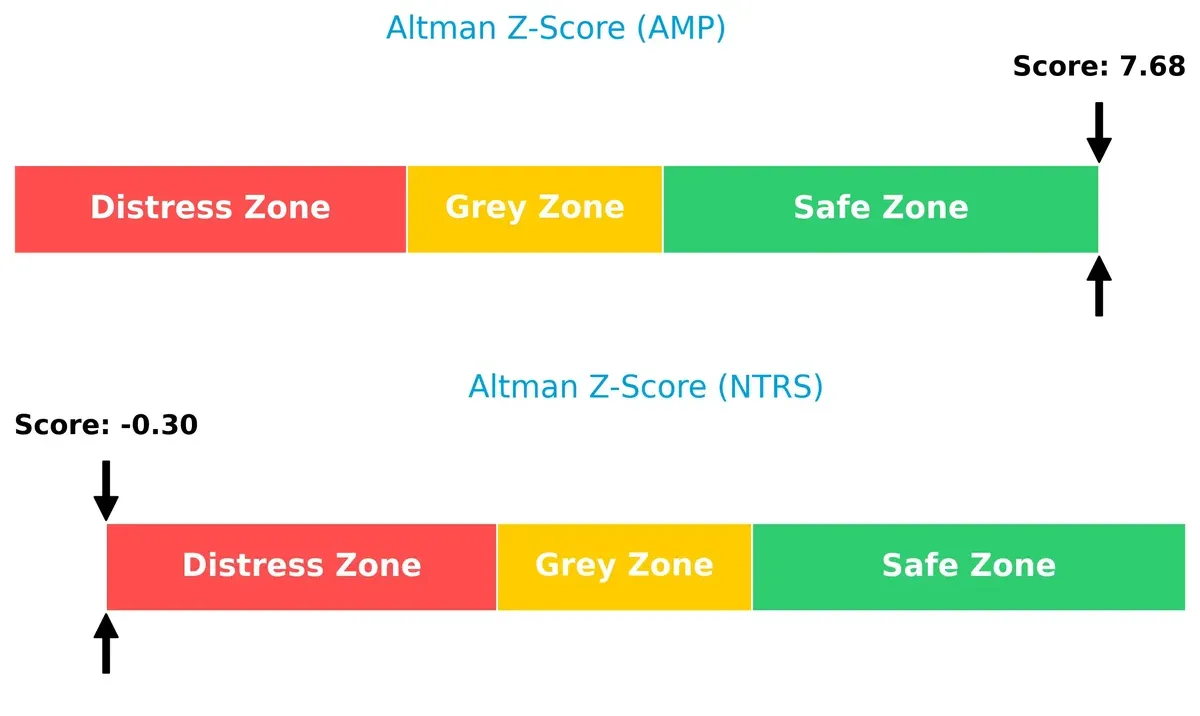
Ameriprise’s score of 7.68 places it securely in the safe zone, indicating low bankruptcy risk and robust financial stability. Northern Trust’s negative score (-0.30) lands in the distress zone, flagging significant solvency concerns and potential default risk. This divergence demands cautious risk management for Northern Trust investors despite its other strengths.
Financial Health: Quality of Operations
The Piotroski F-Score comparison exposes differences in internal financial quality:
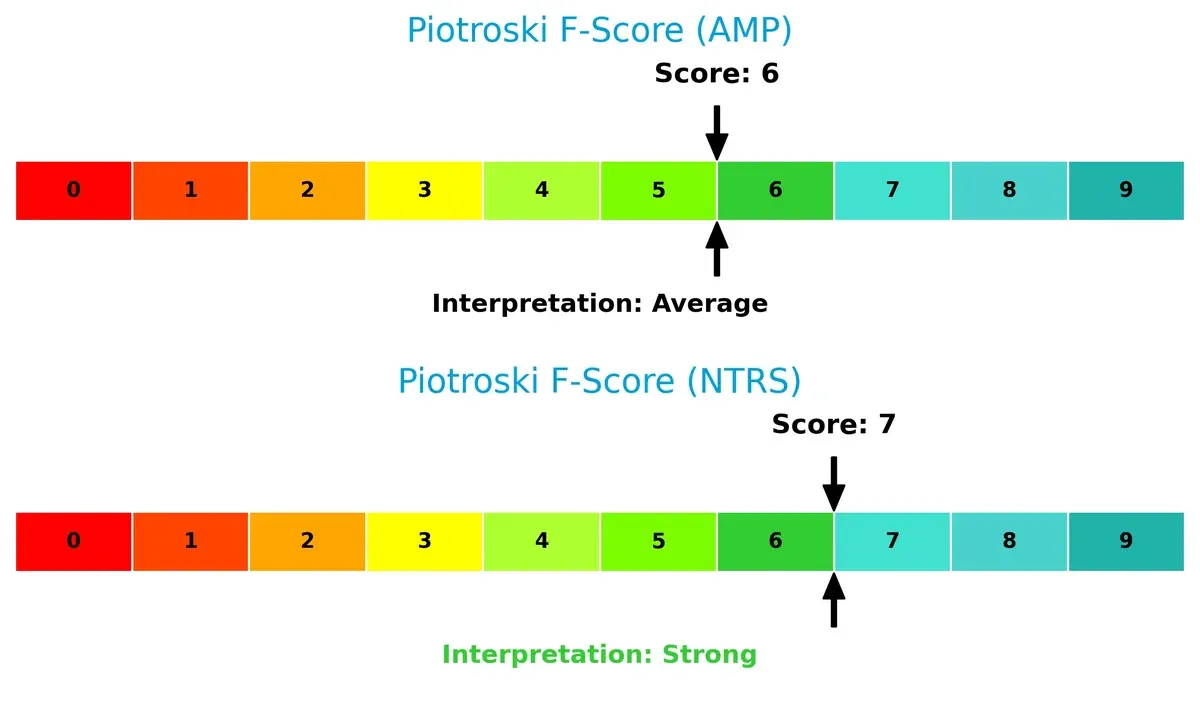
Northern Trust scores a strong 7, signaling solid internal financial health and operational quality. Ameriprise’s 6 is average, suggesting decent but less robust fundamentals. Neither shows glaring red flags, but Northern Trust edges ahead in quality metrics, reinforcing its operational discipline despite solvency challenges.
How are the two companies positioned?
This section dissects the operational DNA of Ameriprise Financial and Northern Trust by comparing their revenue distribution and internal dynamics. The goal is to confront their economic moats and reveal which model offers the most resilient competitive advantage today.
Revenue Segmentation: The Strategic Mix
This visual comparison dissects how Ameriprise Financial and Northern Trust diversify their income streams and where their primary sector bets lie:
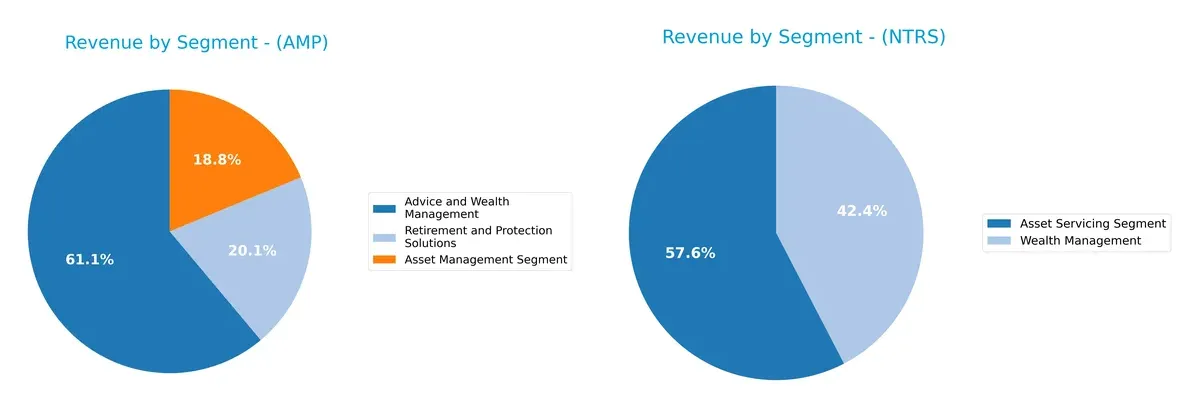
Ameriprise Financial anchors its revenue in Advice and Wealth Management at $11.4B, complemented by Asset Management ($3.5B) and Retirement Solutions ($3.8B). This mix shows solid diversification across advisory and protection services. Northern Trust, however, pivots heavily on Asset Servicing ($4.4B) and Wealth Management ($3.2B), revealing a more concentrated but complementary revenue base. Ameriprise’s broader segmentation reduces concentration risk, while Northern Trust leverages infrastructure dominance with focused expertise.
Strengths and Weaknesses Comparison
This table compares the Strengths and Weaknesses of Ameriprise Financial, Inc. and Northern Trust Corporation:
Ameriprise Financial Strengths
- Higher net margin at 18.83%
- Strong ROE of 54.41%
- Robust ROIC of 60.42%
- Favorable interest coverage at 15.72
- Diversified revenue streams across advice, asset management, and retirement
Northern Trust Strengths
- Favorable net margin at 12.15%
- Positive P/E ratio at 14.75
- Strong fixed asset turnover at 30.78
- Meaningful dividend yield of 2.27%
- Larger international revenue base with 2.24B non-US revenue
Ameriprise Financial Weaknesses
- Unfavorable current and quick ratios at 0
- High debt to assets at 60.75%
- No dividend yield
- Unfavorable debt-to-equity neutral at 0.9
- Fixed asset turnover reported as 0
Northern Trust Weaknesses
- Low current and quick ratios at 0.41
- Unfavorable debt-to-equity at 1.27
- Weak interest coverage at 0.38
- Low asset turnover at 0.08
- Higher WACC at 16.78%
Ameriprise stands out with superior profitability and diversified revenue but faces liquidity and leverage risks. Northern Trust offers stable dividends and strong asset utilization but struggles with liquidity, leverage, and cost of capital. These contrasts shape their strategic financial priorities.
The Moat Duel: Analyzing Competitive Defensibility
A structural moat is the only reliable shield protecting long-term profits from relentless competition and market disruption:
Ameriprise Financial, Inc.: Durable Value Creator via High ROIC
Ameriprise leverages a robust cost advantage and trusted advisory services, reflected in a 51% ROIC premium over WACC. Its growing profitability signals a durable moat, with new wealth management solutions poised to deepen this edge in 2026.
Northern Trust Corporation: Asset Servicing Network Under Pressure
Northern Trust’s moat rests on asset servicing scale and institutional trust, but a negative ROIC spread and declining margins reveal weakening capital efficiency. Market headwinds and interest cost pressures threaten its competitive positioning in 2026.
Cost Efficiency vs. Scale: Which Moat Holds Stronger?
Ameriprise’s expanding ROIC advantage trumps Northern Trust’s eroding returns and value destruction. I see Ameriprise as better equipped to defend and grow market share amid intensifying competition.
Which stock offers better returns?
The past year shows strong bullish momentum for both stocks, with notable price gains and distinct trading volume dynamics driving market interest.
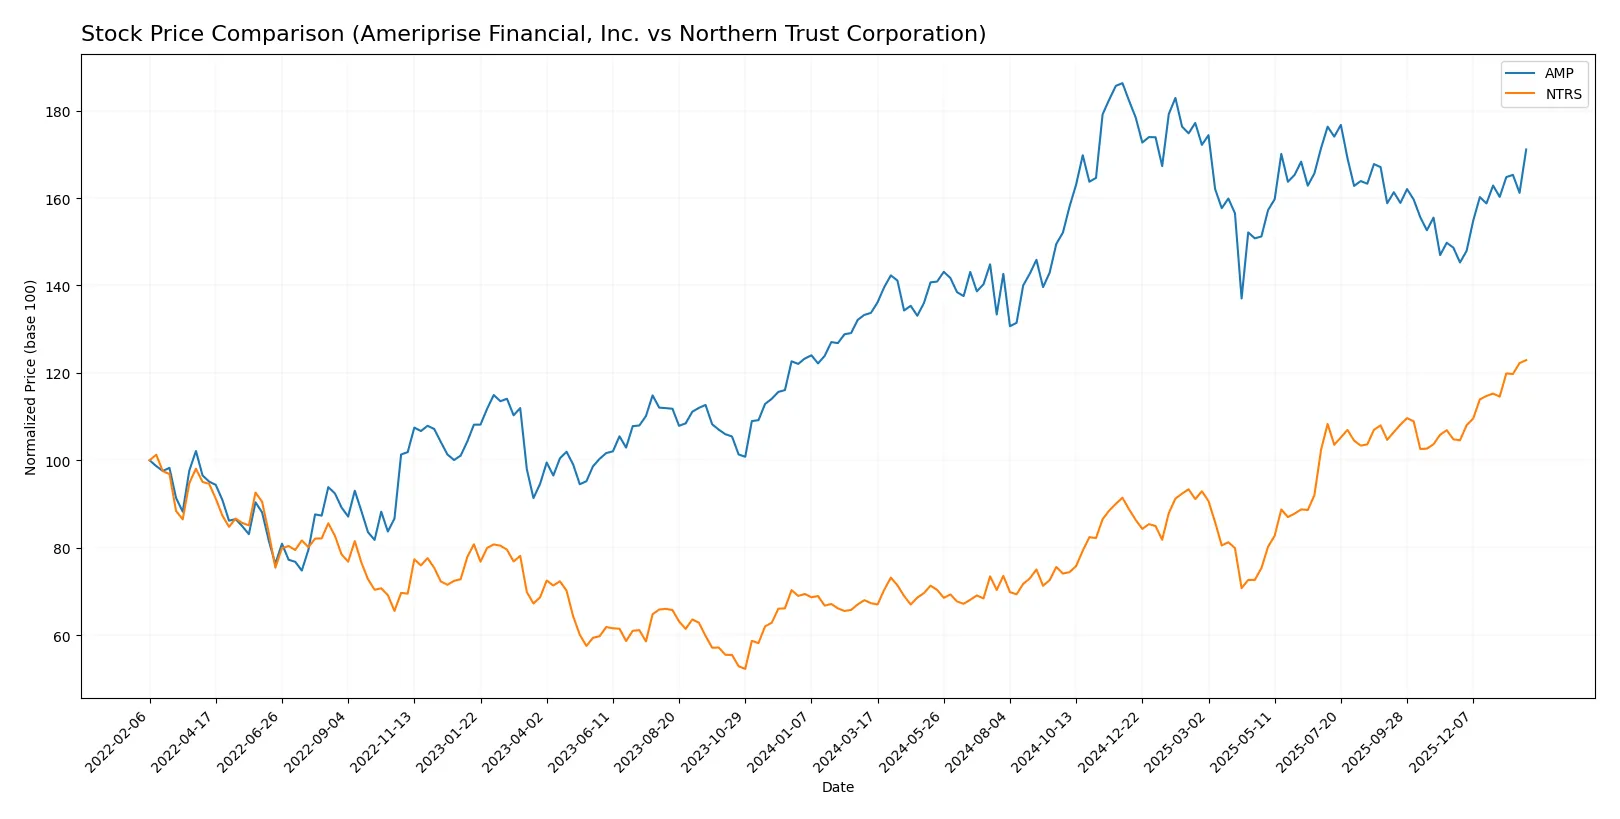
Trend Comparison
Ameriprise Financial, Inc. (AMP) posted a 27.96% price increase over 12 months, showing a clear bullish trend with accelerating gains. The stock ranged from 403 to 574, indicating high volatility (45.04 std deviation).
Northern Trust Corporation (NTRS) surged 82.65% in the same period, also bullish with acceleration. It traded between 81 and 149, experiencing lower volatility (19.71 std deviation) compared to AMP.
NTRS outperformed AMP substantially with a higher total return. Both show acceleration, but NTRS delivered the strongest market performance over the past year.
Target Prices
Analysts present a clear target price range for both Ameriprise Financial and Northern Trust, reflecting moderate upside potential.
| Company | Target Low | Target High | Consensus |
|---|---|---|---|
| Ameriprise Financial, Inc. | 485 | 570 | 528.33 |
| Northern Trust Corporation | 131 | 160 | 146.17 |
Overall, targets suggest Ameriprise shares trade near consensus, indicating limited immediate upside. Northern Trust’s price also aligns closely with analyst expectations.

Don’t Let Luck Decide Your Entry Point
Optimize your entry points with our advanced ProRealTime indicators. You’ll get efficient buy signals with precise price targets for maximum performance. Start outperforming now!
How do institutions grade them?
The following tables summarize the latest grades assigned by recognized financial institutions for the two companies:
Ameriprise Financial, Inc. Grades
This table shows recent grade updates and maintenances from reputable analysts for Ameriprise Financial.
| Grading Company | Action | New Grade | Date |
|---|---|---|---|
| Piper Sandler | Upgrade | Neutral | 2026-01-30 |
| Morgan Stanley | Maintain | Underweight | 2025-12-22 |
| Argus Research | Maintain | Buy | 2025-11-13 |
| RBC Capital | Maintain | Outperform | 2025-11-03 |
| Keefe, Bruyette & Woods | Maintain | Market Perform | 2025-11-03 |
| Evercore ISI Group | Maintain | In Line | 2025-10-09 |
| Morgan Stanley | Maintain | Underweight | 2025-10-01 |
| RBC Capital | Maintain | Outperform | 2025-07-30 |
| Raymond James | Maintain | Strong Buy | 2025-07-25 |
| William Blair | Downgrade | Market Perform | 2025-07-25 |
Northern Trust Corporation Grades
This table lists the current analyst grades and their actions for Northern Trust Corporation.
| Grading Company | Action | New Grade | Date |
|---|---|---|---|
| Goldman Sachs | Maintain | Sell | 2026-01-28 |
| Citigroup | Maintain | Neutral | 2026-01-28 |
| TD Cowen | Maintain | Buy | 2026-01-26 |
| Evercore ISI Group | Maintain | In Line | 2026-01-23 |
| RBC Capital | Maintain | Outperform | 2026-01-23 |
| Morgan Stanley | Maintain | Underweight | 2026-01-23 |
| Wells Fargo | Maintain | Equal Weight | 2026-01-23 |
| TD Cowen | Maintain | Buy | 2026-01-07 |
| Barclays | Maintain | Equal Weight | 2026-01-05 |
| Citigroup | Maintain | Neutral | 2025-12-30 |
Which company has the best grades?
Ameriprise Financial holds a broader range of positive ratings, including Strong Buy and Outperform, versus Northern Trust’s mix of Buy and Neutral grades alongside a Sell rating. This diversity suggests Ameriprise may attract investors seeking higher conviction, while Northern Trust’s grades indicate more cautious market sentiment.
Risks specific to each company
The following categories identify the critical pressure points and systemic threats facing both firms in the 2026 market environment:
1. Market & Competition
Ameriprise Financial, Inc.
- Strong net margin (18.83%) and ROIC (60.42%) indicate competitive efficiency. Faces intense asset management rivalry.
Northern Trust Corporation
- Lower net margin (12.15%) and ROIC (5.04%) suggest pressure on profitability amid competitive wealth management landscape.
2. Capital Structure & Debt
Ameriprise Financial, Inc.
- Debt-to-assets high at 60.75%, signaling leverage risk despite solid interest coverage (15.72x).
Northern Trust Corporation
- Debt-to-assets low at 9.27%, but high debt-to-equity (1.27) and poor interest coverage (0.38x) raise solvency concerns.
3. Stock Volatility
Ameriprise Financial, Inc.
- Beta of 1.256 denotes moderate market sensitivity, slightly below sector peers.
Northern Trust Corporation
- Slightly higher beta (1.285) implies marginally greater stock price volatility.
4. Regulatory & Legal
Ameriprise Financial, Inc.
- Operates across multiple financial product lines, increasing regulatory complexity risk.
Northern Trust Corporation
- Broad institutional client base subjects firm to extensive compliance demands and potential litigation.
5. Supply Chain & Operations
Ameriprise Financial, Inc.
- Asset turnover strong at 1.96, showing operational efficiency.
Northern Trust Corporation
- Asset turnover weak at 0.08, indicating operational inefficiencies in asset utilization.
6. ESG & Climate Transition
Ameriprise Financial, Inc.
- ESG risks not explicitly detailed; asset-heavy model may face transition costs.
Northern Trust Corporation
- Increasing focus on sustainable investing may pressure traditional asset servicing revenues.
7. Geopolitical Exposure
Ameriprise Financial, Inc.
- US-centric but international exposure could introduce volatility from global market shifts.
Northern Trust Corporation
- Global institutional clientele raises sensitivity to geopolitical uncertainties and cross-border regulations.
Which company shows a better risk-adjusted profile?
Ameriprise’s greatest risk stems from its high leverage ratio, which could strain capital flexibility during market stress. Northern Trust’s most impactful risk is its low interest coverage and weak operational turnover, signaling financial and efficiency vulnerabilities. I see Ameriprise as having a better risk-adjusted profile due to its superior profitability and operational metrics despite leverage concerns. Its Altman Z-score of 7.68 confirms financial safety, contrasting sharply with Northern Trust’s distress zone score of -0.30, reflecting significant solvency risk.
Final Verdict: Which stock to choose?
Ameriprise Financial’s superpower lies in its exceptional capital efficiency, generating returns far above its cost of capital. This indicates a durable competitive advantage and strong value creation. A point of vigilance is its relatively high leverage, which could amplify risks during market stress. This stock fits well in an aggressive growth portfolio seeking robust profitability.
Northern Trust’s strategic moat centers on its disciplined asset management and conservative balance sheet, providing a safer harbor amid volatility. However, its declining return metrics and weaker earnings growth suggest caution. It offers better stability than Ameriprise and suits a GARP (Growth at a Reasonable Price) strategy focused on risk-managed income.
If you prioritize high-return growth with a willingness to accept balance sheet risks, Ameriprise outshines as the compelling choice due to its superior capital returns and operational strength. However, if you seek steadier cash flows and lower financial risk, Northern Trust offers better stability, albeit with muted growth prospects and a more defensive stance.
Disclaimer: Investment carries a risk of loss of initial capital. The past performance is not a reliable indicator of future results. Be sure to understand risks before making an investment decision.
Go Further
I encourage you to read the complete analyses of Ameriprise Financial, Inc. and Northern Trust Corporation to enhance your investment decisions: