Home > Comparison > Financial Services > KKR vs AMP
The strategic rivalry between KKR & Co. Inc. and Ameriprise Financial, Inc. shapes the asset management sector’s landscape. KKR operates as a diversified private equity and real estate powerhouse, specializing in complex investments worldwide. Ameriprise stands as a comprehensive wealth manager with a broad client service platform. This head-to-head pits KKR’s growth-driven investment approach against Ameriprise’s steady advisory model. This analysis aims to identify which trajectory delivers superior risk-adjusted returns for diversified portfolios.
Table of contents
Companies Overview
KKR & Co. Inc. and Ameriprise Financial, Inc. define key pillars of the asset management sector in 2026.
KKR & Co. Inc.: Global Private Equity Powerhouse
KKR dominates as a private equity and real estate investment firm with a revenue engine fueled by acquisitions and leveraged buyouts across multiple industries. Its 2026 strategy centers on diverse investments from technology to energy, emphasizing impact investments and geographic breadth including Asia, Europe, and the Americas.
Ameriprise Financial, Inc.: Comprehensive Wealth Manager
Ameriprise stands as a leading financial services provider focused on advice, wealth, and asset management. It generates revenue through financial planning, mutual funds, insurance, and retirement products. In 2026, it sharpens focus on expanding its Advice & Wealth Management segment to deepen client relationships and institutional reach.
Strategic Collision: Similarities & Divergences
Both firms excel in asset management but diverge sharply in approach. KKR pursues a direct investment model emphasizing control and active ownership, while Ameriprise leans on client advisory and diversified financial products. Their competition centers on capturing growing wealth management demand. KKR profiles as an opportunistic private equity investor; Ameriprise as a steady wealth and financial solutions provider.
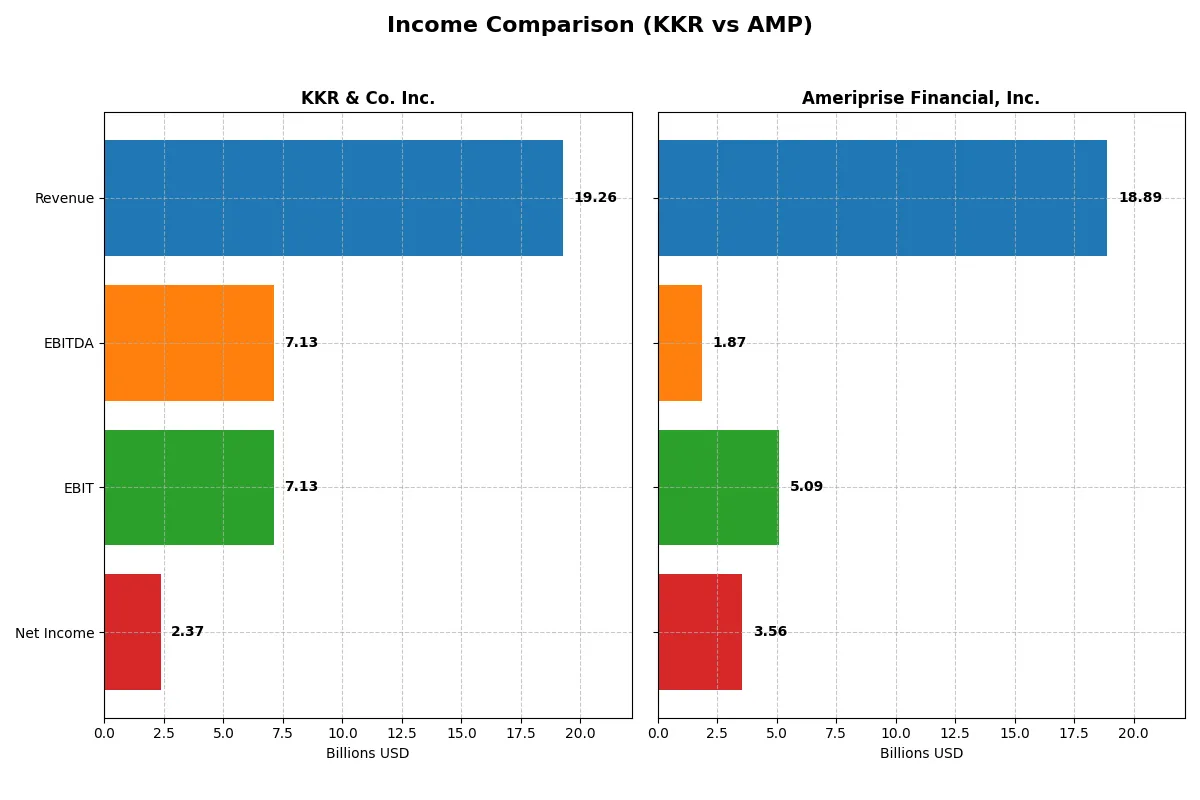
Income Statement Comparison
The following data dissects the core profitability and scalability of both corporate engines to reveal who dominates the bottom line:
| Metric | KKR & Co. Inc. (KKR) | Ameriprise Financial, Inc. (AMP) |
|---|---|---|
| Revenue | 19.3B | 18.9B |
| Cost of Revenue | 11.2B | 8.7B |
| Operating Expenses | 7.6B | 5.1B |
| Gross Profit | 8.1B | 10.2B |
| EBITDA | 7.1B | 1.9B |
| EBIT | 7.1B | 5.1B |
| Interest Expense | 2.3B | 324M |
| Net Income | 2.4B | 3.6B |
| EPS | 2.52 | 36.9 |
| Fiscal Year | 2025 | 2025 |
Income Statement Analysis: The Bottom-Line Duel
This income statement comparison reveals which company runs a more efficient and profitable corporate engine in 2025.
KKR & Co. Inc. Analysis
KKR’s revenue declined 11% to $19.3B in 2025, while net income fell 23% to $2.37B. Its gross margin remains favorable at 41.8%, but net margin shrank to 12.3%, reflecting margin compression and rising interest expenses. The latest year shows weakening momentum, with earnings and margins under pressure.
Ameriprise Financial, Inc. Analysis
Ameriprise posted 5% revenue growth to $18.9B in 2025, with net income advancing modestly to $3.56B. Its gross margin is robust at 54%, and net margin stands at 18.9%, both outperforming KKR. Despite a slight dip in EBIT and gross profit, Ameriprise sustains stronger profitability and operational leverage.
Margin Strength vs. Revenue Contraction
Ameriprise clearly leads in margin quality and stable net income growth, while KKR struggles with declining profitability and margins. For investors prioritizing consistent earnings and operational efficiency, Ameriprise’s profile appears more attractive despite slower revenue expansion.
Financial Ratios Comparison
These vital ratios act as a diagnostic tool to expose the underlying fiscal health, valuation premiums, and capital efficiency of the companies compared below:
| Ratios | KKR & Co. Inc. (KKR) | Ameriprise Financial, Inc. (AMP) |
|---|---|---|
| ROE | 13.01% | 65.05% |
| ROIC | 0.25% | 2.84% |
| P/E | 42.65x | 15.81x |
| P/B | 5.55x | 10.29x |
| Current Ratio | 4.12 | 107.24 |
| Quick Ratio | 4.12 | 107.24 |
| D/E | 2.15 | 1.05 |
| Debt-to-Assets | 14.11% | 3.02% |
| Interest Coverage | 0.28x | 19.63x |
| Asset Turnover | 0.06 | 0.10 |
| Fixed Asset Turnover | 12.23 | N/A |
| Payout ratio | 19.90% | 16.88% |
| Dividend yield | 0.47% | 1.07% |
| Fiscal Year | 2024 | 2024 |
Efficiency & Valuation Duel: The Vital Signs
Financial ratios act as a company’s DNA, revealing hidden risks and operational strengths critical for informed investment decisions.
KKR & Co. Inc.
KKR posts a solid 13% ROE with a favorable 14.2% net margin but suffers from a stretched P/E of 42.65, signaling expensive valuation. Its high debt-to-equity ratio of 2.15 raises caution. Dividend yield stands low at 0.47%, reflecting limited shareholder payouts amid reinvestment constraints.
Ameriprise Financial, Inc.
Ameriprise excels with a robust 54.4% ROE and favorable 18.9% net margin, paired with a reasonable P/E of 13.05, suggesting attractive valuation. Debt levels remain conservative with a 0.9 D/E ratio. Dividend yield at 1.28% provides moderate income, balancing returns with operational efficiency.
Valuation Discipline vs. Profitability Power
Ameriprise offers superior profitability and a more balanced valuation profile compared to KKR’s stretched metrics and leverage. Investors prioritizing growth with moderate risk may prefer Ameriprise, while those tolerating higher valuation and leverage face elevated risks with KKR.
Which one offers the Superior Shareholder Reward?
KKR yields about 0.47% with a conservative 20% payout ratio and modest buybacks, balancing steady income and capital return. Ameriprise yields higher near 1.3%, with a similar payout ratio but stronger free cash flow coverage and more aggressive buybacks. I see Ameriprise’s model as more sustainable and rewarding in 2026 due to robust cash flow and focused capital allocation. Investors seeking total return should favor Ameriprise for its blend of yield, buybacks, and financial resilience.
Comparative Score Analysis: The Strategic Profile
The radar chart reveals the fundamental DNA and trade-offs of KKR & Co. Inc. and Ameriprise Financial, Inc., highlighting their core financial strengths and vulnerabilities:
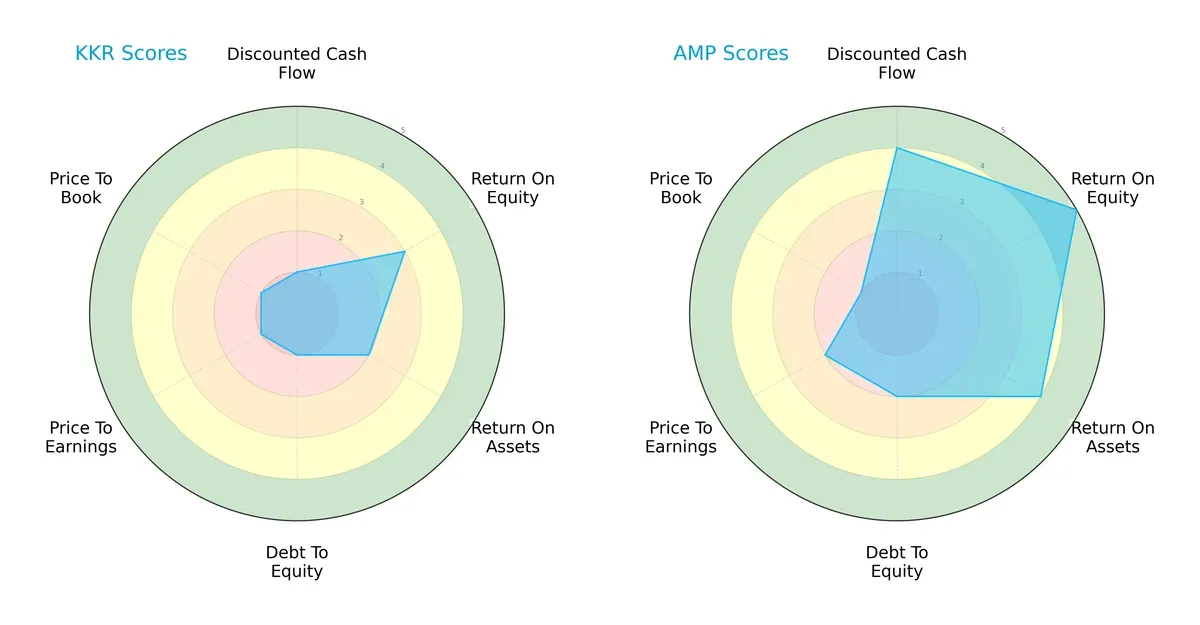
Ameriprise Financial (AMP) commands a more balanced financial profile with strong marks in DCF (4), ROE (5), and ROA (4), signaling efficient profitability and asset utilization. KKR lags significantly, scoring mostly Very Unfavorable in valuation and leverage metrics, indicating financial strain. KKR relies heavily on moderate ROE (3) to sustain its profile, while AMP offers diversified strengths but carries slightly higher debt risk. Overall, AMP demonstrates a more resilient and diversified investment case.
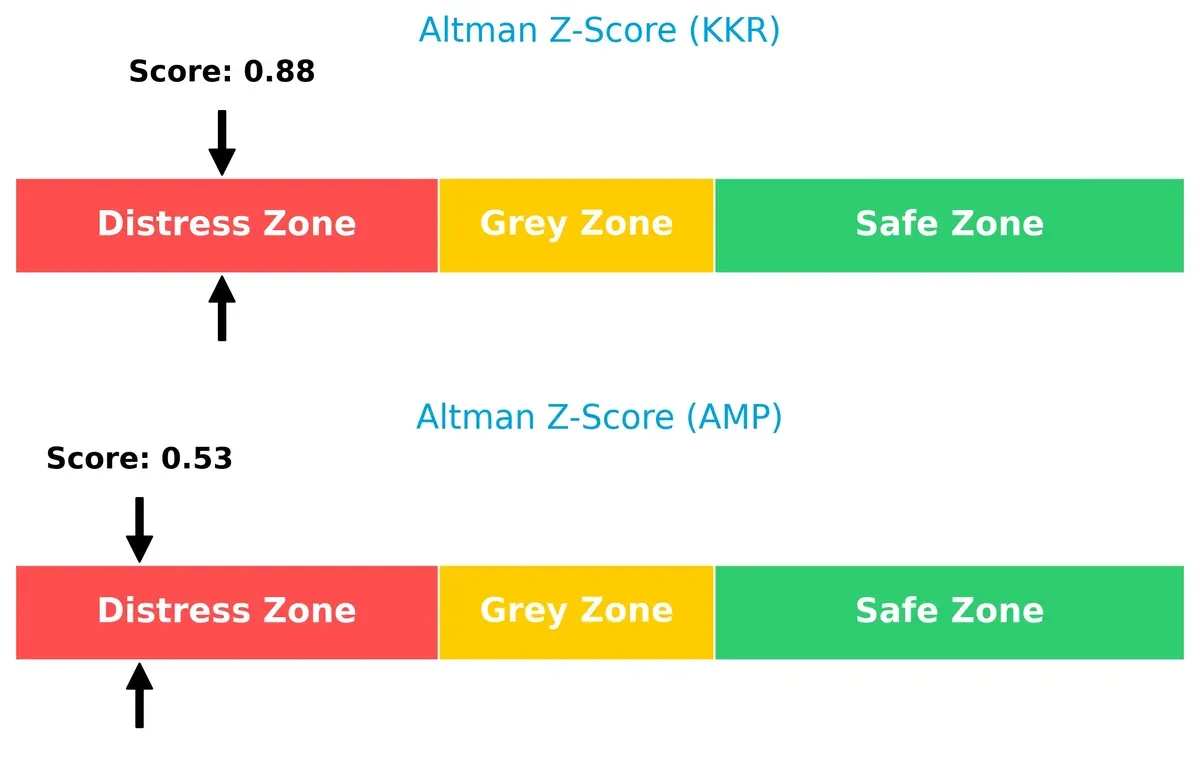
Bankruptcy Risk: Solvency Showdown
The Altman Z-Scores place both firms in the distress zone, but KKR’s score (0.88) edges out Ameriprise’s (0.53), suggesting marginally better solvency prospects in this cycle:
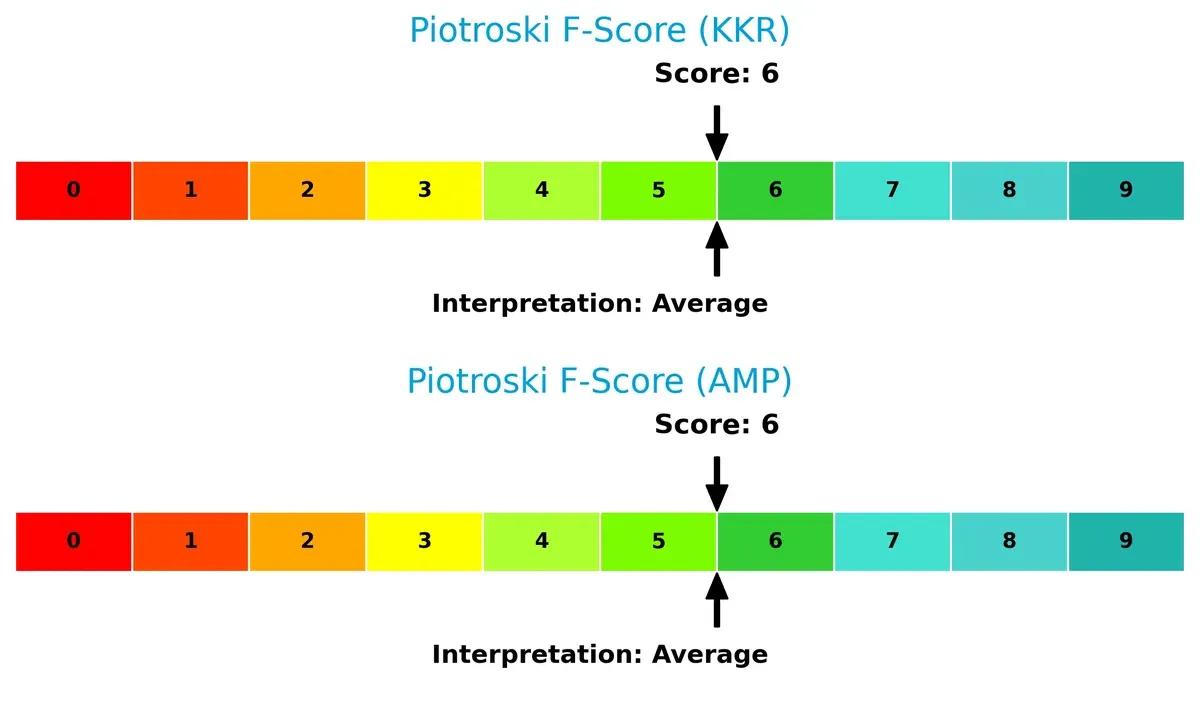
Financial Health: Quality of Operations
KKR and Ameriprise both score 6 on the Piotroski F-Score, placing them in average financial health territory. Neither exhibits glaring red flags, but neither reaches peak operational strength:
How are the two companies positioned?
This section dissects the operational DNA of KKR and AMP by comparing their revenue distribution by segment and internal dynamics, including strengths and weaknesses. The goal is to confront their economic moats and identify which model offers the most resilient and sustainable competitive advantage today.
Revenue Segmentation: The Strategic Mix
This visual comparison dissects how KKR & Co. Inc. and Ameriprise Financial diversify income streams and reveals their primary sector bets for 2024:
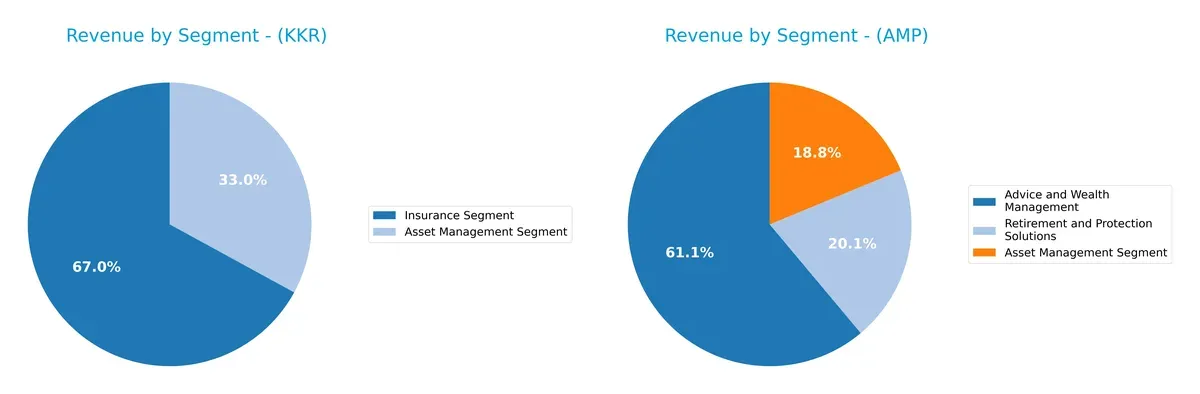
KKR anchors its revenue in the Insurance Segment at $14.7B, overshadowing Asset Management’s $7.2B. This heavy reliance signals concentration risk but also dominance in insurance infrastructure. Conversely, Ameriprise balances $11.4B in Advice and Wealth Management with $3.5B in Asset Management and $3.8B in Retirement and Protection, showcasing a well-diversified portfolio that reduces dependency on any single segment.
Strengths and Weaknesses Comparison
This table compares the strengths and weaknesses of KKR & Co. Inc. and Ameriprise Financial, Inc. based on diversification, profitability, financial statement, innovation, global presence, and market share:
KKR Strengths
- Revenue diversified between Asset Management and Insurance segments
- Favorable net margin of 14.22%
- Quick ratio of 4.12 indicates strong liquidity
- Favorable debt-to-assets at 14.11%
- Fixed asset turnover of 12.23 shows efficient use of assets
AMP Strengths
- Higher net margin at 18.86% and strong ROE of 54.41%
- Favorable PE ratio of 13.05 implies attractive valuation
- Low debt-to-assets at 3.07% reduces financial risk
- Strong interest coverage at 15.72
- Diversified revenues across Advice, Asset Management, Retirement segments
KKR Weaknesses
- Unfavorable ROIC at 0.25%, indicating weak capital efficiency
- High debt-to-equity of 2.15 suggests leverage risk
- Unfavorable PE and PB ratios indicate possible overvaluation
- Current ratio of 4.12 is unusually high, possibly inefficient capital use
- Asset turnover low at 0.06, indicating low sales generation from assets
AMP Weaknesses
- Negative ROIC at -135.08% signals poor capital returns
- Unfavorable PB of 7.1 implies expensive valuation
- Zero current and quick ratios raise liquidity concerns
- Fixed asset turnover of 0 signals asset underutilization
- Asset turnover low at 0.1, reflecting operational inefficiency
Both companies exhibit strengths in profitability and segment diversification but face challenges in capital efficiency and asset turnover. KKR’s leverage and valuation metrics raise caution, while AMP’s liquidity ratios and negative ROIC warrant careful scrutiny. These factors are critical for shaping each company’s strategic priorities.
The Moat Duel: Analyzing Competitive Defensibility
A structural moat is the only true shield protecting a company’s long-term profits from relentless competition erosion:
KKR & Co. Inc.: Diverse Investment Expertise Moat
KKR’s moat lies in its broad asset management specialization and deep industry knowledge. This manifests in resilient gross margins near 42%. However, declining ROIC signals pressure on capital efficiency. New markets in tech and infrastructure could widen its moat if managed prudently.
Ameriprise Financial, Inc.: Client Relationship & Advice Moat
Ameriprise’s moat centers on trusted financial advice and wealth management services, sustaining a higher gross margin of 54%. Yet, it faces a steep ROIC decline, indicating struggles to maintain value creation. Expansion in retirement solutions may offer growth but risks disruption remain.
Asset Management Moats: Diversification vs. Client Loyalty
KKR’s moat is broader, fueled by diversified investments, while Ameriprise relies on client trust and advisory services. Both firms show declining ROICs, but KKR’s strategic market reach better equips it to defend and potentially expand its competitive edge.
Which stock offers better returns?
Over the past 12 months, KKR & Co. Inc. and Ameriprise Financial, Inc. both showed significant price movements with contrasting trading dynamics and momentum shifts.
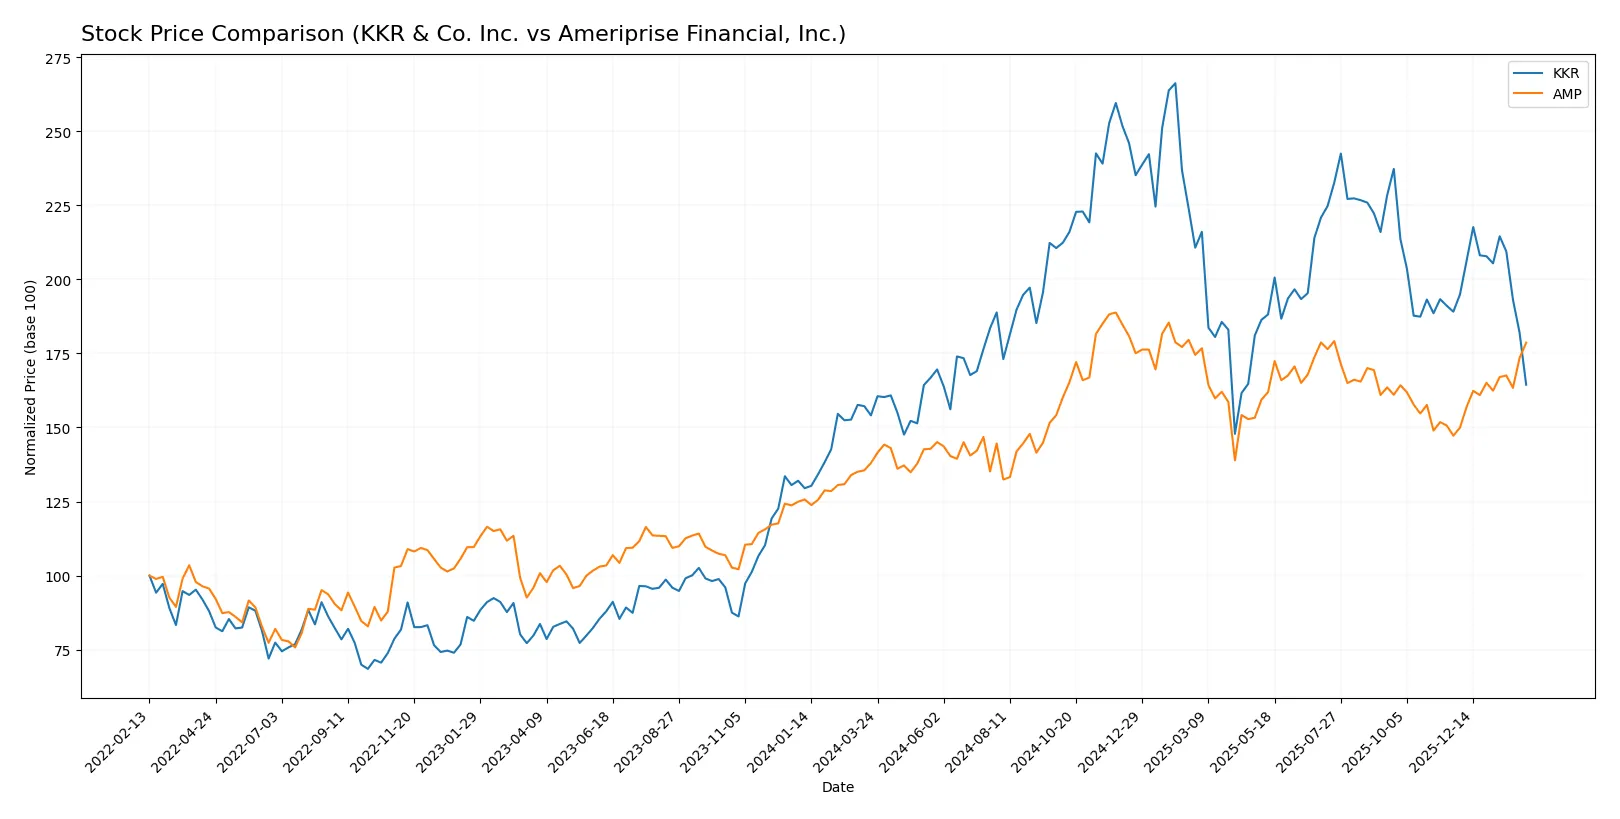
Trend Comparison
KKR’s stock price rose 6.72% over the past year, reflecting a bullish but decelerating trend. The price fluctuated between 92.62 and 167.07, with increased volatility overall.
Ameriprise Financial’s stock surged 29.44%, showing a bullish trend with accelerating momentum. Its price ranged from 402.61 to 573.97, accompanied by notably higher volatility.
Comparing both, Ameriprise Financial delivered the highest market performance with stronger acceleration and a larger price gain than KKR.
Target Prices
Analysts project solid upside potential for KKR & Co. Inc. and Ameriprise Financial, Inc., reflecting confidence in asset management growth.
| Company | Target Low | Target High | Consensus |
|---|---|---|---|
| KKR & Co. Inc. | 125 | 187 | 156 |
| Ameriprise Financial, Inc. | 485 | 605 | 547.5 |
KKR’s consensus target of 156 suggests a 51% upside from the current 103.2 price. Ameriprise’s 547.5 consensus is roughly flat versus its 543 price, indicating limited near-term price appreciation.

Don’t Let Luck Decide Your Entry Point
Optimize your entry points with our advanced ProRealTime indicators. You’ll get efficient buy signals with precise price targets for maximum performance. Start outperforming now!
How do institutions grade them?
KKR & Co. Inc. Grades
The following table summarizes recent grades from leading analysts for KKR & Co. Inc.:
| Grading Company | Action | New Grade | Date |
|---|---|---|---|
| Oppenheimer | Maintain | Outperform | 2026-02-06 |
| Barclays | Maintain | Overweight | 2026-02-06 |
| TD Cowen | Downgrade | Hold | 2026-01-14 |
| UBS | Maintain | Buy | 2026-01-13 |
| Barclays | Maintain | Overweight | 2026-01-09 |
| Barclays | Maintain | Overweight | 2025-12-12 |
| Barclays | Maintain | Overweight | 2025-11-11 |
| Oppenheimer | Maintain | Outperform | 2025-11-10 |
| TD Cowen | Maintain | Buy | 2025-11-10 |
| Morgan Stanley | Maintain | Overweight | 2025-10-21 |
Ameriprise Financial, Inc. Grades
Below are recent analyst grades for Ameriprise Financial, Inc. from reputable firms:
| Grading Company | Action | New Grade | Date |
|---|---|---|---|
| Jefferies | Maintain | Buy | 2026-02-02 |
| RBC Capital | Maintain | Outperform | 2026-02-02 |
| Piper Sandler | Upgrade | Neutral | 2026-01-30 |
| Morgan Stanley | Maintain | Underweight | 2025-12-22 |
| Argus Research | Maintain | Buy | 2025-11-13 |
| RBC Capital | Maintain | Outperform | 2025-11-03 |
| Keefe, Bruyette & Woods | Maintain | Market Perform | 2025-11-03 |
| Evercore ISI Group | Maintain | In Line | 2025-10-09 |
| Morgan Stanley | Maintain | Underweight | 2025-10-01 |
| RBC Capital | Maintain | Outperform | 2025-07-30 |
Which company has the best grades?
KKR & Co. Inc. consistently receives strong grades such as Outperform and Overweight from multiple top firms. Ameriprise Financial shows more mixed ratings, including Underweight and Neutral. Investors may interpret KKR’s more favorable analyst consensus as a sign of stronger institutional confidence.
Risks specific to each company
The following categories identify the critical pressure points and systemic threats facing both firms in the 2026 market environment:
1. Market & Competition
KKR & Co. Inc.
- Faces intense competition in private equity and diverse sectors, requiring constant innovation and deal sourcing.
Ameriprise Financial, Inc.
- Competes in wealth management and asset management, pressured by fee compression and digital disruptors.
2. Capital Structure & Debt
KKR & Co. Inc.
- High debt-to-equity ratio (2.15) signals elevated financial leverage and risk.
Ameriprise Financial, Inc.
- Moderate debt-to-equity (0.9) indicates more conservative leverage and better balance sheet stability.
3. Stock Volatility
KKR & Co. Inc.
- Beta near 2.0 reflects high stock volatility and market sensitivity.
Ameriprise Financial, Inc.
- Beta around 1.25 suggests more moderate stock price swings and market correlation.
4. Regulatory & Legal
KKR & Co. Inc.
- Subject to complex regulations across global investments and financial services.
Ameriprise Financial, Inc.
- Faces regulatory pressure in insurance, wealth advisory, and financial products compliance.
5. Supply Chain & Operations
KKR & Co. Inc.
- Operational risks stem from diverse portfolio management and integration of acquisitions.
Ameriprise Financial, Inc.
- Operational complexity arises from multiple product lines and global wealth management infrastructure.
6. ESG & Climate Transition
KKR & Co. Inc.
- Increasing focus on impact investments and sustainability creates both opportunity and compliance challenges.
Ameriprise Financial, Inc.
- ESG integration critical for client retention and regulatory compliance in asset and wealth management.
7. Geopolitical Exposure
KKR & Co. Inc.
- Global investments expose KKR to geopolitical risks in emerging and developed markets.
Ameriprise Financial, Inc.
- Ameriprise’s primarily U.S.-centric operations limit, but do not eliminate, geopolitical risks.
Which company shows a better risk-adjusted profile?
KKR’s most impactful risk is its elevated financial leverage, which magnifies market and operational risks. Ameriprise faces a critical challenge in ESG and regulatory pressures amid complex product offerings. Despite both operating in the distress zone per Altman Z-scores, Ameriprise demonstrates a stronger capital structure and lower stock volatility. Its favorable return on equity and interest coverage ratios further support a better risk-adjusted profile. The stark contrast in debt-to-equity levels—2.15 for KKR versus 0.9 for Ameriprise—justifies my heightened concern over KKR’s financial vulnerability.
Final Verdict: Which stock to choose?
KKR & Co. Inc. commands attention with its superpower of robust liquidity and a strong operating margin that suggests operational discipline. However, its declining return on invested capital and high leverage are points of vigilance. It suits investors with an appetite for cyclical opportunities and aggressive growth profiles.
Ameriprise Financial, Inc. benefits from a strategic moat rooted in stellar return on equity and a solid interest coverage ratio, reflecting financial safety and effective capital deployment. Compared to KKR, it offers better stability but trades at a premium. It fits well within a GARP (Growth at a Reasonable Price) portfolio seeking balanced risk and reward.
If you prioritize aggressive growth and can tolerate leverage risks, KKR is the compelling choice due to its operational efficiency and liquidity buffer. However, if you seek financial stability and superior capital returns with moderate growth, Ameriprise offers better stability and a clearer moat despite a higher valuation. Both represent distinct investment archetypes shaped by risk tolerance and return expectations.
Disclaimer: Investment carries a risk of loss of initial capital. The past performance is not a reliable indicator of future results. Be sure to understand risks before making an investment decision.
Go Further
I encourage you to read the complete analyses of KKR & Co. Inc. and Ameriprise Financial, Inc. to enhance your investment decisions: