Home > Comparison > Financial Services > AMP vs IVZ
The strategic rivalry between Ameriprise Financial, Inc. and Invesco Ltd. shapes the competitive landscape of asset management. Ameriprise operates a diversified, advice-driven wealth management model, while Invesco centers on broad, client-focused investment products with a quantitative edge. This head-to-head reflects a contrast between personalized advisory services and scalable fund management. This analysis will identify which model offers superior risk-adjusted returns for a balanced portfolio seeking exposure to financial services.

Table of contents
Companies Overview
Ameriprise Financial and Invesco Ltd. stand as key players shaping the asset management landscape in 2026.
Ameriprise Financial, Inc.: Comprehensive Wealth Management Leader
Ameriprise Financial dominates the financial advice and wealth management space. It generates revenue through diversified segments including Advice & Wealth Management, Asset Management, and Retirement & Protection Solutions. In 2026, the company emphasized expanding its advisory services and strengthening its mutual fund offerings to serve both individual and institutional clients.
Invesco Ltd.: Global Investment Manager Focused on Diversification
Invesco Ltd. operates as a publicly owned investment manager with a broad product suite covering equity, fixed income, and alternative asset classes. Its revenue engine relies on managing mutual funds, ETFs, and private funds across global markets. The firm’s strategic focus in 2026 centered on leveraging quantitative analysis and expanding multi-asset solutions to meet diverse client demands.
Strategic Collision: Similarities & Divergences
Both firms emphasize asset management but diverge in approach: Ameriprise leans on integrated advisory services, while Invesco prioritizes broad asset class diversification and quantitative strategies. Their primary battleground lies in capturing retail and institutional assets through innovative product offerings. This contrast defines distinct investment profiles—Ameriprise as a holistic wealth advisor, Invesco as a diversified global asset manager.
Income Statement Comparison
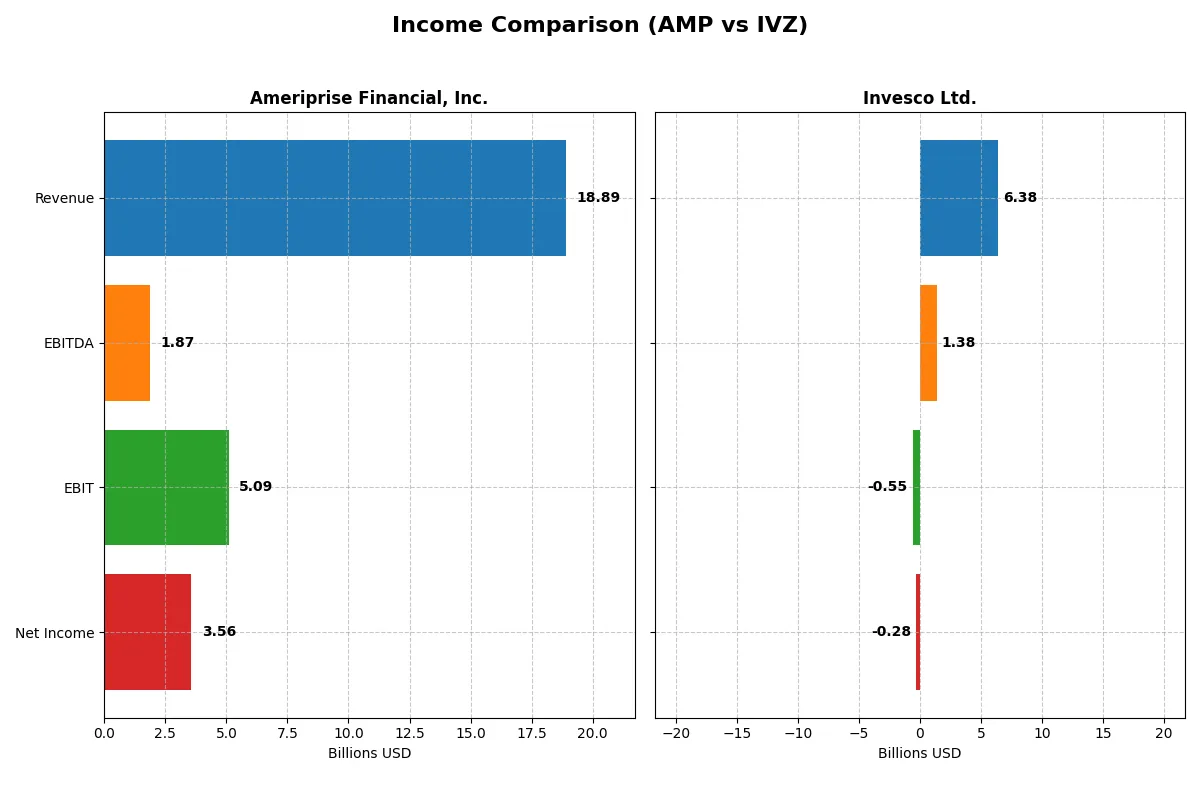
This data dissects the core profitability and scalability of both corporate engines to reveal who dominates the bottom line:
| Metric | Ameriprise Financial, Inc. (AMP) | Invesco Ltd. (IVZ) |
|---|---|---|
| Revenue | 18.9B | 6.38B |
| Cost of Revenue | 8.68B | 3.62B |
| Operating Expenses | 5.12B | 3.45B |
| Gross Profit | 10.2B | 2.75B |
| EBITDA | 1.87B | 1.38B |
| EBIT | 5.09B | -547M |
| Interest Expense | 324M | 83M |
| Net Income | 3.56B | -282M |
| EPS | 36.9 | -1.61 |
| Fiscal Year | 2025 | 2025 |
Income Statement Analysis: The Bottom-Line Duel
This income statement comparison unveils which company converts revenue into profit most efficiently under current market conditions.
Ameriprise Financial, Inc. Analysis
Ameriprise’s revenue rose steadily to $18.9B in 2025, with net income reaching $3.56B. Its gross margin holds strong at 54%, indicating resilient cost control. Despite a slight dip in operating income, the net margin remains favorable near 19%, reflecting disciplined expense management and solid earnings momentum.
Invesco Ltd. Analysis
Invesco posted $6.38B revenue in 2025 with a net loss of $0.28B, marking a stark contrast to prior profitability. Its gross margin of 43% is decent, but negative EBIT and net margins signal operational challenges. The steep decline in earnings underscores weak cost structure and deteriorating profitability momentum.
Margin Strength vs. Profitability Crisis
Ameriprise clearly outperforms with robust margins and consistent net income growth, while Invesco struggles with losses and shrinking margins. For investors, Ameriprise’s stable earnings profile offers a far more attractive risk-return balance compared to Invesco’s ongoing operational distress.
Financial Ratios Comparison
These vital ratios act as a diagnostic tool to expose the underlying fiscal health, valuation premiums, and capital efficiency of these companies:
| Ratios | Ameriprise Financial, Inc. (AMP) | Invesco Ltd. (IVZ) |
|---|---|---|
| ROE | 65.1% (2024) | 5.3% (2024) |
| ROIC | 2.8% (2024) | 2.4% (2024) |
| P/E | 15.8 (2024) | 10.3 (2024) |
| P/B | 10.3 (2024) | 0.55 (2024) |
| Current Ratio | 107.2 (2024) | 3.14 (2024) |
| Quick Ratio | 107.2 (2024) | 3.14 (2024) |
| D/E | 1.05 (2024) | 0.52 (2024) |
| Debt-to-Assets | 3.0% (2024) | 28.0% (2024) |
| Interest Coverage | 19.6 (2024) | 14.3 (2024) |
| Asset Turnover | 0.099 (2024) | 0.225 (2024) |
| Fixed Asset Turnover | 0 (2024) | 12.7 (2024) |
| Payout ratio | 16.9% (2024) | 78.5% (2024) |
| Dividend yield | 1.07% (2024) | 7.61% (2024) |
| Fiscal Year | 2024 | 2024 |
Efficiency & Valuation Duel: The Vital Signs
Ratios act as the company’s DNA, unveiling hidden risks and operational excellence that raw numbers alone cannot expose.
Ameriprise Financial, Inc.
Ameriprise displays strong profitability with a 54.41% ROE and solid margins at 18.83%. Its valuation metrics are favorable, indicating the stock is reasonably priced relative to earnings. However, it lacks dividends, instead focusing on reinvestment strategies. The company’s capital efficiency shines with a 60.42% ROIC, though elevated debt levels present caution.
Invesco Ltd.
Invesco struggles with negative net margins at -11.39% and zero return on equity, signaling operational challenges. Its P/E ratio is unusually low, suggesting undervaluation or distress. The firm pays a modest 3.18% dividend, providing income despite weak profitability. Balance sheet indicators are mixed, with low leverage but unfavorable interest coverage, reflecting risk.
Profitability Strength vs. Income Stability
Ameriprise offers superior operational efficiency and growth potential, balancing risk with robust returns. Invesco’s profile suits income-focused investors tolerating higher risk amid profitability concerns. The choice hinges on whether an investor prioritizes growth or dividend income in a challenging environment.
Which one offers the Superior Shareholder Reward?
I observe that Ameriprise Financial (AMP) pays a modest dividend yield around 1.4% with a low payout ratio near 17%, supported by strong free cash flow (FCF) coverage above 95%. Its buyback program is less explicit but financial leverage and cash reserves suggest capacity for capital returns. Invesco (IVZ) delivers a higher dividend yield near 7.6% but suffers from volatile earnings and a payout ratio exceeding 60%, raising sustainability concerns. IVZ’s buyback activity appears limited amid weaker profitability and higher leverage. I conclude AMP offers a more sustainable total shareholder return, balancing steady dividends with prudent capital allocation, while IVZ’s elevated yield carries greater risk in 2026.
Comparative Score Analysis: The Strategic Profile
The radar chart reveals the fundamental DNA and trade-offs of Ameriprise Financial, Inc. (AMP) and Invesco Ltd. (IVZ), highlighting their core financial strengths and weaknesses:
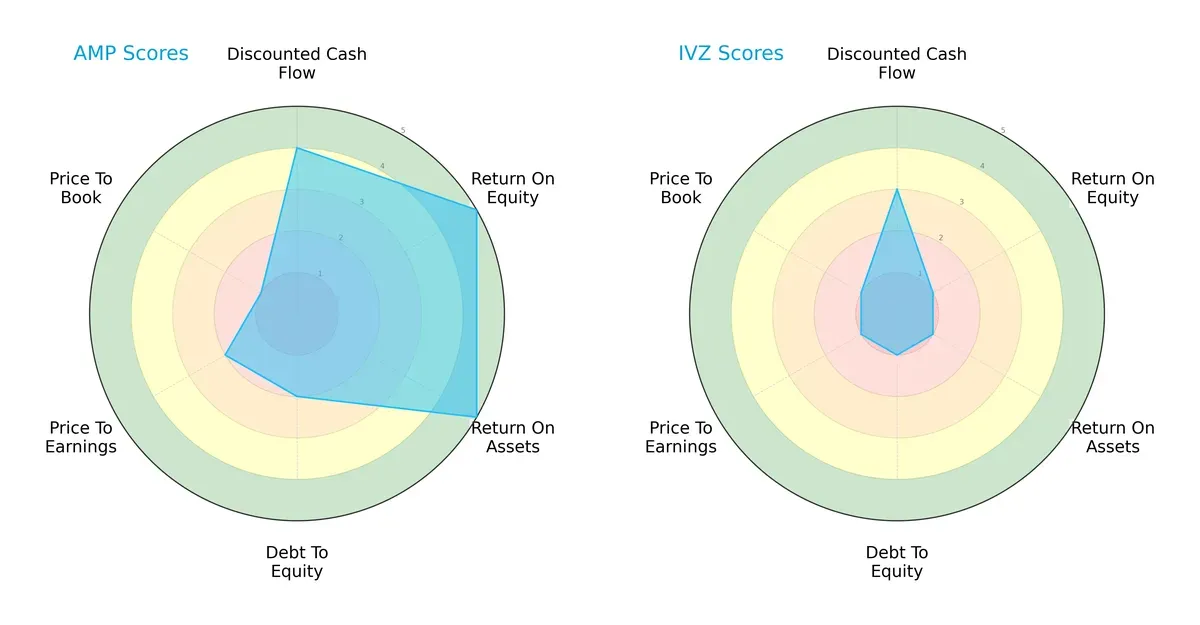
Ameriprise dominates with strong ROE (5) and ROA (5) scores, reflecting superior profitability and asset efficiency. It also scores well on DCF (4) but shows moderate debt management (2) and weak valuation metrics (PE 2, PB 1). Invesco relies heavily on a single edge, with uniformly low scores across all categories (mostly 1), signaling financial fragility and poor valuation. AMP’s profile is more balanced and resilient, whereas IVZ’s depends on a narrow advantage that exposes it to greater risk.
Bankruptcy Risk: Solvency Showdown
The Altman Z-Score gap between AMP (7.68) and IVZ (0.96) signals vastly different solvency prospects in this cycle:
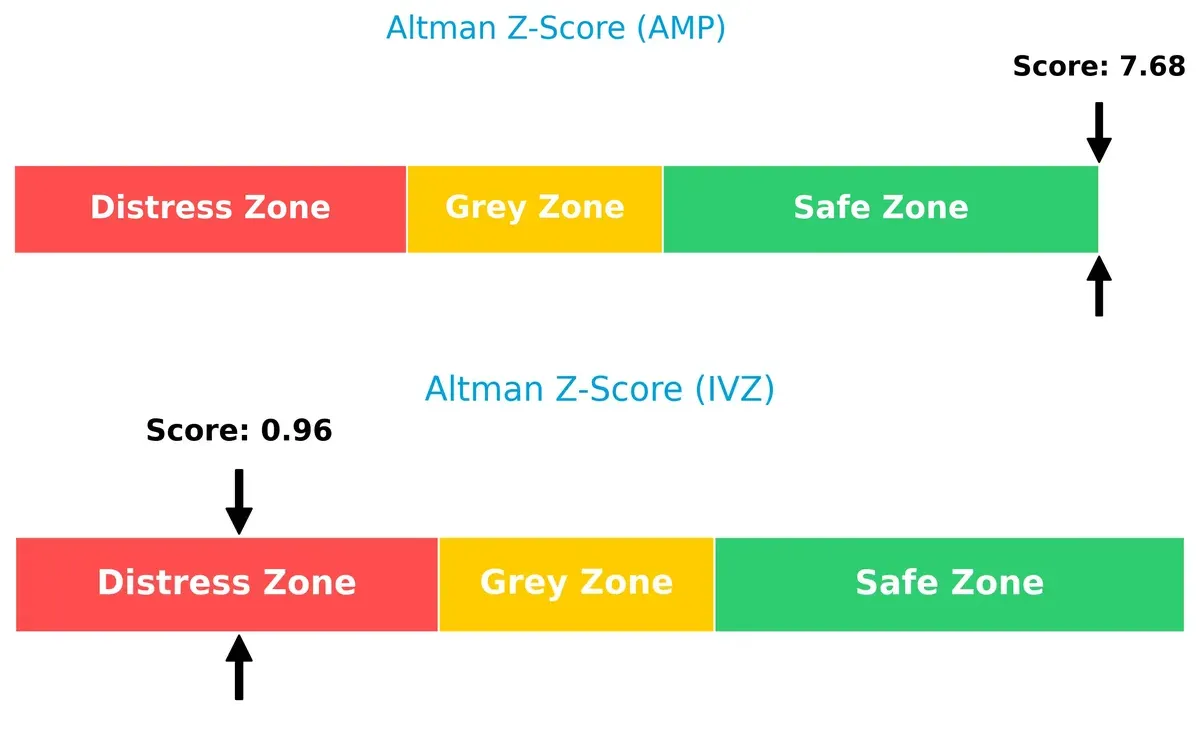
AMP’s score places it firmly in the safe zone, indicating robust financial stability and low bankruptcy risk. IVZ’s distress zone score warns of severe solvency challenges and a high likelihood of financial distress under current market conditions.
Financial Health: Quality of Operations
Piotroski F-Scores reveal operational quality differences between AMP (6) and IVZ (7):
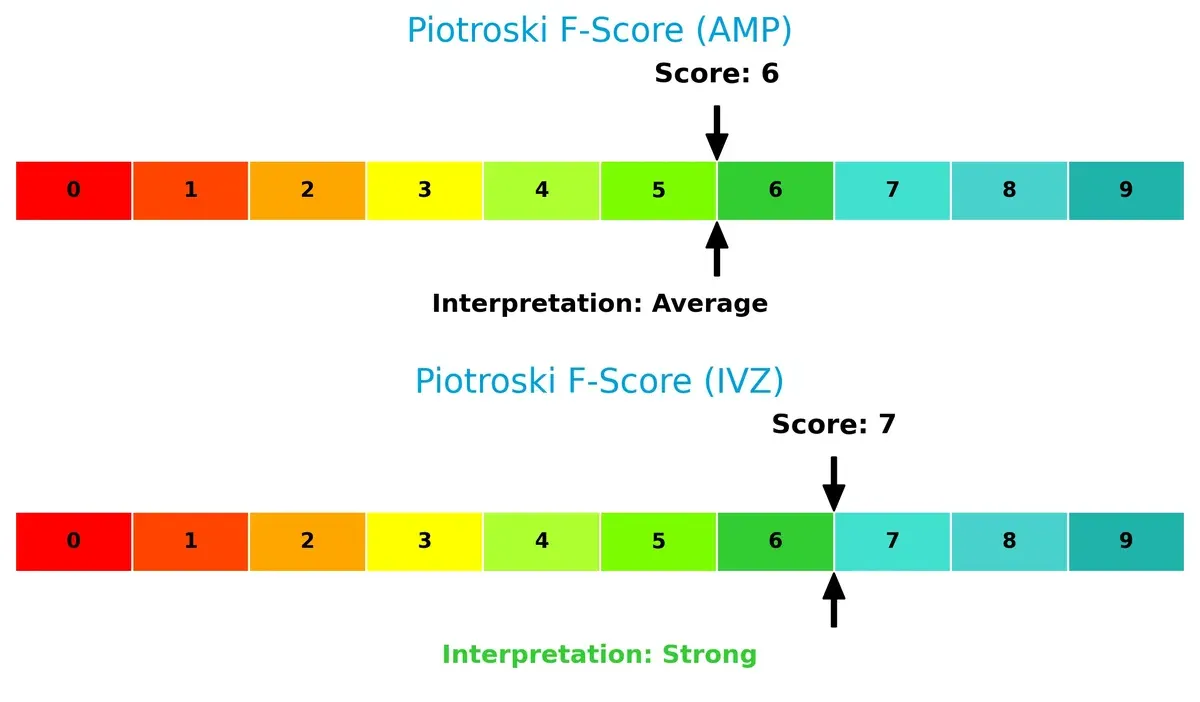
Both companies show decent financial health, but IVZ edges AMP with a stronger internal metrics profile. AMP’s score of 6 is average, suggesting some operational red flags. IVZ’s higher score of 7 reflects better profitability, liquidity, and efficiency, despite its solvency risks. Investors must balance IVZ’s operational strength against its financial vulnerability.
How are the two companies positioned?
This section dissects AMP and IVZ’s operational DNA by comparing revenue distribution and internal dynamics—strengths and weaknesses. The goal is to confront their economic moats and identify which model offers the most resilient competitive advantage today.
Revenue Segmentation: The Strategic Mix
This visual comparison dissects how Ameriprise Financial, Inc. and Invesco Ltd. diversify their income streams and reveals where their primary sector bets lie:
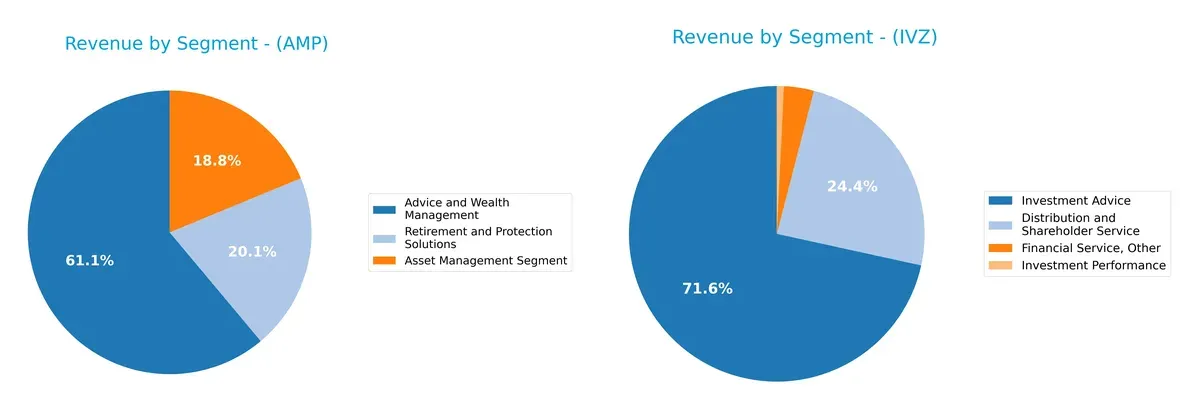
Ameriprise leans heavily on Advice and Wealth Management, generating $11.4B in 2024, anchoring its revenue. Invesco pivots on Investment Advice with $4.34B but shows more balance, adding $1.48B from Distribution and Shareholder Service. Ameriprise’s concentration suggests ecosystem lock-in risk but strong brand moat. Invesco’s mix hints at diversified client touchpoints, reducing reliance on one segment and enhancing resilience in volatile markets.
Strengths and Weaknesses Comparison
This table compares the Strengths and Weaknesses of Ameriprise Financial, Inc. (AMP) and Invesco Ltd. (IVZ):
AMP Strengths
- Strong profitability with 18.83% net margin and 54.41% ROE
- High ROIC of 60.42% well above WACC
- Diversified revenue streams across Advice, Asset Management, Retirement
- Favorable interest coverage ratio of 15.72
- Solid asset turnover at 1.96
IVZ Strengths
- Favorable valuation metrics including low P/E and P/B ratios
- Low debt-to-equity and debt-to-assets ratios indicate conservative leverage
- Positive dividend yield of 3.18% supports income investors
- Diversified geographic presence across Americas, Asia, EMEA
- Revenue stable in Investment Advice and Distribution segments
AMP Weaknesses
- Unfavorable liquidity indicated by current and quick ratios at 0
- High debt-to-assets ratio at 60.75% raises financial risk
- No dividend yield limits income appeal
- Fixed asset turnover not reported, suggesting potential efficiency gap
IVZ Weaknesses
- Negative net margin of -11.39% and ROE near zero reveal profitability challenges
- Negative interest coverage at -6.63 signals debt servicing issues
- Asset and fixed asset turnover at 0 imply operational inefficiency
- Unfavorable liquidity ratios at 0 raise solvency concerns
Ameriprise displays robust profitability and diversified revenue but faces liquidity and leverage risks. Invesco shows strong capital structure and dividend yield but struggles with profitability and operational efficiency. These contrasts highlight differing strategic and financial challenges.
The Moat Duel: Analyzing Competitive Defensibility
A structural moat is the sole safeguard for long-term profits against relentless competition erosion. Let’s dissect the moats of Ameriprise Financial and Invesco Ltd.:
Ameriprise Financial, Inc.: Durable Value Creation through Advice & Wealth Management
Ameriprise’s moat stems from strong intangible assets and client trust, reflected in a robust ROIC 51% above WACC and expanding profitability. New product launches and market expansions in retirement solutions should deepen this moat in 2026.
Invesco Ltd.: Struggling Cost Advantage amid Market Pressures
Invesco’s moat relies on scale and cost efficiencies but suffers from declining ROIC and negative margins, undercutting its competitive position versus Ameriprise. Potential growth hinges on strategic repositioning in alternative investments and emerging markets, but challenges persist.
Moat Strength Showdown: Intangible Trust vs. Cost Efficiency
Ameriprise commands a wider and more durable moat, evidenced by strong ROIC growth and stable margins. Invesco’s deteriorating returns and profitability weaken its defense. I see Ameriprise better positioned to protect and grow market share through 2026.
Which stock offers better returns?
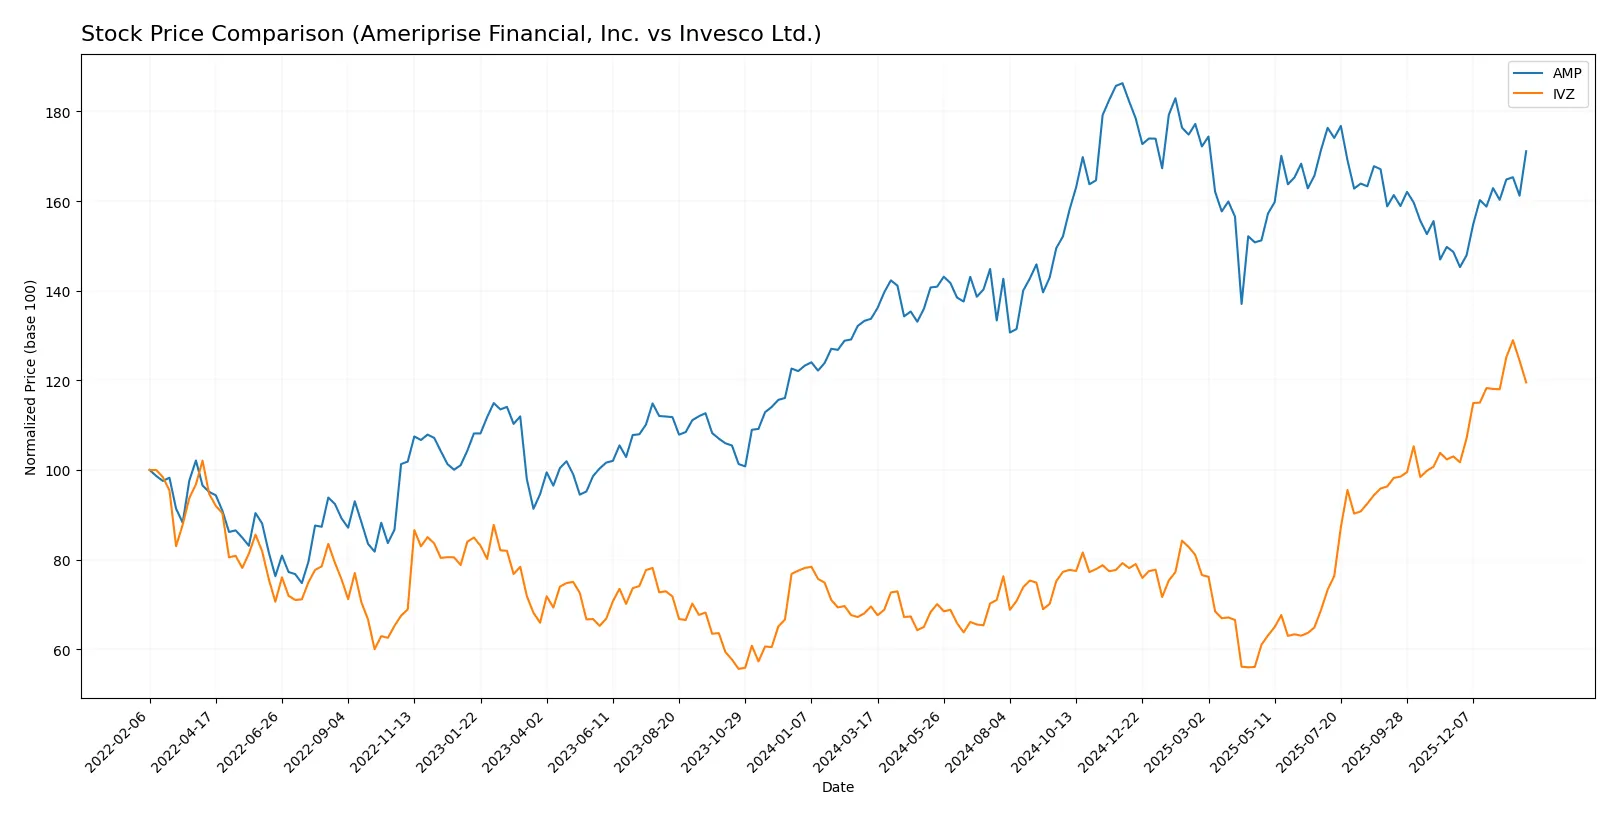
Both Ameriprise Financial, Inc. and Invesco Ltd. have shown significant price appreciation over the past year, with strong bullish momentum and accelerating trends in their trading dynamics.
Trend Comparison
Ameriprise Financial, Inc. (AMP) gained 27.96% over the past 12 months, showing a bullish trend with accelerating price momentum. The stock reached a high of 573.97 and a low of 402.61, reflecting notable volatility (std deviation 45.04).
Invesco Ltd. (IVZ) outperformed with a 71.85% price increase over the same period. It also presented a bullish trend with acceleration, but with lower volatility (std deviation 3.99), hitting a high of 29.44 and a low of 12.78.
Comparing both, IVZ delivered the highest market performance with a much stronger price advance and steadier trading conditions than AMP.
Target Prices
Analysts present a measured target consensus for Ameriprise Financial and Invesco Ltd., reflecting moderate upside potential.
| Company | Target Low | Target High | Consensus |
|---|---|---|---|
| Ameriprise Financial, Inc. | 485 | 570 | 528.33 |
| Invesco Ltd. | 24 | 34.5 | 29.8 |
The target consensus for Ameriprise Financial sits slightly above its current price of 527.19, suggesting modest appreciation. Invesco’s consensus target of 29.8 exceeds its current price of 27.29, indicating potential upside but with some volatility risk.

Don’t Let Luck Decide Your Entry Point
Optimize your entry points with our advanced ProRealTime indicators. You’ll get efficient buy signals with precise price targets for maximum performance. Start outperforming now!
How do institutions grade them?
This section summarizes recent institutional grades for Ameriprise Financial, Inc. and Invesco Ltd.:
Ameriprise Financial, Inc. Grades
The following table details recent grades assigned by reputable analysts to Ameriprise Financial, Inc.:
| Grading Company | Action | New Grade | Date |
|---|---|---|---|
| Piper Sandler | Upgrade | Neutral | 2026-01-30 |
| Morgan Stanley | Maintain | Underweight | 2025-12-22 |
| Argus Research | Maintain | Buy | 2025-11-13 |
| RBC Capital | Maintain | Outperform | 2025-11-03 |
| Keefe, Bruyette & Woods | Maintain | Market Perform | 2025-11-03 |
| Evercore ISI Group | Maintain | In Line | 2025-10-09 |
| Morgan Stanley | Maintain | Underweight | 2025-10-01 |
| RBC Capital | Maintain | Outperform | 2025-07-30 |
| Raymond James | Maintain | Strong Buy | 2025-07-25 |
| William Blair | Downgrade | Market Perform | 2025-07-25 |
Invesco Ltd. Grades
Below are recent grades given by major analysts to Invesco Ltd.:
| Grading Company | Action | New Grade | Date |
|---|---|---|---|
| Goldman Sachs | Maintain | Neutral | 2026-01-28 |
| Barclays | Maintain | Equal Weight | 2026-01-28 |
| RBC Capital | Maintain | Outperform | 2026-01-28 |
| Argus Research | Maintain | Buy | 2026-01-28 |
| RBC Capital | Upgrade | Outperform | 2026-01-21 |
| JP Morgan | Maintain | Neutral | 2026-01-20 |
| Barclays | Maintain | Equal Weight | 2026-01-15 |
| Morgan Stanley | Maintain | Equal Weight | 2025-12-17 |
| Deutsche Bank | Upgrade | Buy | 2025-12-17 |
| Barclays | Maintain | Equal Weight | 2025-12-12 |
Which company has the best grades?
Invesco Ltd. holds a stronger consensus with multiple Outperform and Buy ratings and recent upgrades. Ameriprise Financial shows a mixed profile, including Underweight and Market Perform grades. Investors might view Invesco’s upgrades as signals of growing confidence relative to Ameriprise.
Risks specific to each company
The following categories identify critical pressure points and systemic threats facing both firms in the 2026 market environment:
1. Market & Competition
Ameriprise Financial, Inc. (AMP)
- Strong market position with diversified wealth and asset management services, benefiting from high ROIC and ROE.
Invesco Ltd. (IVZ)
- Faces profitability challenges with negative net margin and ROE, struggling against market peers in asset management.
2. Capital Structure & Debt
Ameriprise Financial, Inc. (AMP)
- Moderate leverage with debt-to-equity of 0.9 and interest coverage of 15.72, indicating manageable debt risk.
Invesco Ltd. (IVZ)
- Very low or no recorded debt, but negative interest coverage signals financial distress and poor capital structure.
3. Stock Volatility
Ameriprise Financial, Inc. (AMP)
- Beta of 1.256, indicating modestly higher volatility than the market but within typical asset management range.
Invesco Ltd. (IVZ)
- Beta of 1.626, showing increased stock volatility and higher risk relative to sector benchmarks.
4. Regulatory & Legal
Ameriprise Financial, Inc. (AMP)
- Subject to U.S. financial services regulations; diversified services reduce regulatory concentration risk.
Invesco Ltd. (IVZ)
- Also regulated in U.S. and international markets; exposure to multiple jurisdictions adds complexity and compliance burden.
5. Supply Chain & Operations
Ameriprise Financial, Inc. (AMP)
- Stable operational model focused on financial advisory and asset management with strong asset turnover.
Invesco Ltd. (IVZ)
- Operational challenges reflected in zero asset turnover metric, indicating inefficiencies or reporting gaps.
6. ESG & Climate Transition
Ameriprise Financial, Inc. (AMP)
- Increasing pressure to integrate ESG in asset management strategies but benefits from institutional client base.
Invesco Ltd. (IVZ)
- Faces ESG integration challenges amid growing investor scrutiny and reputational risk in global markets.
7. Geopolitical Exposure
Ameriprise Financial, Inc. (AMP)
- Primarily U.S.-based but international operations expose it to moderate geopolitical risks.
Invesco Ltd. (IVZ)
- Broader global footprint including Bermuda office heightens exposure to geopolitical and currency risks.
Which company shows a better risk-adjusted profile?
Ameriprise’s key risk lies in its high debt-to-assets ratio, raising leverage concerns. Invesco faces severe profitability and financial distress risks, evidenced by negative margins and Altman Z-score in the distress zone. I find Ameriprise presents a stronger risk-adjusted profile, supported by its robust interest coverage and safe-zone Altman Z-score, contrasting sharply with Invesco’s financial fragility.
Final Verdict: Which stock to choose?
Ameriprise Financial, Inc. (AMP) showcases a formidable superpower: a durable competitive advantage evidenced by a soaring ROIC well above its cost of capital. This cash machine consistently creates value and delivers strong returns. However, its elevated leverage signals a point of vigilance. AMP fits best in portfolios seeking aggressive growth with an appetite for some financial risk.
Invesco Ltd. (IVZ) holds a strategic moat in its relatively lower debt and moderate operational efficiency, appealing to risk-conscious investors. Its recurring revenue streams provide a degree of stability compared to AMP’s more volatile financial structure. IVZ suits portfolios focused on Growth at a Reasonable Price (GARP), balancing potential upside with safety.
If you prioritize high-value creation and robust profitability, Ameriprise Financial outshines due to its strong moat and accelerating price momentum. However, if you seek better financial stability with a moderate risk profile, Invesco offers a safer harbor despite weaker profitability metrics. Both scenarios require careful consideration of leverage and growth sustainability.
Disclaimer: Investment carries a risk of loss of initial capital. The past performance is not a reliable indicator of future results. Be sure to understand risks before making an investment decision.
Go Further
I encourage you to read the complete analyses of Ameriprise Financial, Inc. and Invesco Ltd. to enhance your investment decisions: