Home > Comparison > Financial Services > AMP vs BEN
The strategic rivalry between Ameriprise Financial, Inc. and Franklin Resources, Inc. shapes the asset management landscape. Ameriprise blends advice-driven wealth management with diverse asset products, while Franklin Resources focuses on traditional mutual fund management and alternative investments. This head-to-head spotlights a contest between integrated financial advisory services and specialized asset management. This analysis will reveal which firm’s business model offers superior risk-adjusted returns for a diversified investor in today’s competitive financial services sector.

Table of contents
Companies Overview
Ameriprise Financial and Franklin Resources hold significant positions in the US asset management sector.
Ameriprise Financial, Inc.: Integrated Wealth and Asset Management Leader
Ameriprise Financial dominates as a diversified financial services provider. It generates revenue through advice, wealth management, asset management, and retirement solutions. The firm’s latest strategic focus expands its advisory and insurance products, aiming to deepen client relationships and diversify income streams amid evolving market demands.
Franklin Resources, Inc.: Global Asset Management Specialist
Franklin Resources excels as a public asset management holding company. It earns primarily from launching mutual funds across equity, fixed income, and multi-asset classes. Its 2026 strategy centers on broadening investment offerings and enhancing global reach, leveraging subsidiaries to serve institutional and retail clients worldwide.
Strategic Collision: Similarities & Divergences
Both firms prioritize asset management but diverge in approach: Ameriprise integrates wealth management with advisory services, while Franklin emphasizes mutual fund launches. Their principal battleground lies in capturing retail and institutional investor assets. Ameriprise’s multi-segment model contrasts with Franklin’s fund-centric specialization, revealing distinct risk and growth profiles for investors.
Income Statement Comparison
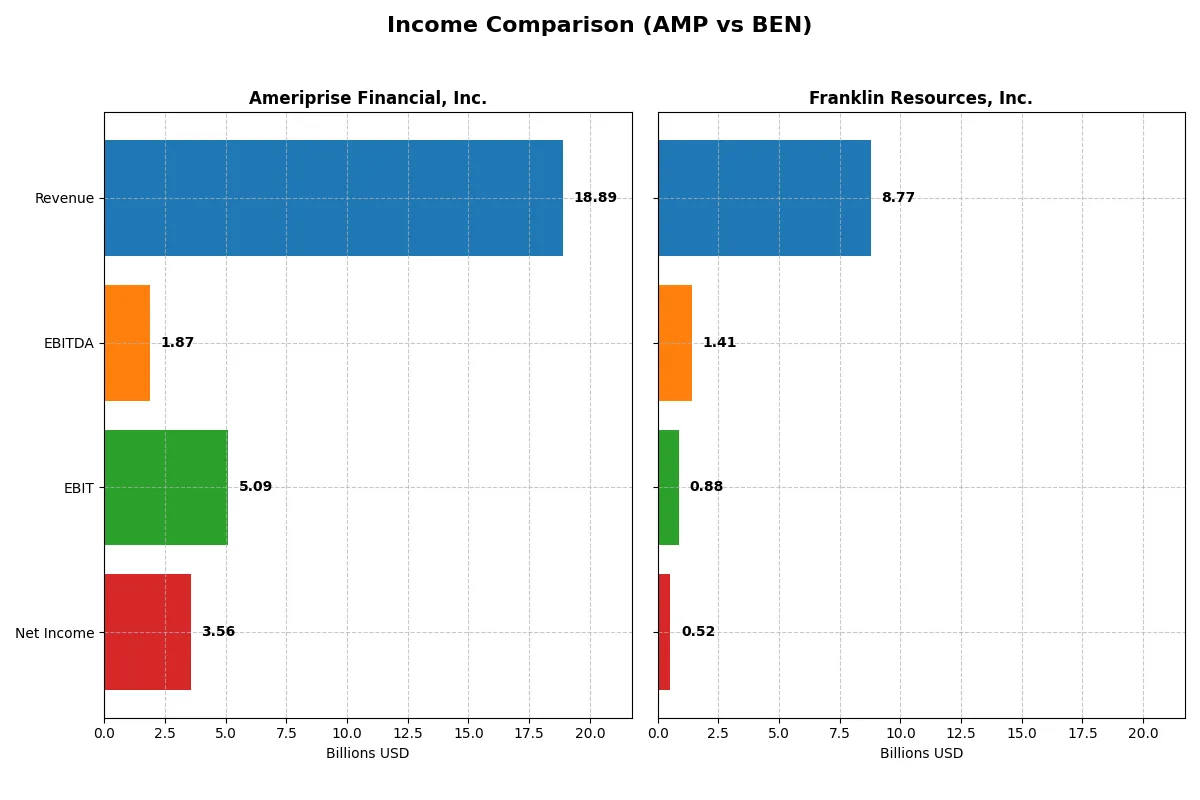
This data dissects the core profitability and scalability of both corporate engines to reveal who dominates the bottom line:
| Metric | Ameriprise Financial, Inc. (AMP) | Franklin Resources, Inc. (BEN) |
|---|---|---|
| Revenue | 18.9B | 8.8B |
| Cost of Revenue | 8.7B | 1.7B |
| Operating Expenses | 5.1B | 6.4B |
| Gross Profit | 10.2B | 7.0B |
| EBITDA | 1.9B | 1.4B |
| EBIT | 5.1B | 882M |
| Interest Expense | 324M | 95M |
| Net Income | 3.6B | 525M |
| EPS | 36.9 | 0.91 |
| Fiscal Year | 2025 | 2025 |
Income Statement Analysis: The Bottom-Line Duel
This income statement comparison reveals each company’s operational efficiency and profitability trends over recent years.
Ameriprise Financial, Inc. Analysis
Ameriprise shows consistent revenue growth, reaching $18.9B in 2025, up 41% since 2021. Net income increased modestly to $3.56B despite a slight dip in gross profit. Margins remain healthy with a 54% gross margin and 19% net margin in 2025, reflecting strong cost control amid rising expenses. Earnings per share rose 10% year-over-year, signaling improving shareholder value.
Franklin Resources, Inc. Analysis
Franklin’s revenue grew moderately to $8.77B in 2025, a 4% rise since 2021. Net income, however, sharply declined by over 70% across five years, settling at $525M in 2025. Gross margin stands robust at 80%, but net margin is a modest 6%, constrained by high operating and other expenses. Despite a 7% EPS increase in 2025, overall profitability momentum lags, highlighting margin pressure.
Margin Strength vs. Profit Scale
Ameriprise delivers superior scale with solid margin retention, driving steady net income growth and EPS expansion. Franklin boasts stronger gross margins but struggles to convert revenue into profit, facing a steep net income decline. For investors, Ameriprise’s profile offers a more compelling blend of growth and profitability resilience.
Financial Ratios Comparison
These vital ratios act as a diagnostic tool to expose the underlying fiscal health, valuation premiums, and capital efficiency of the companies compared below:
| Ratios | Ameriprise Financial, Inc. (AMP) | Franklin Resources, Inc. (BEN) |
|---|---|---|
| ROE | 65.1% (2024) | 4.3% (2025) |
| ROIC | 2.8% (2024) | 1.4% (2025) |
| P/E | 15.8 (2024) | 22.7 (2025) |
| P/B | 10.3 (2024) | 1.0 (2025) |
| Current Ratio | 107.2 (2024) | 2.7 (2025) |
| Quick Ratio | 107.2 (2024) | 2.7 (2025) |
| D/E | 1.05 (2024) | 1.10 (2025) |
| Debt-to-Assets | 3.0% (2024) | 41.1% (2025) |
| Interest Coverage | 19.6 (2024) | 6.4 (2025) |
| Asset Turnover | 0.10 (2024) | 0.27 (2025) |
| Fixed Asset Turnover | 0 (2024) | 5.1 (2025) |
| Payout ratio | 16.9% (2024) | 130.3% (2025) |
| Dividend yield | 1.07% (2024) | 5.75% (2025) |
| Fiscal Year | 2024 | 2025 |
Efficiency & Valuation Duel: The Vital Signs
Financial ratios serve as a company’s DNA, unveiling operational strengths and hidden risks behind the financial statements.
Ameriprise Financial, Inc.
Ameriprise dominates with a robust 54.41% ROE and a strong 18.83% net margin, signaling high profitability. Its valuation metrics appear favorable, though the lack of dividends suggests reinvestment into growth or debt management. However, a concerning 60.75% debt-to-assets ratio and weak current ratios raise liquidity red flags.
Franklin Resources, Inc.
Franklin Resources shows modest profitability with a 4.35% ROE and 5.98% net margin, reflecting restrained efficiency. Its valuation is fairly priced with a 22.67 P/E and a solid 0.99 P/B. The company balances shareholder returns with a 5.75% dividend yield, supported by good liquidity ratios and manageable debt levels.
Profitability Power vs. Stability Edge
Ameriprise offers superior profitability and efficient capital use but carries higher leverage and liquidity risks. Franklin Resources provides steadier financial health with dividends and better liquidity, albeit with lower returns. Investors seeking growth might favor Ameriprise’s profile; those prioritizing income and stability may lean toward Franklin Resources.
Which one offers the Superior Shareholder Reward?
I compare Ameriprise Financial, Inc. (AMP) and Franklin Resources, Inc. (BEN) on dividends, payout ratios, and buybacks. AMP yields 1.07% with a 17% payout ratio, signaling conservative dividend coverage by strong free cash flow (~97%). BEN offers a robust 5.7% yield but with a payout above 130%, risking sustainability. Both firms buy back shares, but AMP’s capital allocation favors balanced dividend growth and buybacks, supporting long-term value. BEN’s high yield masks payout risk and weaker free cash flow coverage (85%). I conclude AMP’s disciplined, sustainable model offers superior total shareholder reward in 2026.
Comparative Score Analysis: The Strategic Profile
The radar chart reveals the core financial DNA and strategic trade-offs of Ameriprise Financial, Inc. and Franklin Resources, Inc.:
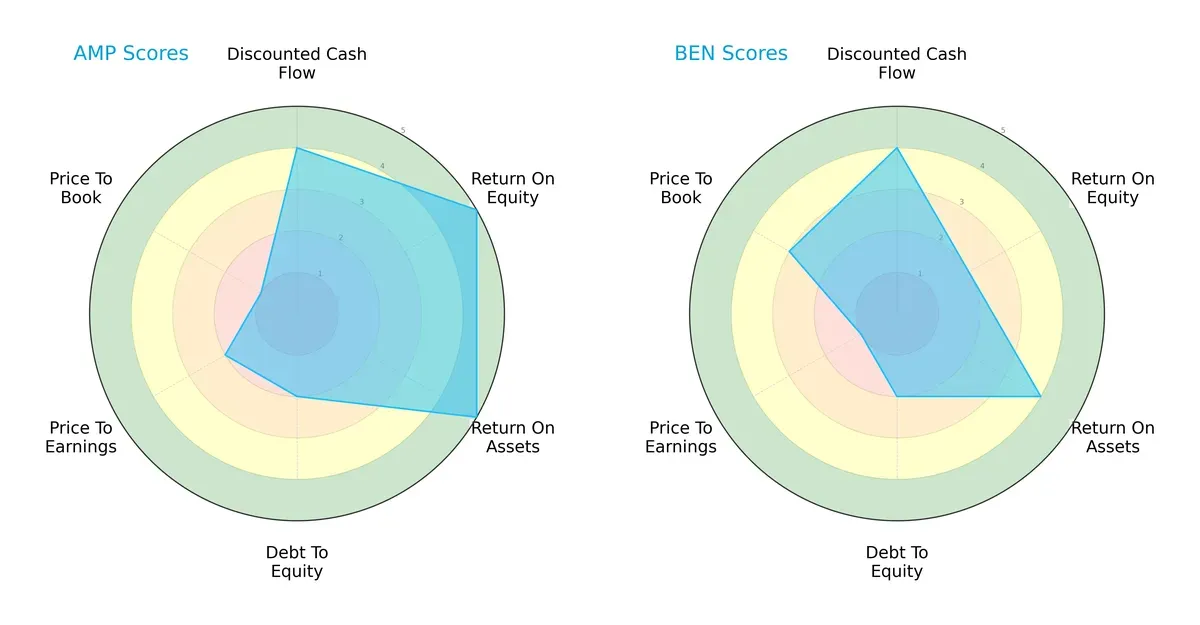
Ameriprise excels in profitability with very favorable ROE (5) and ROA (5) scores, indicating superior asset and equity efficiency. Franklin Resources shows strength in asset utilization (ROA 4) but lags in equity returns (ROE 2). Both share moderate financial risk (Debt/Equity 2). Ameriprise’s valuation scores (PE 2, PB 1) signal potential overvaluation risks, while Franklin Resources’ valuation is more balanced (PE 1, PB 3). Overall, Ameriprise displays a more focused edge on profitability, whereas Franklin Resources offers a more balanced valuation profile.
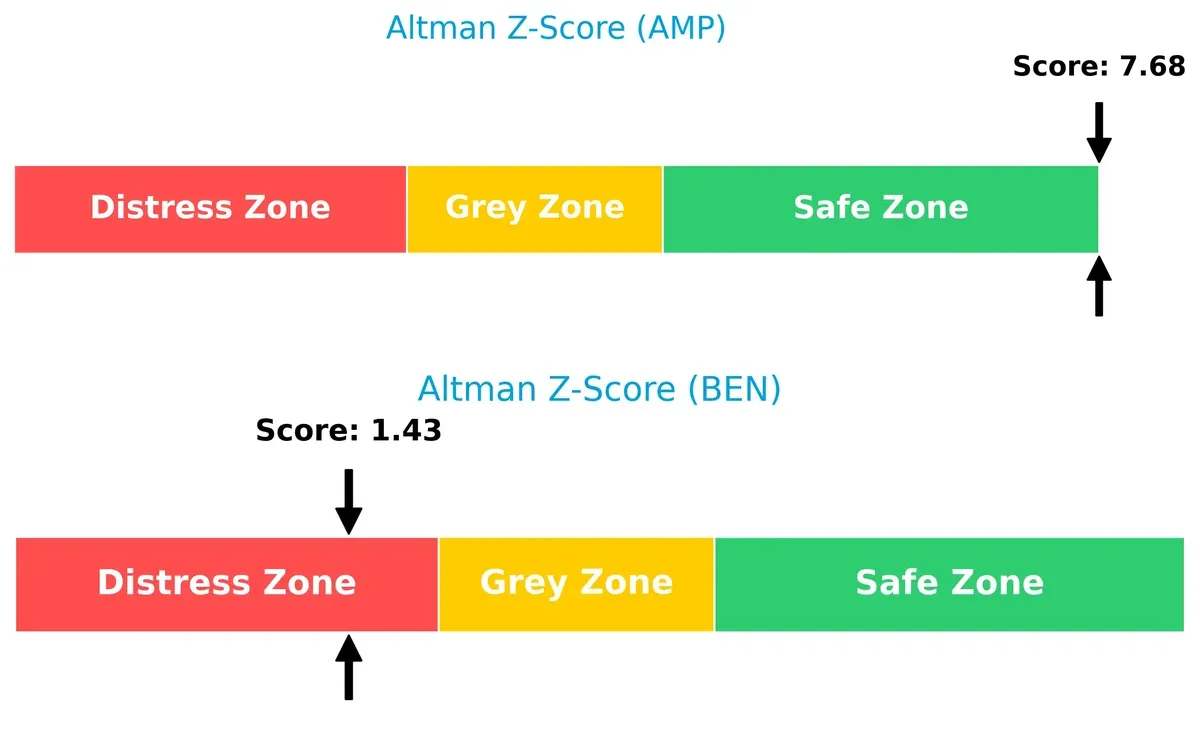
Bankruptcy Risk: Solvency Showdown
Ameriprise’s Altman Z-Score of 7.68 places it firmly in the safe zone, signaling robust solvency and low bankruptcy risk. Franklin Resources’ 1.43 warns of distress, implying significant financial vulnerability in this cycle:
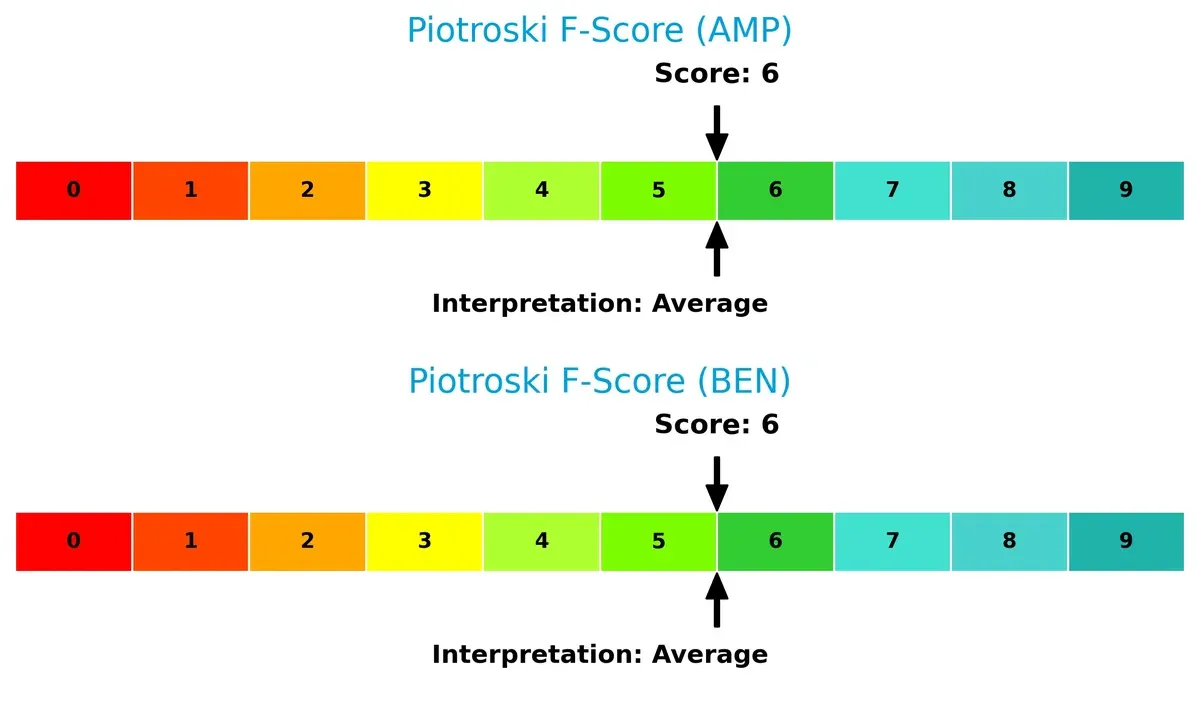
Financial Health: Quality of Operations
Both companies score a 6 on the Piotroski F-Score, indicating average financial health. Neither shows immediate red flags, but neither is in peak operational condition either:
How are the two companies positioned?
This section dissects AMP and BEN’s operational DNA by comparing revenue distribution and internal dynamics. The goal is to confront their economic moats to identify the more resilient competitive advantage.
Revenue Segmentation: The Strategic Mix
This visual comparison dissects how Ameriprise Financial and Franklin Resources diversify their income streams and where their primary sector bets lie:
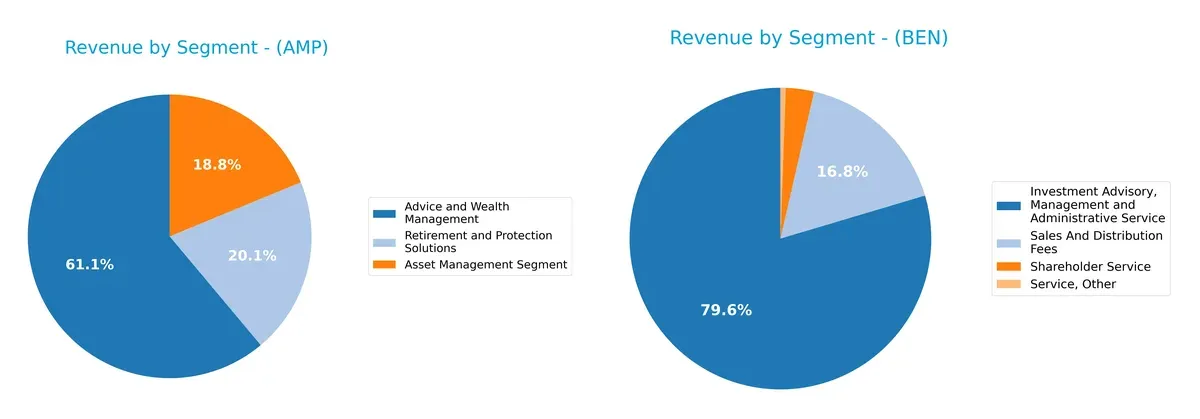
Ameriprise Financial anchors its revenue in Advice and Wealth Management at $11.4B, supported by Asset Management ($3.5B) and Retirement Solutions ($3.8B), showing a balanced mix. Franklin Resources pivots heavily on Investment Advisory services with $6.8B, relying less on secondary streams like Sales and Distribution Fees ($1.38B). Ameriprise’s diversification reduces concentration risk, while Franklin’s focus drives efficiency but raises dependency concerns.
Strengths and Weaknesses Comparison
This table compares the strengths and weaknesses of Ameriprise Financial, Inc. and Franklin Resources, Inc.:
Ameriprise Financial Strengths
- High net margin (18.83%) and ROIC (60.42%) indicate strong profitability
- Favorable asset turnover (1.96) reflects operational efficiency
- Leading market position in Advice and Wealth Management segment
- Strong interest coverage (15.72) ensures debt service ability
Franklin Resources Strengths
- Favorable capital cost (WACC 6.7%) supports value creation
- Strong current and quick ratios (2.71) indicate liquidity
- Favorable fixed asset turnover (5.12) shows efficient asset use
- Global presence with diversified geographic revenue including Luxembourg and US markets
Ameriprise Financial Weaknesses
- Unfavorable liquidity ratios (current and quick ratios at 0) pose short-term risk
- High debt to assets (60.75%) raises leverage concerns
- Lack of dividend yield impacts income investors
- Fixed asset turnover data unavailable or weak
Franklin Resources Weaknesses
- Low ROE (4.35%) and ROIC (1.38%) signal weak profitability
- Unfavorable debt to equity ratio (1.1) indicates higher leverage
- Low asset turnover (0.27) suggests inefficient asset utilization
- Neutral to low dividend yield (5.75%) limits income appeal
Ameriprise exhibits strong profitability and operational efficiency but carries liquidity and leverage risks. Franklin Resources maintains better liquidity and asset efficiency in fixed assets but struggles with profitability and leverage. Both companies show slightly favorable overall financial health, influencing strategic priorities in capital management and growth focus.
The Moat Duel: Analyzing Competitive Defensibility
A structural moat protects long-term profits from competitive erosion. Without it, market gains quickly vanish. Let’s dissect the moats of two asset managers:
Ameriprise Financial, Inc. (AMP): Durable Value Creator through Capital Efficiency
Ameriprise relies on a robust capital allocation moat, evidenced by a 51% ROIC premium over WACC and a soaring 2581% ROIC growth trend. This translates into stable, high margins and growing profitability. Expansion in retirement and protection solutions could deepen its moat in 2026.
Franklin Resources, Inc. (BEN): Struggling Asset Manager with Weak Capital Returns
Franklin’s moat centers on its brand and scale but falters with a negative ROIC gap (-5%) and declining ROIC trend (-81%). Despite a respectable gross margin, profitability erodes, risking market share amid evolving client demands. Growth opportunities hinge on product innovation and global diversification.
Capital Efficiency vs. Brand Strength: The Moat Battle
Ameriprise’s capital efficiency creates a wider, more durable moat than Franklin’s brand-based advantage. AMP’s rising profitability equips it better to defend and grow market share in a competitive 2026 landscape. Franklin faces urgent challenges to reverse value destruction.
Which stock offers better returns?
Over the past year, Ameriprise Financial, Inc. showed strong upward momentum with accelerating gains, while Franklin Resources, Inc. experienced a contrasting decline despite recent recovery signs.
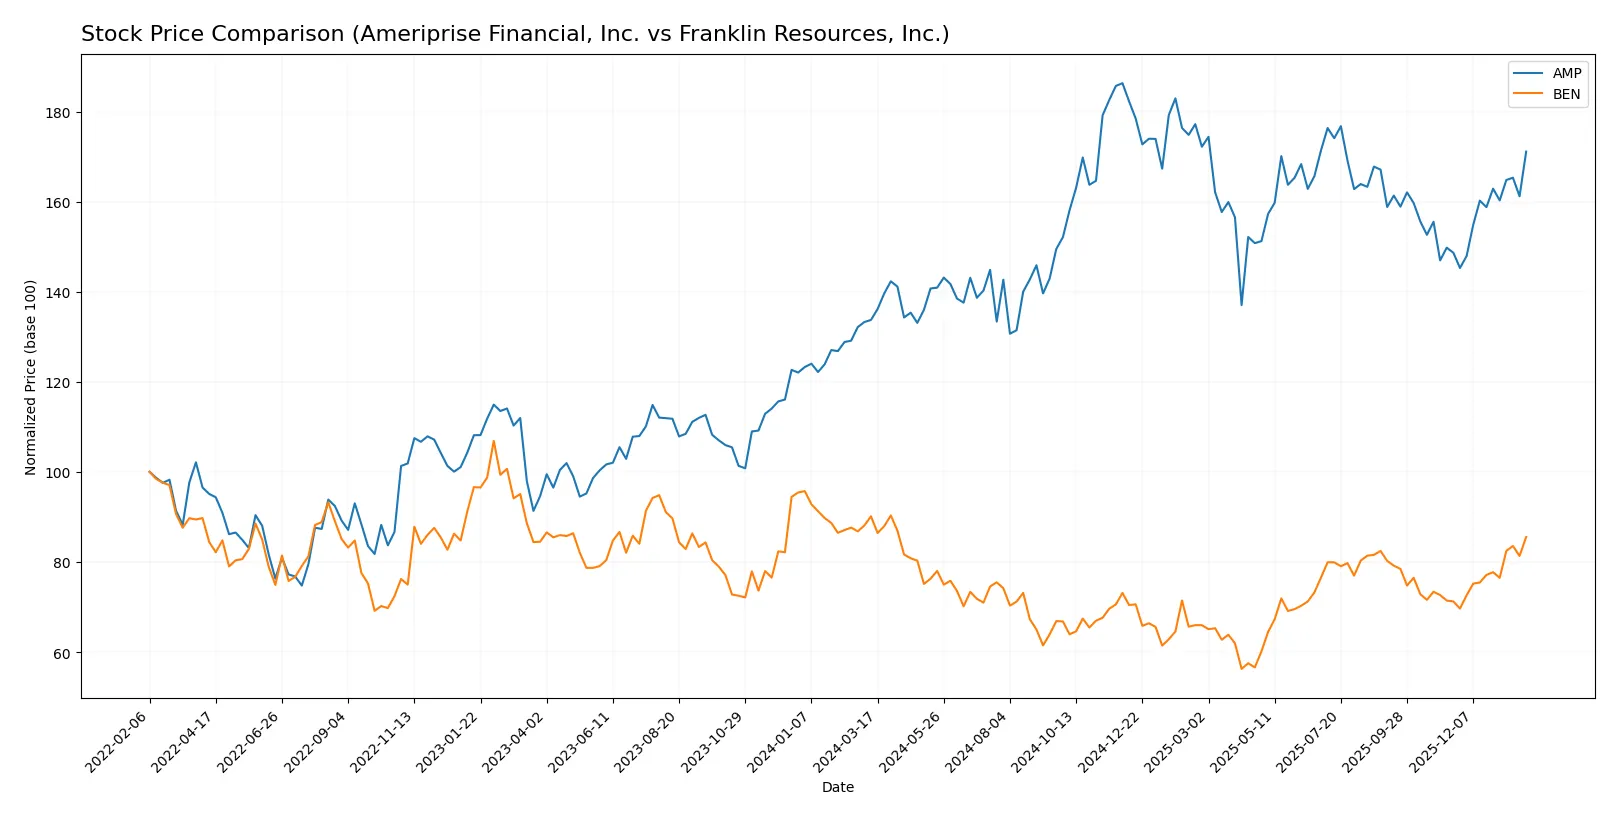
Trend Comparison
Ameriprise Financial, Inc. posted a 27.96% price increase over 12 months, confirming a bullish trend with acceleration. Its volatility is high, with prices ranging from 403 to 574.
Franklin Resources, Inc. declined 5.1% over the same period, reflecting a bearish trend despite accelerating movement. Volatility remains low, with a narrow price band between 17.5 and 28.1.
Ameriprise outperformed Franklin by a wide margin in market performance, showing sustained gains versus Franklin’s overall decline despite recent upward shifts.
Target Prices
Analysts provide a clear target consensus for Ameriprise Financial and Franklin Resources, reflecting moderate upside potential.
| Company | Target Low | Target High | Consensus |
|---|---|---|---|
| Ameriprise Financial, Inc. | 485 | 570 | 528.33 |
| Franklin Resources, Inc. | 25 | 25 | 25 |
The target consensus for Ameriprise Financial slightly exceeds its current price of 527.19, indicating modest appreciation potential. Franklin Resources’ target sits below its current 26.62, suggesting a neutral to cautious outlook from analysts.

Don’t Let Luck Decide Your Entry Point
Optimize your entry points with our advanced ProRealTime indicators. You’ll get efficient buy signals with precise price targets for maximum performance. Start outperforming now!
How do institutions grade them?
This section compares the latest institutional grades assigned to Ameriprise Financial, Inc. and Franklin Resources, Inc.:
Ameriprise Financial, Inc. Grades
The table below summarizes recent grades from major financial institutions for Ameriprise Financial:
| Grading Company | Action | New Grade | Date |
|---|---|---|---|
| Piper Sandler | Upgrade | Neutral | 2026-01-30 |
| Morgan Stanley | Maintain | Underweight | 2025-12-22 |
| Argus Research | Maintain | Buy | 2025-11-13 |
| RBC Capital | Maintain | Outperform | 2025-11-03 |
| Keefe, Bruyette & Woods | Maintain | Market Perform | 2025-11-03 |
| Evercore ISI Group | Maintain | In Line | 2025-10-09 |
| Morgan Stanley | Maintain | Underweight | 2025-10-01 |
| RBC Capital | Maintain | Outperform | 2025-07-30 |
| Raymond James | Maintain | Strong Buy | 2025-07-25 |
| William Blair | Downgrade | Market Perform | 2025-07-25 |
Franklin Resources, Inc. Grades
Below are recent institutional grades for Franklin Resources from recognized financial firms:
| Grading Company | Action | New Grade | Date |
|---|---|---|---|
| Barclays | Maintain | Underweight | 2026-01-15 |
| TD Cowen | Maintain | Buy | 2026-01-14 |
| Barclays | Maintain | Underweight | 2025-12-12 |
| JP Morgan | Maintain | Neutral | 2025-11-10 |
| Barclays | Maintain | Underweight | 2025-10-21 |
| Evercore ISI Group | Maintain | Underperform | 2025-10-09 |
| B of A Securities | Maintain | Underperform | 2025-10-02 |
| Morgan Stanley | Maintain | Underweight | 2025-08-12 |
| Evercore ISI Group | Maintain | Underperform | 2025-08-04 |
| JP Morgan | Maintain | Neutral | 2025-08-04 |
Which company has the best grades?
Ameriprise Financial displays a wider range of positive ratings, including Buy, Outperform, and Strong Buy grades. Franklin Resources predominantly holds Underweight and Underperform grades. This disparity suggests Ameriprise might attract more investor confidence, while Franklin Resources faces more cautious outlooks from institutions.
Risks specific to each company
The following categories identify the critical pressure points and systemic threats facing both firms in the 2026 market environment:
1. Market & Competition
Ameriprise Financial, Inc.
- Strong profitability and ROIC indicate competitive strength despite pressure in asset management fees.
Franklin Resources, Inc.
- Lower margins and returns suggest weaker competitive positioning and challenges gaining market share.
2. Capital Structure & Debt
Ameriprise Financial, Inc.
- Leverage is high with 60.75% debt to assets, signaling moderate financial risk. Interest coverage remains comfortable.
Franklin Resources, Inc.
- Moderate debt levels at 41.09% debt to assets but higher debt-to-equity ratio (1.1) increases financial vulnerability.
3. Stock Volatility
Ameriprise Financial, Inc.
- Beta of 1.256 shows moderate sensitivity to market swings, reflecting stable investor confidence.
Franklin Resources, Inc.
- Higher beta at 1.465 indicates greater stock price volatility and risk for investors.
4. Regulatory & Legal
Ameriprise Financial, Inc.
- Operates in a heavily regulated sector but has a long track record of compliance and risk management.
Franklin Resources, Inc.
- Similar regulatory environment but smaller scale may increase exposure to compliance costs and legal risks.
5. Supply Chain & Operations
Ameriprise Financial, Inc.
- Diverse service segments mitigate operational risks but reliance on financial markets adds systemic risk.
Franklin Resources, Inc.
- Concentrated asset management services present operational risk if market conditions deteriorate.
6. ESG & Climate Transition
Ameriprise Financial, Inc.
- ESG integration is improving but requires ongoing investment to meet evolving investor expectations.
Franklin Resources, Inc.
- ESG efforts are less documented, potentially risking investor appeal amid rising sustainability mandates.
7. Geopolitical Exposure
Ameriprise Financial, Inc.
- Global client base provides diversification but subjects firm to geopolitical volatility and regulatory shifts.
Franklin Resources, Inc.
- Smaller international footprint reduces geopolitical risk but limits growth opportunities abroad.
Which company shows a better risk-adjusted profile?
Ameriprise faces its largest risk in elevated leverage and debt levels despite strong profitability. Franklin Resources’ main risk is weaker returns coupled with higher stock volatility. Ameriprise’s superior Altman Z-score (7.68 vs. 1.43) and stable earnings justify a better risk-adjusted profile. Franklin’s distress zone score signals caution. The contrast in financial stability and market responsiveness firmly favors Ameriprise.
Final Verdict: Which stock to choose?
Ameriprise Financial, Inc. (AMP) shines with a durable competitive advantage fueled by a robust return on invested capital far exceeding its cost of capital. Its core strength lies in efficient capital allocation and consistent value creation. However, investors should watch its high debt-to-assets ratio as a point of vigilance. AMP suits portfolios seeking aggressive growth with a focus on strong profitability.
Franklin Resources, Inc. (BEN) brings a strategic moat rooted in steady cash flow and moderate valuation supported by a solid current ratio. While its profitability metrics lag AMP, BEN offers a comparatively safer balance sheet and dividend yield, fitting well within GARP (Growth at a Reasonable Price) strategies targeting income and stability.
If you prioritize strong value creation and high profitability, AMP outshines as the compelling choice due to its superior ROIC and growth trajectory. However, if you seek better stability and income with moderate growth, BEN offers a safer profile and attractive dividend potential despite its weaker moat. Both present analytical scenarios tailored to distinct investor profiles.
Disclaimer: Investment carries a risk of loss of initial capital. The past performance is not a reliable indicator of future results. Be sure to understand risks before making an investment decision.
Go Further
I encourage you to read the complete analyses of Ameriprise Financial, Inc. and Franklin Resources, Inc. to enhance your investment decisions: