Home > Comparison > Financial Services > BX vs AMP
The strategic rivalry between Blackstone Inc. and Ameriprise Financial, Inc. defines the current trajectory of the financial services sector. Blackstone operates as a capital-intensive alternative asset manager with a global footprint in private equity and real estate. Ameriprise focuses on high-margin wealth management and advisory services targeting retail and institutional clients. This analysis seeks to determine which business model offers superior risk-adjusted returns for a diversified portfolio amid evolving market dynamics.

Table of contents
Companies Overview
Blackstone Inc. and Ameriprise Financial, Inc. stand as titans in the asset management industry, shaping global financial landscapes.
Blackstone Inc.: Alternative Asset Powerhouse
Blackstone Inc. dominates alternative asset management with a focus on real estate, private equity, and credit. Its core revenue arises from managing opportunistic investments across multiple asset classes globally. In 2026, it sharpens its strategic focus on expanding its global footprint, especially in Asia and Latin America, while leveraging diversified strategies in real estate and private equity to drive long-term growth.
Ameriprise Financial, Inc.: Comprehensive Wealth Manager
Ameriprise Financial delivers broad financial services centered on advice, wealth management, and asset management. It generates revenue through personalized financial planning, brokerage services, and diverse investment products catering to retail and institutional clients. The 2026 strategy emphasizes deepening client relationships via integrated advice and retirement solutions, while expanding its asset management offerings including mutual funds and ETFs.
Strategic Collision: Similarities & Divergences
Both firms excel in asset management but diverge sharply in approach: Blackstone pursues a closed ecosystem of alternative investments with global reach, whereas Ameriprise adopts an open, client-centric wealth management model. Their primary battleground is the race for institutional and high-net-worth client assets. Blackstone offers high-risk, high-reward alternatives; Ameriprise provides steady, diversified income streams, reflecting distinct risk and growth investment profiles.
Income Statement Comparison
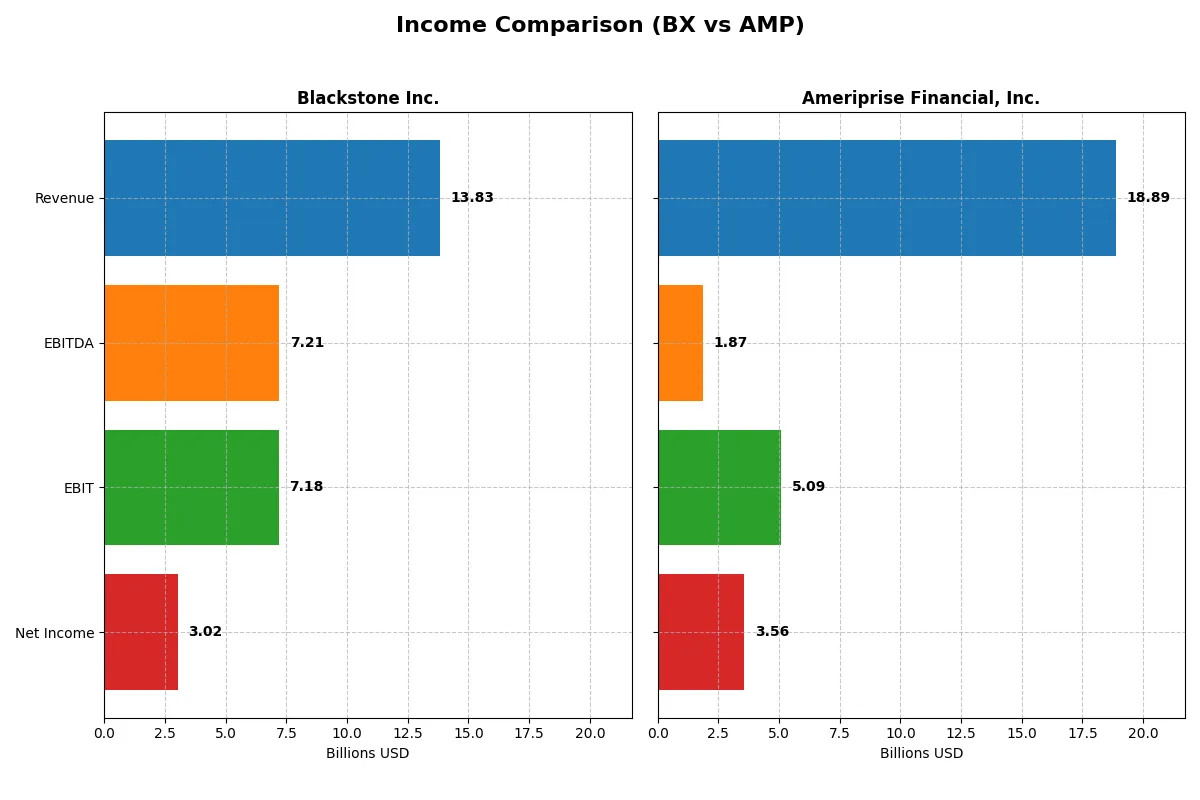
This data dissects the core profitability and scalability of both corporate engines to reveal who dominates the bottom line:
| Metric | Blackstone Inc. (BX) | Ameriprise Financial, Inc. (AMP) |
|---|---|---|
| Revenue | 13.8B | 18.9B |
| Cost of Revenue | 1.9B | 8.7B |
| Operating Expenses | 4.7B | 5.1B |
| Gross Profit | 11.9B | 10.2B |
| EBITDA | 7.2B | 1.9B |
| EBIT | 7.2B | 5.1B |
| Interest Expense | 0.5B | 0.3B |
| Net Income | 3.0B | 3.6B |
| EPS | 3.88 | 36.9 |
| Fiscal Year | 2025 | 2025 |
Income Statement Analysis: The Bottom-Line Duel
The forthcoming income statement comparison reveals which company operates with greater financial efficiency and sustainable profitability.
Blackstone Inc. Analysis
Blackstone’s revenue shows strong recovery, reaching $13.8B in 2025 after a dip in 2023, yet its net income lags at $3B with a 21.8% net margin. The firm maintains a robust gross margin of 86%, reflecting tight cost control and operational leverage. Despite a 21.6% revenue jump in 2025, net margin declined by 10.6%, signaling margin pressure amid scaling.
Ameriprise Financial, Inc. Analysis
Ameriprise’s revenue steadily climbs to $18.9B in 2025, with net income at $3.56B and a respectable 18.9% net margin. Gross margin contracts slightly but remains healthy at 54%. EBIT fell 21% year-over-year, highlighting operational challenges. However, the company’s EPS rose 10%, showing resilience in earnings per share despite margin headwinds.
Margin Dominance vs. Revenue Growth
Blackstone excels in margin dominance with an 86% gross margin and superior EBIT margin of 52%, outperforming Ameriprise’s 54% and 27%, respectively. Ameriprise leads in revenue scale and growth consistency, expanding 41% over five years versus Blackstone’s 18% decline. Investors favoring margin stability may prefer Blackstone’s profile, while those prioritizing top-line growth and EPS momentum might lean toward Ameriprise.
Financial Ratios Comparison
These vital ratios act as a diagnostic tool to expose the underlying fiscal health, valuation premiums, and capital efficiency of the companies compared below:
| Ratios | Blackstone Inc. (BX) | Ameriprise Financial, Inc. (AMP) |
|---|---|---|
| ROE | 0.00 | 0.54 |
| ROIC | 0.00 | 0.60 |
| P/E | 39.87 | 0.00 |
| P/B | 0.00 | 0.00 |
| Current Ratio | 0.00 | 0.00 |
| Quick Ratio | 0.00 | 0.00 |
| D/E | 0.00 | 0.90 |
| Debt-to-Assets | 0.00 | 0.61 |
| Interest Coverage | 14.12 | 0.00 |
| Asset Turnover | 0.00 | 1.96 |
| Fixed Asset Turnover | 0.00 | 0.00 |
| Payout Ratio | 1.21 | 0.00 |
| Dividend Yield | 3.04% | 0.00% |
| Fiscal Year | 2025 | 2025 |
Efficiency & Valuation Duel: The Vital Signs
Financial ratios act as a company’s DNA, uncovering hidden risks and measuring operational excellence behind headline figures.
Blackstone Inc.
Blackstone posts a solid 21.83% net margin but lacks return on equity and invested capital data, signaling opaque profitability. Its P/E ratio of 39.87 marks the stock as stretched. A 3.04% dividend yield rewards shareholders, indicating steady income despite some unfavorable liquidity ratios.
Ameriprise Financial, Inc.
Ameriprise delivers a robust 54.41% ROE and 60.42% ROIC, demonstrating operational efficiency. Its net margin of 18.83% is healthy, while P/E data is unavailable, complicating valuation judgment. The company pays no dividend, hinting at reinvestment into growth or strategic initiatives. Debt levels raise caution with a 60.75% debt-to-assets ratio.
Premium Valuation vs. Operational Safety
Blackstone’s stretched valuation contrasts with Ameriprise’s superior profitability and moderate risk profile. Ameriprise offers a better balance of operational efficiency and controlled leverage. Investors seeking growth may prefer Ameriprise’s robust returns, while income-focused profiles might weigh Blackstone’s dividend yield.
Which one offers the Superior Shareholder Reward?
Blackstone (BX) delivers a stronger shareholder reward than Ameriprise (AMP) in 2026. BX offers a 3.0%-3.3% dividend yield with payout ratios exceeding 100%, signaling aggressive distributions backed by solid free cash flow. BX maintains a sizable buyback program, enhancing total returns. AMP’s yield lingers near 1.0%-1.4% with modest payout ratios (~15%-20%), favoring reinvestment over dividends. BX’s model risks sustainability due to high payout ratios but compensates with robust cash flow and buybacks. AMP prioritizes capital preservation and growth with restrained payouts. Given BX’s higher yield, active buybacks, and cash flow coverage, I see BX as the superior total return choice for income-focused investors in 2026.
Comparative Score Analysis: The Strategic Profile
The radar chart reveals the fundamental DNA and strategic trade-offs of Blackstone Inc. and Ameriprise Financial, Inc.:
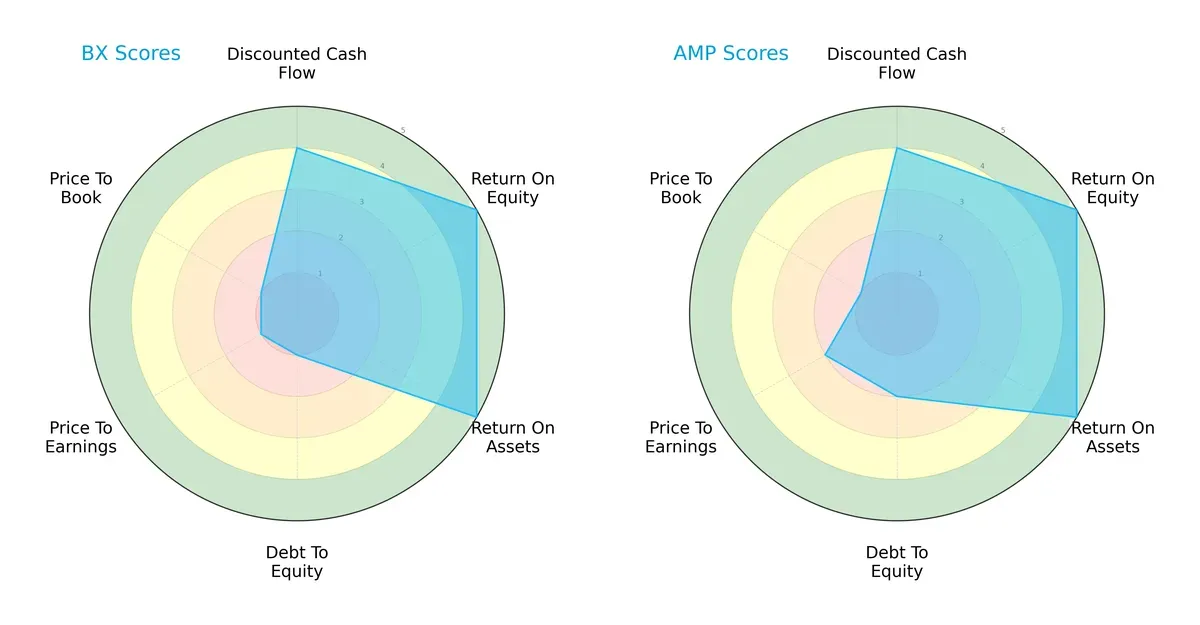
Both firms share top-tier operational efficiency, scoring a 5 in ROE and ROA, indicating strong asset and equity utilization. Blackstone, however, struggles with financial leverage and valuation, scoring a 1 in Debt/Equity, P/E, and P/B, exposing balance sheet risks and potential overvaluation. Ameriprise shows a more balanced profile, with moderate scores in Debt/Equity and valuation metrics, suggesting prudent capital structure management. Blackstone leans heavily on operational excellence but bears financial risk, while Ameriprise offers steadier fundamentals.
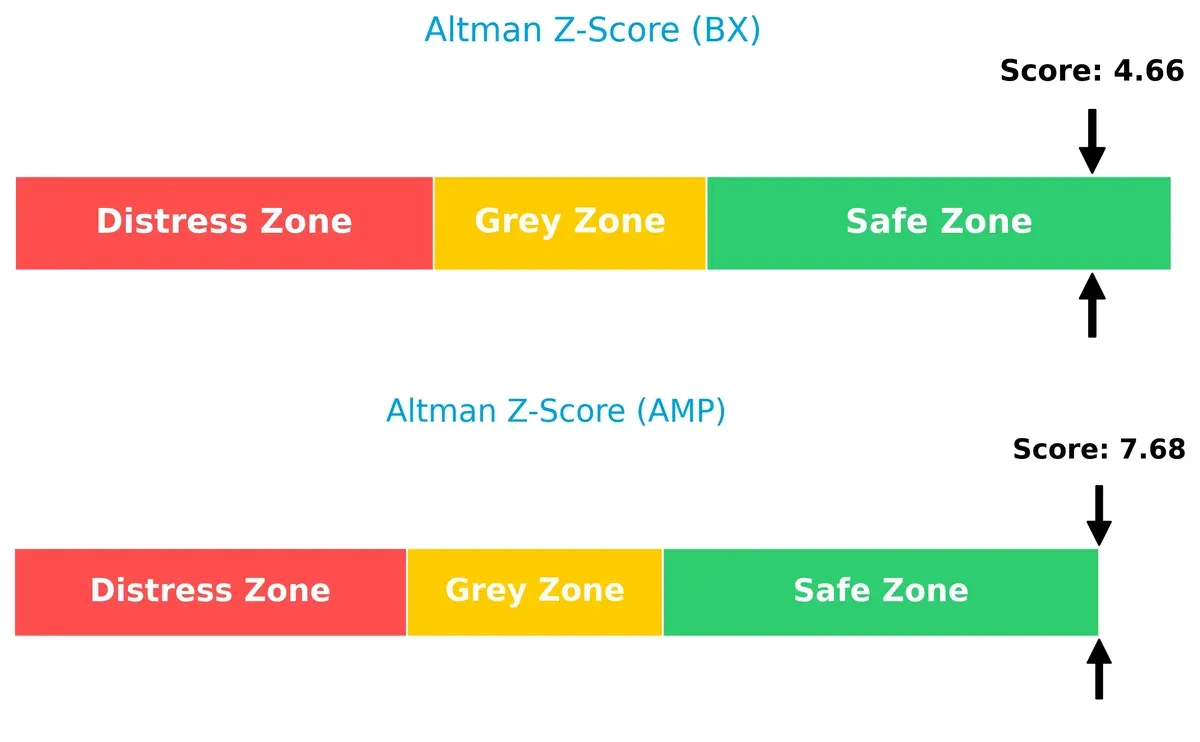
Bankruptcy Risk: Solvency Showdown
The Altman Z-Score gap highlights Ameriprise’s stronger solvency position versus Blackstone, signaling lower bankruptcy risk for long-term investors in this cycle:
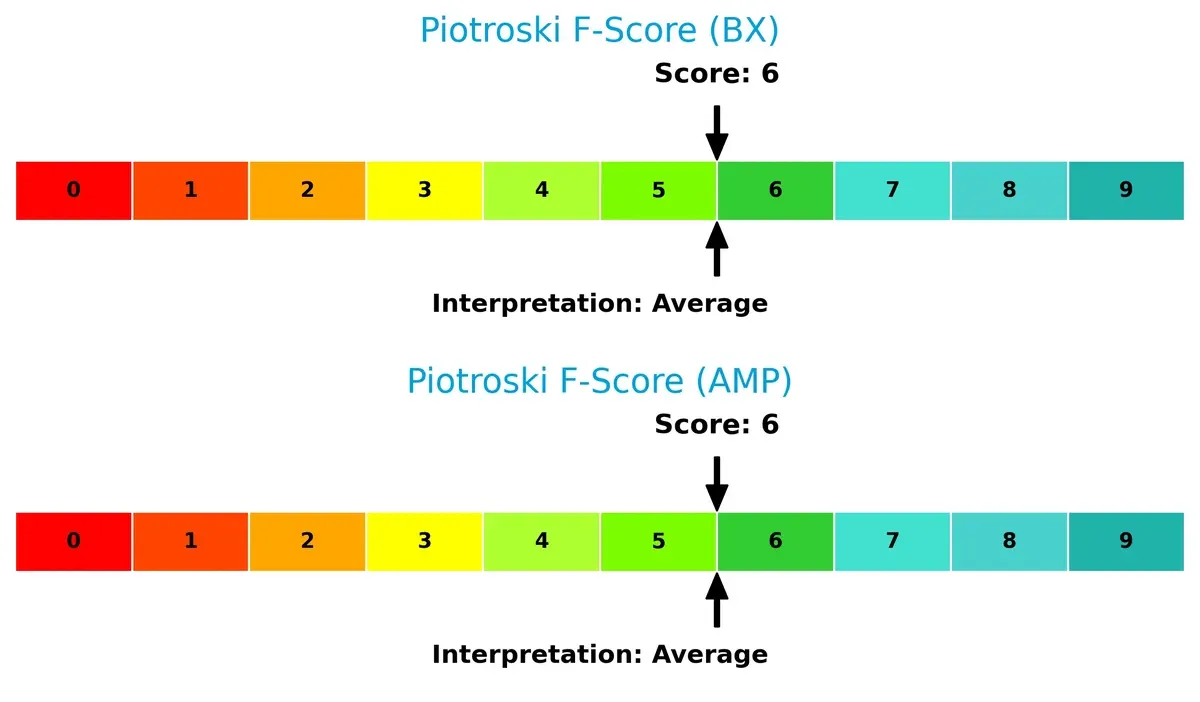
Financial Health: Quality of Operations
Both companies register a Piotroski F-Score of 6, signaling average financial health without critical red flags. Investors should monitor operational consistency closely:
How are the two companies positioned?
This section dissects the operational DNA of BX and AMP by comparing their revenue distribution by segment and internal dynamics. The goal is to confront their economic moats to reveal which model offers the most resilient, sustainable competitive advantage today.
Revenue Segmentation: The Strategic Mix
The following comparison dissects how Blackstone Inc. and Ameriprise Financial, Inc. diversify their income streams and highlights their primary sector bets:
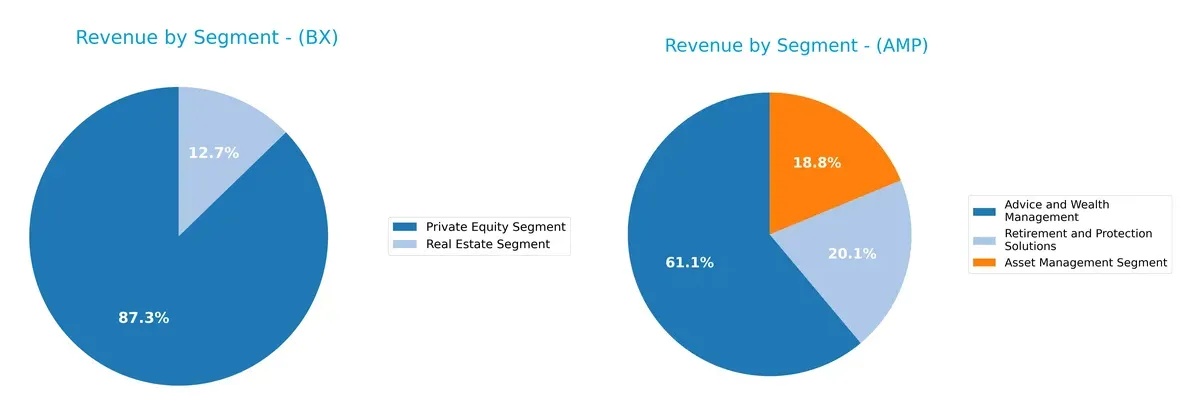
Blackstone leans heavily on its Private Equity Segment, generating $1.39B in 2024, dwarfing its $203M Real Estate revenue. This concentration suggests strong ecosystem lock-in but raises concentration risk. Ameriprise delivers a more balanced portfolio: Advice and Wealth Management anchors at $11.4B, supported by $3.5B in Asset Management and $3.77B in Retirement Solutions. This diversified mix lowers volatility and leverages multiple growth engines.
Strengths and Weaknesses Comparison
This table compares the strengths and weaknesses of Blackstone Inc. and Ameriprise Financial, Inc.:
Blackstone Inc. Strengths
- Diversified segments including Private Equity, Real Estate, Hedge Funds
- Favorable net margin at 21.83%
- Strong interest coverage at 14.12
- Low debt-to-assets ratio
- Consistent dividend yield of 3.04%
Ameriprise Financial, Inc. Strengths
- High profitability with ROE 54.41% and ROIC 60.42%
- Favorable net margin at 18.83%
- Strong asset turnover at 1.96
- Favorable interest coverage at 15.72
- Diversified revenue from Advice, Asset Management, Retirement segments
Blackstone Inc. Weaknesses
- Unfavorable ROE and ROIC at 0%
- Unavailable WACC complicates cost of capital assessment
- Unfavorable liquidity ratios (current and quick ratios)
- High P/E ratio at 39.87
- Low asset and fixed asset turnover
Ameriprise Financial, Inc. Weaknesses
- High debt-to-assets ratio at 60.75%
- Unfavorable liquidity ratios (current and quick ratios)
- No dividend yield reported
- Neutral debt-to-equity level at 0.9
- Unfavorable fixed asset turnover
Both companies show diversified revenue streams and solid profitability metrics but face liquidity challenges. Blackstone’s lack of ROE and ROIC data contrasts with Ameriprise’s leverage concerns. Each must manage these weaknesses carefully to sustain competitive advantage.
The Moat Duel: Analyzing Competitive Defensibility
A structural moat is the only safeguard for long-term profits against relentless competition erosion. Let’s dissect the moats of two asset management giants:
Blackstone Inc.: Diversified Asset Mastery
Blackstone’s moat stems from its broad alternative asset expertise and scale, reflected in high gross (86%) and EBIT (52%) margins. Yet, declining ROIC points to potential moat pressure in 2026.
Ameriprise Financial, Inc.: Advice-Driven Client Lock-in
Ameriprise leans on strong client relationships and diversified financial advice services, yielding solid net margins (~19%) and a sharply rising ROIC, signaling a widening moat and growth opportunities.
Verdict: Alternative Scale vs. Client-Centric Durability
Ameriprise’s growing ROIC and value creation trump Blackstone’s declining capital efficiency. I see Ameriprise as possessing the deeper moat, better poised to defend and expand market share in 2026.
Which stock offers better returns?
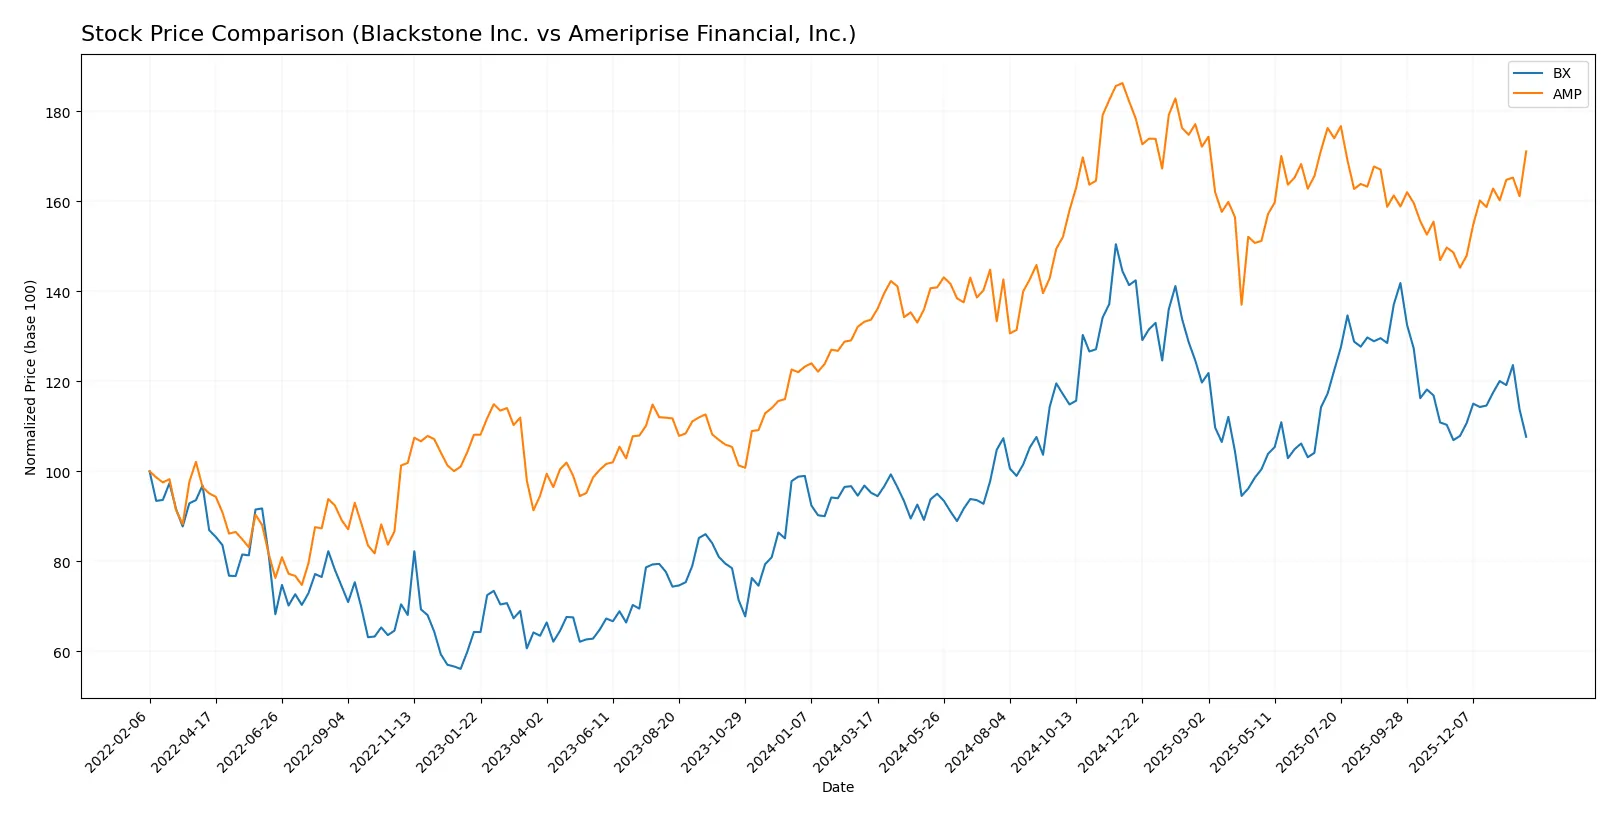
Stock prices for Blackstone Inc. (BX) and Ameriprise Financial, Inc. (AMP) showed notable bullish momentum over the past 12 months, with distinct acceleration patterns and varying volatility profiles.
Trend Comparison
Blackstone Inc. (BX) recorded a 13.04% price increase over the last year, confirming a bullish trend with accelerating gains. The stock ranged from a low of 117.62 to a high of 199.05, exhibiting moderate volatility (std. dev. 20.31).
Ameriprise Financial, Inc. (AMP) outperformed with a 27.96% rise in the same period, also under an accelerating bullish trend. AMP’s price fluctuated between 402.61 and 573.97, reflecting higher volatility (std. dev. 45.04).
Comparing trends, AMP delivered the stronger market performance with nearly double the price appreciation of BX, supported by higher volatility and acceleration.
Target Prices
Analysts present a clear consensus on target prices for Blackstone Inc. and Ameriprise Financial, Inc.
| Company | Target Low | Target High | Consensus |
|---|---|---|---|
| Blackstone Inc. | 164 | 215 | 179.83 |
| Ameriprise Financial, Inc. | 485 | 570 | 528.33 |
The consensus targets for both companies exceed their current prices, signaling analyst optimism. Blackstone’s target suggests a 26% upside, while Ameriprise’s aligns closely with its current price, implying limited near-term appreciation.

Don’t Let Luck Decide Your Entry Point
Optimize your entry points with our advanced ProRealTime indicators. You’ll get efficient buy signals with precise price targets for maximum performance. Start outperforming now!
How do institutions grade them?
Blackstone Inc. Grades
The following table lists recent grade updates from key financial institutions for Blackstone Inc.:
| Grading Company | Action | New Grade | Date |
|---|---|---|---|
| JP Morgan | Maintain | Neutral | 2026-01-30 |
| Barclays | Maintain | Equal Weight | 2026-01-30 |
| Citizens | Maintain | Market Outperform | 2026-01-30 |
| TD Cowen | Maintain | Buy | 2026-01-30 |
| TD Cowen | Maintain | Buy | 2026-01-14 |
| UBS | Maintain | Neutral | 2026-01-13 |
| Barclays | Maintain | Equal Weight | 2026-01-09 |
| Barclays | Maintain | Equal Weight | 2025-12-12 |
| TD Cowen | Maintain | Buy | 2025-10-24 |
| Piper Sandler | Maintain | Neutral | 2025-10-24 |
Ameriprise Financial, Inc. Grades
Below are recent grade updates from recognized financial firms for Ameriprise Financial, Inc.:
| Grading Company | Action | New Grade | Date |
|---|---|---|---|
| Piper Sandler | Upgrade | Neutral | 2026-01-30 |
| Morgan Stanley | Maintain | Underweight | 2025-12-22 |
| Argus Research | Maintain | Buy | 2025-11-13 |
| RBC Capital | Maintain | Outperform | 2025-11-03 |
| Keefe, Bruyette & Woods | Maintain | Market Perform | 2025-11-03 |
| Evercore ISI Group | Maintain | In Line | 2025-10-09 |
| Morgan Stanley | Maintain | Underweight | 2025-10-01 |
| RBC Capital | Maintain | Outperform | 2025-07-30 |
| Raymond James | Maintain | Strong Buy | 2025-07-25 |
| William Blair | Downgrade | Market Perform | 2025-07-25 |
Which company has the best grades?
Ameriprise Financial shows a wider range of grades including Strong Buy and Outperform ratings. Blackstone’s grades concentrate near Neutral and Buy. This diversity for Ameriprise may suggest varied analyst optimism, affecting investor sentiment differently than Blackstone’s more consistent ratings.
Risks specific to each company
The following categories identify the critical pressure points and systemic threats facing both firms in the 2026 market environment:
1. Market & Competition
Blackstone Inc.
- Dominates alternative asset management but faces fierce competition in private equity and real estate sectors globally.
Ameriprise Financial, Inc.
- Competes broadly in wealth management and asset management, contending with large diversified financial services firms.
2. Capital Structure & Debt
Blackstone Inc.
- Exhibits a favorable debt-to-equity profile with strong interest coverage, signaling prudent leverage management.
Ameriprise Financial, Inc.
- Carries higher debt-to-assets ratio (60.75%), presenting moderate leverage risk despite solid interest coverage.
3. Stock Volatility
Blackstone Inc.
- Beta at 1.75 indicates above-market volatility, increasing risk during downturns.
Ameriprise Financial, Inc.
- Lower beta of 1.26 suggests more stable stock performance relative to market swings.
4. Regulatory & Legal
Blackstone Inc.
- Operates across multiple jurisdictions with complex regulatory environments, increasing compliance risk.
Ameriprise Financial, Inc.
- Subject to stringent financial advisory and insurance regulations, with potential exposure to litigation in wealth management.
5. Supply Chain & Operations
Blackstone Inc.
- Operational complexity across diverse asset classes and geographies can strain management and impact returns.
Ameriprise Financial, Inc.
- Relies heavily on service delivery and technology platforms, vulnerable to operational disruptions and cyber risks.
6. ESG & Climate Transition
Blackstone Inc.
- Active investments in alternative energy and greenfield projects expose it to transition risks but also growth opportunities.
Ameriprise Financial, Inc.
- Faces pressure to integrate ESG into investment products and advisory, with reputational risk if lagging peers.
7. Geopolitical Exposure
Blackstone Inc.
- Significant international footprint including Asia and Latin America exposes it to geopolitical volatility.
Ameriprise Financial, Inc.
- Primarily U.S.-focused but with global clients, less direct geopolitical risk but sensitive to global market shifts.
Which company shows a better risk-adjusted profile?
Ameriprise Financial faces notable leverage risk with a high debt-to-assets ratio but benefits from lower stock volatility and stronger profitability metrics. Blackstone, while well capitalized, contends with higher market volatility and complex global operations. The critical risk for Blackstone lies in market competition and regulatory complexity. Ameriprise’s biggest vulnerability is its elevated leverage. Given its more favorable Altman Z-Score (7.68 vs. 4.66) and consistent profitability, Ameriprise presents a stronger risk-adjusted profile. However, Blackstone’s diversified asset base and ESG initiatives may offer long-term resilience worth monitoring.
Final Verdict: Which stock to choose?
Blackstone Inc. shines as a cash machine with robust income quality and a strong dividend yield. Its core strength lies in generating high margins, yet investors should watch its declining ROIC trend as a potential long-term concern. Blackstone suits aggressive growth portfolios seeking market leadership in alternative asset management.
Ameriprise Financial stands out with a durable moat, evidenced by a growing ROIC well above its cost of capital. Its strategic advantage stems from efficient capital allocation and consistent value creation. Compared to Blackstone, Ameriprise offers better stability, fitting growth-at-a-reasonable-price (GARP) portfolios favoring sustainable profitability.
If you prioritize aggressive growth and current income, Blackstone appeals due to its cash generation and dividend profile despite ROIC headwinds. However, if seeking durable competitive advantage and superior capital efficiency, Ameriprise outshines with a more favorable long-term moat and financial stability. Both present analytical scenarios worth considering relative to your risk tolerance and investment horizon.
Disclaimer: Investment carries a risk of loss of initial capital. The past performance is not a reliable indicator of future results. Be sure to understand risks before making an investment decision.
Go Further
I encourage you to read the complete analyses of Blackstone Inc. and Ameriprise Financial, Inc. to enhance your investment decisions: