Home > Comparison > Financial Services > BLK vs AMP
The strategic rivalry between BlackRock, Inc. and Ameriprise Financial, Inc. shapes the competitive landscape of asset management. BlackRock operates as a global investment manager with a diversified product suite and institutional focus. Ameriprise emphasizes personalized financial advice and wealth management for retail and high-net-worth clients. This analysis will determine which business model offers superior risk-adjusted returns, guiding investors seeking optimal exposure within financial services.

Table of contents
Companies Overview
BlackRock and Ameriprise Financial shape the competitive landscape of asset management in the US financial sector.
BlackRock, Inc.: Global Investment Manager Powerhouse
BlackRock dominates as a leading investment manager providing services to institutional, intermediary, and individual investors worldwide. Its core revenue stems from managing diversified portfolios, including equity, fixed income, and alternative investments. In 2026, BlackRock emphasizes global risk management and expanding its real estate investments, particularly in Europe, leveraging its scale and sophisticated asset allocation strategies.
Ameriprise Financial, Inc.: Comprehensive Wealth Management Provider
Ameriprise focuses on delivering financial planning and wealth management services to retail and institutional clients. It generates revenue through advice, brokerage, asset management, and retirement solutions. In 2026, Ameriprise prioritizes expanding its Advice & Wealth Management segment while enhancing variable annuity and insurance product offerings, striving to integrate personalized financial advice with diverse investment options.
Strategic Collision: Similarities & Divergences
Both firms thrive in asset management but contrast in approach: BlackRock operates a broad, global investment platform while Ameriprise emphasizes personalized, advice-driven wealth management. Their primary battleground is capturing affluent individual investors and institutional mandates. BlackRock’s sheer scale and product diversity contrast with Ameriprise’s client-centric advisory model, defining distinct investment profiles for market participants.
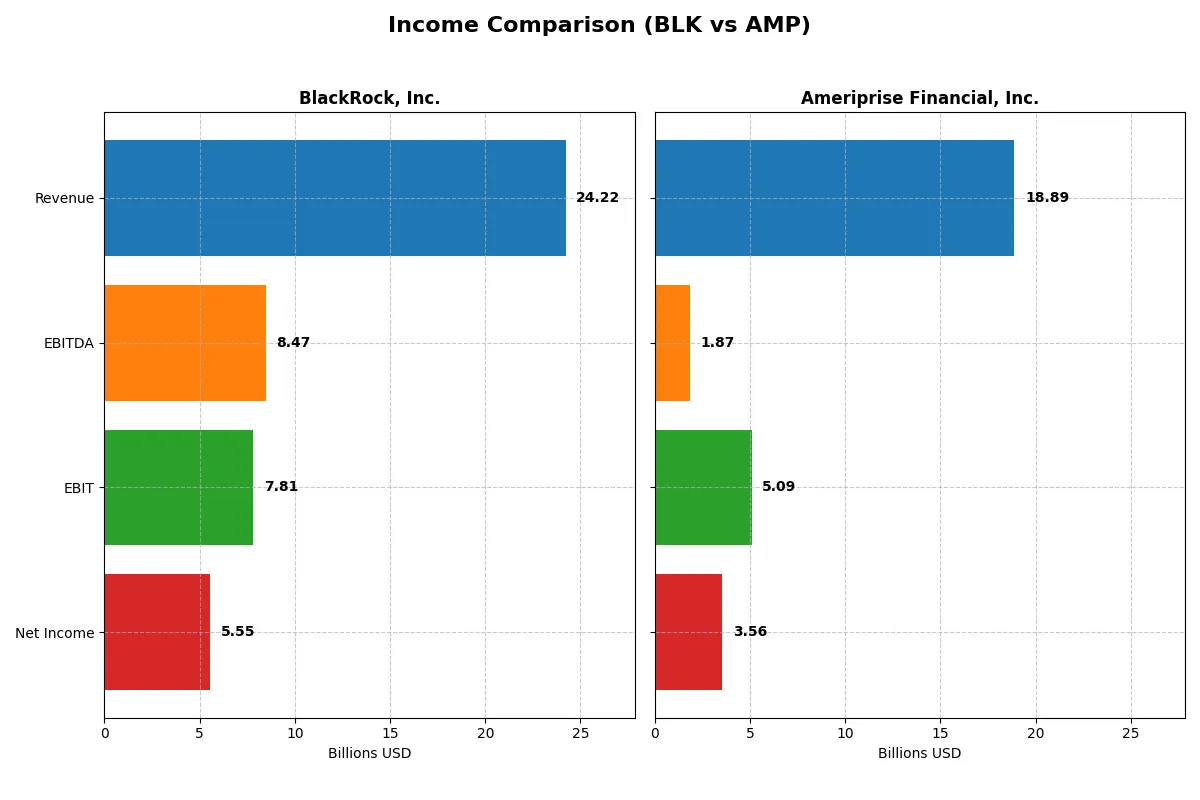
Income Statement Comparison
This data dissects the core profitability and scalability of both corporate engines to reveal who dominates the bottom line:
| Metric | BlackRock, Inc. (BLK) | Ameriprise Financial, Inc. (AMP) |
|---|---|---|
| Revenue | 24.2B | 18.9B |
| Cost of Revenue | 10.8B | 8.7B |
| Operating Expenses | 6.4B | 5.1B |
| Gross Profit | 13.4B | 10.2B |
| EBITDA | 8.5B | 1.9B |
| EBIT | 7.8B | 5.1B |
| Interest Expense | 706M | 324M |
| Net Income | 5.6B | 3.6B |
| EPS | 35.84 | 36.9 |
| Fiscal Year | 2025 | 2025 |
Income Statement Analysis: The Bottom-Line Duel
This income statement comparison reveals how efficiently BlackRock and Ameriprise convert revenue into profit, highlighting their operational strengths.
BlackRock, Inc. Analysis
BlackRock’s revenue grew robustly from $19.4B in 2021 to $24.2B in 2025, but net income declined slightly from $5.9B to $5.6B. Its gross margin held strong above 55%, showcasing cost control, while net margin slipped to 22.9%. Despite revenue momentum, earnings and EPS showed recent softness, indicating margin pressure.
Ameriprise Financial, Inc. Analysis
Ameriprise expanded revenue steadily by 41% over five years to $18.9B in 2025, with net income rising modestly to $3.6B. Gross margin stayed healthy at 54%, though EBIT and net margins contracted to 27% and 18.9%, respectively. EPS advanced 10% last year, but EBIT fell 21%, signaling operational challenges.
Margin Excellence vs. Revenue Growth
BlackRock leads on profitability with higher margins and scale, while Ameriprise boasts stronger revenue growth and EPS gains. BlackRock’s superior net margin and stable gross margin make it the fundamental winner for margin-focused investors. Ameriprise appeals to growth investors eyeing top-line expansion despite margin pressures.
Financial Ratios Comparison
These vital ratios act as a diagnostic tool to expose the underlying fiscal health, valuation premiums, and capital efficiency of the companies compared below:
| Ratios | BlackRock, Inc. (BLK) | Ameriprise Financial, Inc. (AMP) |
|---|---|---|
| ROE | 13.41% (2024) | 65.05% (2024) |
| ROIC | 4.34% (2024) | 2.84% (2024) |
| P/E | 24.15 (2024) | 15.81 (2024) |
| P/B | 3.24 (2024) | 10.29 (2024) |
| Current Ratio | 16.40 (2024) | 107.24 (2024) |
| Quick Ratio | 16.40 (2024) | 107.24 (2024) |
| D/E | 0.30 (2024) | 1.05 (2024) |
| Debt-to-Assets | 10.26% (2024) | 3.02% (2024) |
| Interest Coverage | 14.08 (2024) | 19.63 (2024) |
| Asset Turnover | 0.15 (2024) | 0.10 (2024) |
| Fixed Asset Turnover | 7.78 (2024) | N/A |
| Payout Ratio | 48.69% (2024) | 16.88% (2024) |
| Dividend Yield | 2.02% (2024) | 1.07% (2024) |
| Fiscal Year | 2024 | 2024 |
Efficiency & Valuation Duel: The Vital Signs
Financial ratios serve as a company’s DNA, exposing underlying risks and operational strengths critical for investment insight.
BlackRock, Inc.
BlackRock shows a strong net margin of 22.93%, indicating solid profitability, yet its ROE and ROIC are reported as zero, signaling potential measurement gaps or operational concerns. The P/E ratio at 29.9 suggests the stock is somewhat expensive. Shareholders receive a modest 1.95% dividend yield, reflecting a balanced approach between income and reinvestment.
Ameriprise Financial, Inc.
Ameriprise delivers exceptional profitability with a 54.41% ROE and 60.42% ROIC, reflecting highly efficient capital use. Its net margin of 18.83% remains favorable. The absence of a P/E ratio and dividend yield points to possible reinvestment or structural factors. Favorable asset turnover and interest coverage ratios support its operational strength despite higher debt levels.
Profitability vs. Valuation: Balancing Rewards and Risks
Ameriprise offers superior profitability metrics and operational efficiency, though it carries higher financial leverage risks. BlackRock’s valuation appears stretched with weaker returns but provides steady dividends. Investors prioritizing growth and robust returns may favor Ameriprise, while those seeking income and stability might lean toward BlackRock.
Which one offers the Superior Shareholder Reward?
I compare BlackRock and Ameriprise’s distribution strategies. BlackRock yields ~2.0%, with a 58% payout ratio and robust buybacks fueling returns. Ameriprise pays a lower 1.1% yield with a 17% payout, favoring cash reinvestment over dividends. BlackRock’s consistent, high buyback intensity complements its dividends, signaling sustainable shareholder returns. Ameriprise’s heavy leverage and modest payouts increase risk despite reinvestment focus. I find BlackRock offers a superior total return profile in 2026 due to balanced distributions and capital allocation discipline.
Comparative Score Analysis: The Strategic Profile
The radar chart reveals the fundamental DNA and trade-offs shaping BlackRock and Ameriprise’s financial profiles:
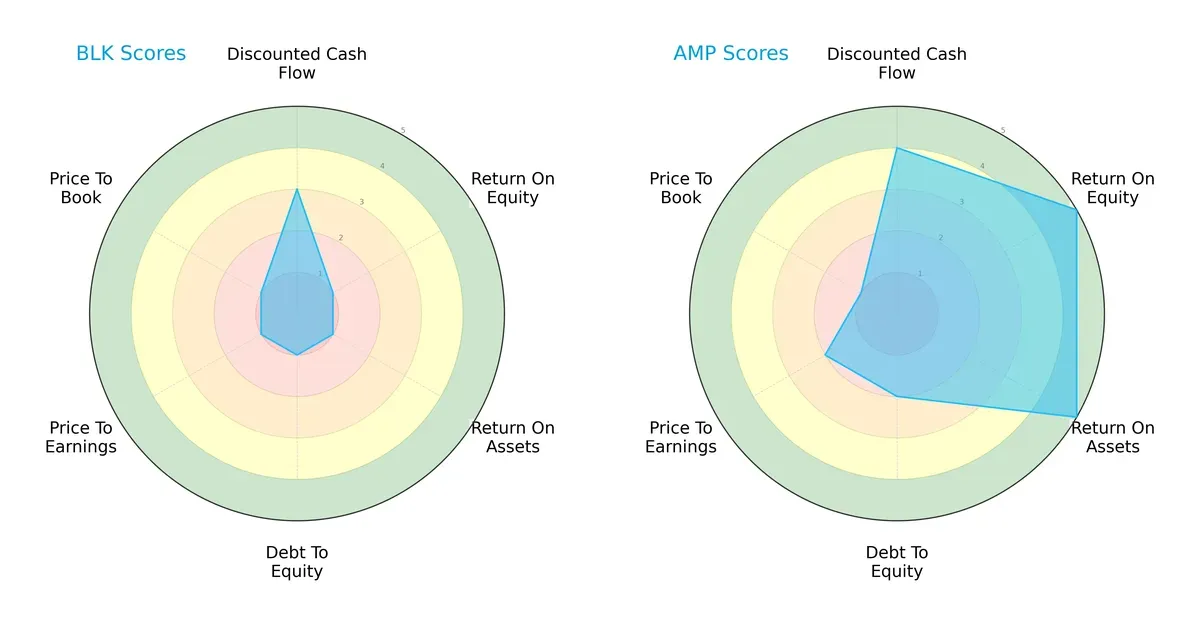
Ameriprise dominates across most metrics, showing strong returns on equity (5) and assets (5), and a healthier debt profile (2). BlackRock lags significantly, scoring a mere 1 in ROE, ROA, debt-to-equity, and valuation metrics, indicating overreliance on limited financial strengths. Ameriprise presents a more balanced and robust profile, while BlackRock’s edge is narrowly focused on a moderate DCF score (3).
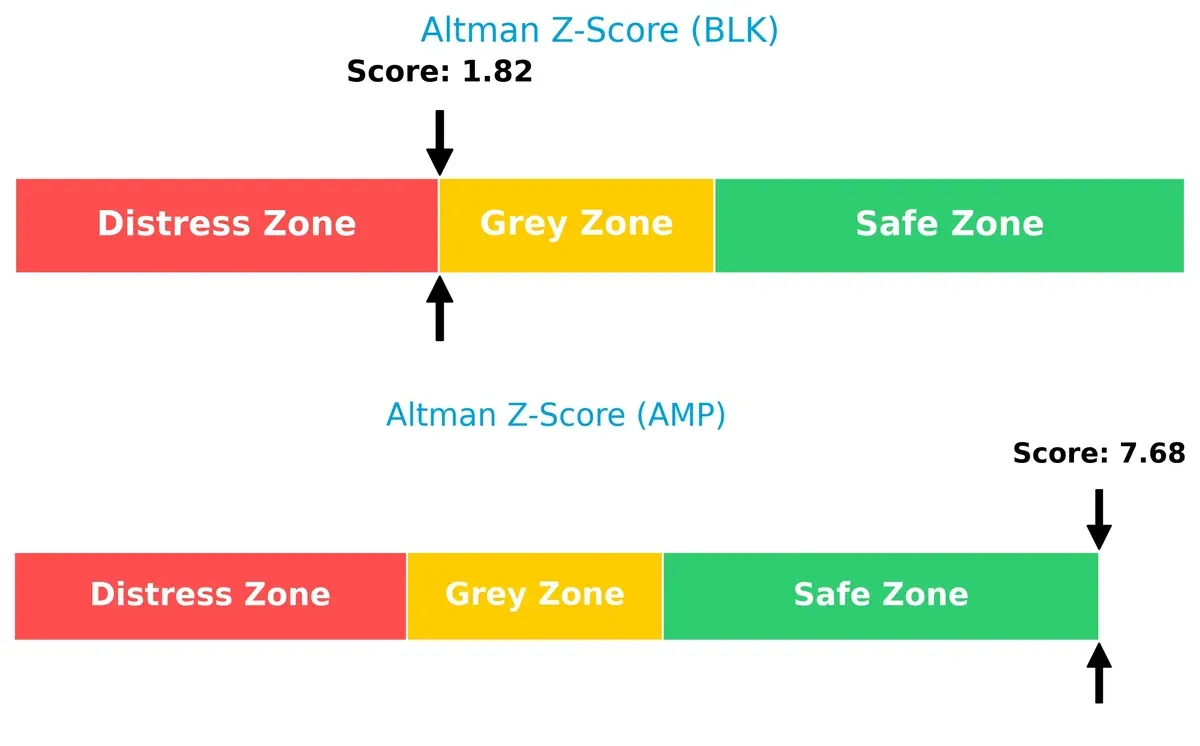
Bankruptcy Risk: Solvency Showdown
Ameriprise’s Altman Z-Score of 7.68 places it firmly in the safe zone, signaling strong long-term survival odds. BlackRock’s 1.82 score sits precariously in the grey zone, implying moderate bankruptcy risk under current market pressures:
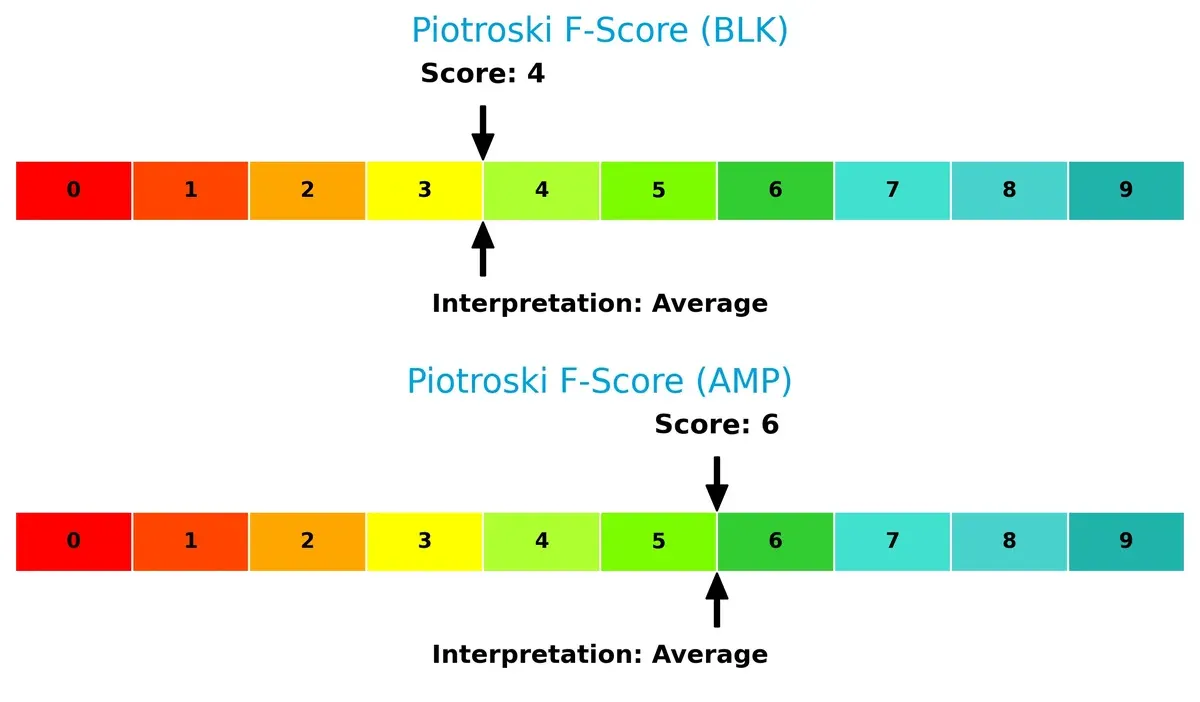
Financial Health: Quality of Operations
Ameriprise’s Piotroski F-Score of 6 outperforms BlackRock’s 4, suggesting stronger operational quality and fewer internal red flags. Both firms fall into an average health category, but Ameriprise’s superior score highlights better financial discipline and efficiency:
How are the two companies positioned?
This section dissects the operational DNA of BlackRock and Ameriprise by comparing their revenue distribution by segment alongside their core strengths and weaknesses. The goal is to confront their economic moats, identifying which model offers the most resilient and sustainable competitive advantage today.
Revenue Segmentation: The Strategic Mix
This comparison dissects how BlackRock, Inc. and Ameriprise Financial, Inc. diversify their income streams and where their primary sector bets lie:
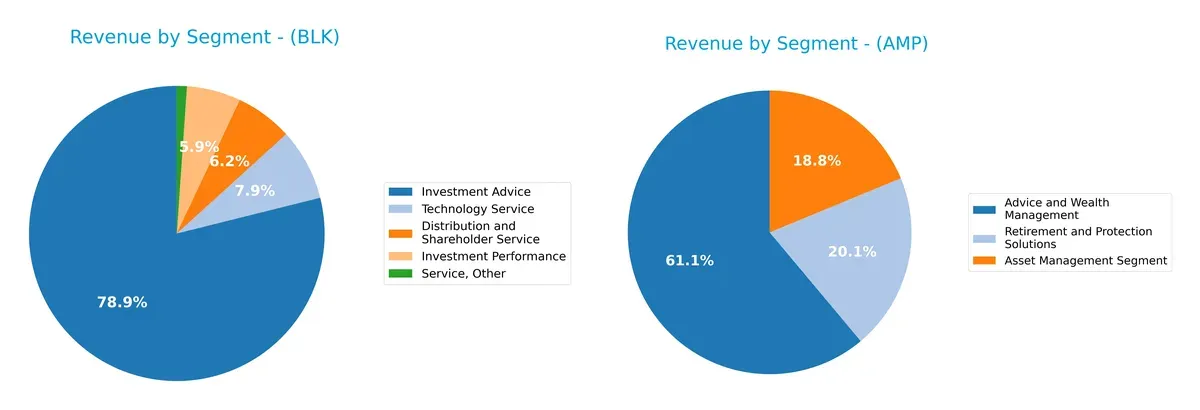
BlackRock anchors its revenue with $16.1B from Investment Advice, dwarfing its next largest Technology Service at $1.6B. This heavy concentration signals a strong ecosystem lock-in around advisory services. Ameriprise, by contrast, balances $11.4B in Advice and Wealth Management with $3.8B in Retirement and Protection Solutions and $3.5B Asset Management, revealing a more diversified portfolio that mitigates concentration risk and leverages multiple client needs.
Strengths and Weaknesses Comparison
This table compares the Strengths and Weaknesses of BlackRock, Inc. and Ameriprise Financial, Inc.:
BlackRock Strengths
- Diverse revenue streams across investment advice, technology, and shareholder services
- Strong global presence with significant Americas and Europe revenues
- Favorable net margin at 22.93%
- Low debt-to-assets ratio with favorable debt metrics
- Solid interest coverage at 11.06
Ameriprise Strengths
- High profitability with ROE of 54.41% and ROIC of 60.42%
- Favorable net margin at 18.83%
- Asset turnover of 1.96 shows operational efficiency
- Favorable interest coverage at 15.72
- Balanced revenue from advice, asset management, and retirement solutions
BlackRock Weaknesses
- Unfavorable ROE and ROIC at 0%, indicating capital efficiency concerns
- Unavailable WACC data limits cost of capital analysis
- Unfavorable liquidity ratios, including current and quick ratios at 0
- Unfavorable P/E ratio at 29.9 suggests premium valuation
- Asset turnover and fixed asset turnover are unfavorable
Ameriprise Weaknesses
- High debt-to-assets ratio at 60.75% raises leverage concerns
- Unfavorable liquidity metrics at 0 for current and quick ratios
- Dividend yield is unfavorable at 0%
- Fixed asset turnover is unfavorable
- Debt-to-equity is neutral but close to concerning levels
BlackRock shows strength in diversification and global scale but faces challenges in capital efficiency and liquidity. Ameriprise excels in profitability and operational efficiency but carries higher leverage and liquidity risks. Both companies demonstrate focused strategic strengths balanced by clear financial constraints.
The Moat Duel: Analyzing Competitive Defensibility
A structural moat protects long-term profits from relentless competitive erosion. Without it, market gains quickly vanish:
BlackRock, Inc.: Intangible Asset Moat through Scale and Brand
BlackRock’s dominant brand and expansive global reach create a switching cost moat. Its 32% EBIT margin signals pricing power, yet declining ROIC warns of emerging pressure in 2026.
Ameriprise Financial, Inc.: Value Creator with Growing Capital Efficiency
Ameriprise leverages a robust advisory network as its moat, contrasting BlackRock’s asset scale. Its ROIC outpaces WACC by 51%, showing efficient capital use and expanding profitability potential.
Scale Dominance vs. Capital Efficiency: The Moat Battle
Ameriprise’s expanding ROIC and value creation edge BlackRock’s scale-based moat, which faces erosion risks. Ameriprise appears better positioned to sustain and deepen its competitive advantage.
Which stock offers better returns?
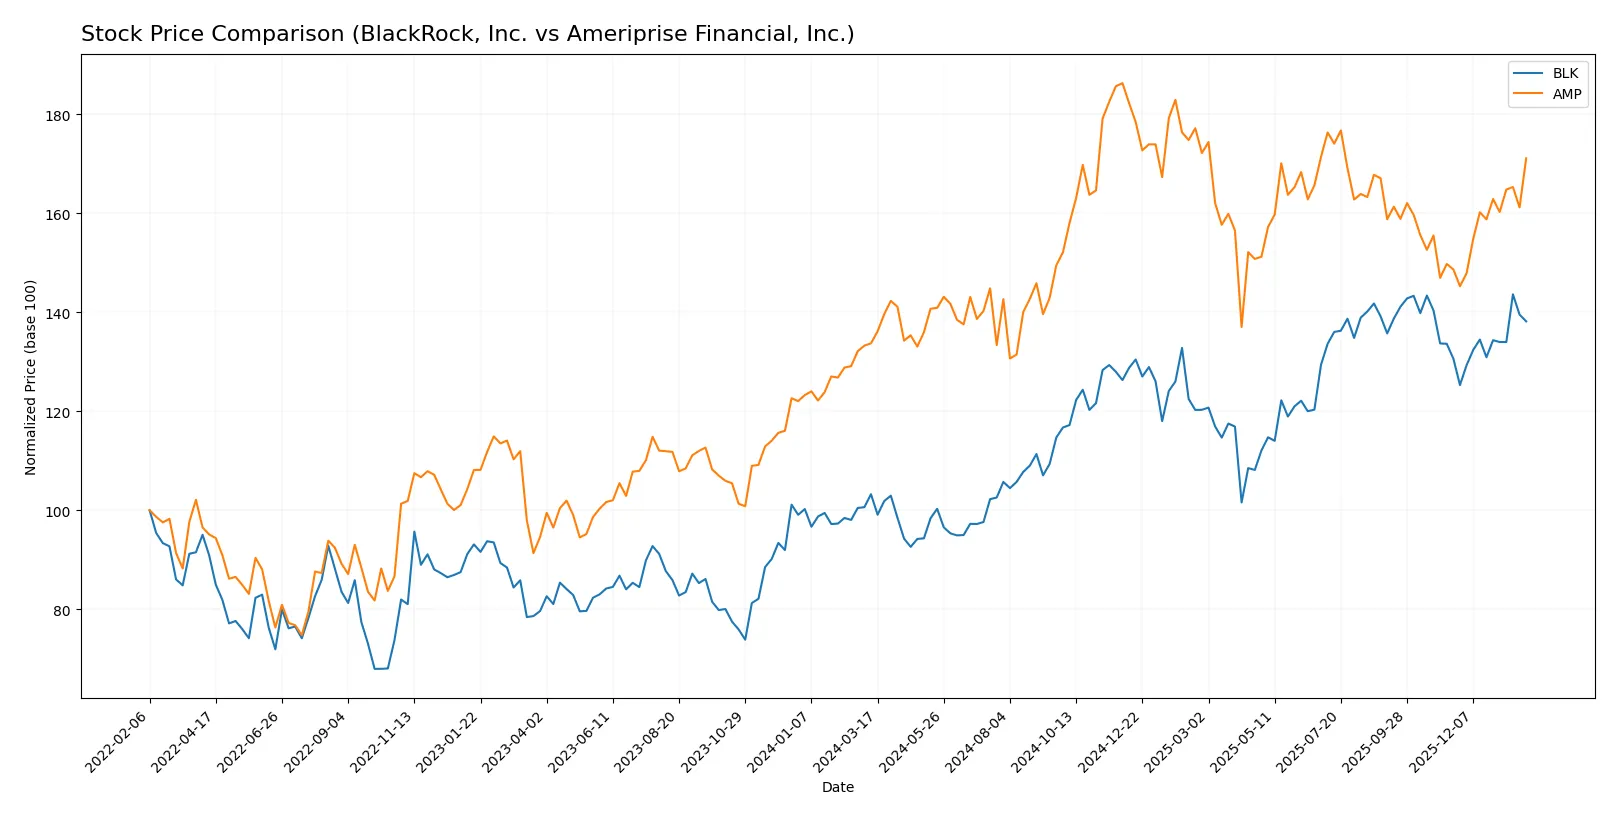
The past year showed strong price gains and distinct acceleration trends for both stocks, with BlackRock and Ameriprise displaying robust bullish momentum and rising trading volumes.
Trend Comparison
BlackRock’s stock rose 33.83% over the past year, showing a bullish trend with accelerating gains. It reached a high of 1163.17 and a low of 749.98, exhibiting notable volatility with a standard deviation of 121.04.
Ameriprise gained 27.96% in the same period, also bullish with accelerating momentum. Its price fluctuated between 402.61 and 573.97, with a lower volatility level of 45.04 standard deviation.
BlackRock outperformed Ameriprise over the past 12 months, delivering the highest market return and stronger recent momentum despite higher volatility.
Target Prices
Analysts present a clear upward target consensus for both BlackRock, Inc. and Ameriprise Financial, Inc.
| Company | Target Low | Target High | Consensus |
|---|---|---|---|
| BlackRock, Inc. | 1200 | 1514 | 1333.7 |
| Ameriprise Financial, Inc. | 485 | 570 | 528.33 |
The target consensus for BlackRock stands roughly 19% above its current price of 1118.94, signaling bullish sentiment. Ameriprise’s consensus aligns closely with its current price of 527.19, indicating a generally stable outlook.

Don’t Let Luck Decide Your Entry Point
Optimize your entry points with our advanced ProRealTime indicators. You’ll get efficient buy signals with precise price targets for maximum performance. Start outperforming now!
How do institutions grade them?
BlackRock, Inc. Grades
The following table summarizes recent grades assigned to BlackRock by key grading companies.
| Grading Company | Action | New Grade | Date |
|---|---|---|---|
| UBS | Maintain | Neutral | 2026-01-16 |
| Keefe, Bruyette & Woods | Maintain | Outperform | 2026-01-16 |
| Barclays | Maintain | Overweight | 2026-01-16 |
| TD Cowen | Downgrade | Hold | 2026-01-14 |
| UBS | Maintain | Neutral | 2026-01-12 |
| Barclays | Maintain | Overweight | 2026-01-08 |
| Keefe, Bruyette & Woods | Maintain | Outperform | 2026-01-08 |
| Keefe, Bruyette & Woods | Maintain | Outperform | 2025-12-17 |
| Morgan Stanley | Maintain | Overweight | 2025-12-17 |
| Barclays | Maintain | Overweight | 2025-12-12 |
Ameriprise Financial, Inc. Grades
This table presents recent grade updates for Ameriprise Financial from established grading firms.
| Grading Company | Action | New Grade | Date |
|---|---|---|---|
| Piper Sandler | Upgrade | Neutral | 2026-01-30 |
| Morgan Stanley | Maintain | Underweight | 2025-12-22 |
| Argus Research | Maintain | Buy | 2025-11-13 |
| RBC Capital | Maintain | Outperform | 2025-11-03 |
| Keefe, Bruyette & Woods | Maintain | Market Perform | 2025-11-03 |
| Evercore ISI Group | Maintain | In Line | 2025-10-09 |
| Morgan Stanley | Maintain | Underweight | 2025-10-01 |
| RBC Capital | Maintain | Outperform | 2025-07-30 |
| Raymond James | Maintain | Strong Buy | 2025-07-25 |
| William Blair | Downgrade | Market Perform | 2025-07-25 |
Which company has the best grades?
BlackRock holds consistently positive ratings, with multiple “Outperform” and “Overweight” grades from top firms. Ameriprise shows a wider spread, including a recent upgrade but also some “Underweight” ratings. Investors might perceive BlackRock as the more favorably viewed stock, potentially impacting market sentiment and portfolio decisions.
Risks specific to each company
The following risk categories identify the critical pressure points and systemic threats facing both firms in the 2026 market environment:
1. Market & Competition
BlackRock, Inc.
- Faces intense competition in global asset management, with pressure to innovate and retain institutional clients.
Ameriprise Financial, Inc.
- Competes in diversified financial services, balancing wealth management and asset management segments amid evolving client needs.
2. Capital Structure & Debt
BlackRock, Inc.
- Exhibits a favorable debt profile with strong interest coverage, indicating prudent leverage management.
Ameriprise Financial, Inc.
- Shows higher debt-to-assets ratio (60.75%), signaling elevated leverage risk despite solid interest coverage.
3. Stock Volatility
BlackRock, Inc.
- Higher beta of 1.484 suggests greater sensitivity to market swings and volatility risk.
Ameriprise Financial, Inc.
- Lower beta of 1.256 indicates more moderate stock price fluctuations relative to the market.
4. Regulatory & Legal
BlackRock, Inc.
- Subject to global regulatory scrutiny due to size and cross-border operations; compliance costs remain significant.
Ameriprise Financial, Inc.
- Faces regulatory complexity across wealth management and insurance products, with potential shifts in financial rules.
5. Supply Chain & Operations
BlackRock, Inc.
- Operational risks stem from reliance on technology platforms and third-party data for asset management services.
Ameriprise Financial, Inc.
- Operational complexity heightened by diversified product offerings and integration of financial advisory services.
6. ESG & Climate Transition
BlackRock, Inc.
- Increasing pressure to lead in ESG investing and climate risk integration, impacting investment strategies.
Ameriprise Financial, Inc.
- Faces challenges aligning retirement and insurance products with evolving ESG standards and client expectations.
7. Geopolitical Exposure
BlackRock, Inc.
- Global footprint exposes it to geopolitical risks including regulatory changes and market disruptions abroad.
Ameriprise Financial, Inc.
- Primarily US-focused but still vulnerable to geopolitical shifts affecting international asset management partners.
Which company shows a better risk-adjusted profile?
Ameriprise’s most impactful risk is its elevated leverage ratio, which could strain financial flexibility. BlackRock’s main concern is its high stock volatility, increasing investor risk. Despite BlackRock’s operational scale, Ameriprise shows a better risk-adjusted profile supported by a safer Altman Z-score and stronger profitability metrics. This contrast highlights Ameriprise’s relatively robust balance sheet amid market uncertainties.
Final Verdict: Which stock to choose?
BlackRock’s superpower lies in its unmatched scale and operating efficiency, generating strong cash flow in a competitive asset management landscape. A point of vigilance is its declining ROIC trend, which may signal challenges in sustaining value creation. It suits portfolios focused on steady, large-cap exposure with moderate growth ambitions.
Ameriprise stands out with a very favorable moat, demonstrated by a robust and growing ROIC well above its cost of capital, reflecting excellent capital allocation and profitability. Its lower valuation multiples and stronger financial scores suggest better stability relative to BlackRock. This makes it appealing for GARP investors seeking durable growth at a reasonable price.
If you prioritize established market dominance and consistent cash generation, BlackRock is the compelling choice due to scale advantages and operational efficiency. However, if you seek superior capital returns and a stronger moat with moderate risk, Ameriprise offers better stability and value creation potential. Both present distinct strategic profiles, so alignment with your investment goals is crucial.
Disclaimer: Investment carries a risk of loss of initial capital. The past performance is not a reliable indicator of future results. Be sure to understand risks before making an investment decision.
Go Further
I encourage you to read the complete analyses of BlackRock, Inc. and Ameriprise Financial, Inc. to enhance your investment decisions: