Home > Comparison > Real Estate > AMT vs WY
The strategic rivalry between American Tower Corporation and Weyerhaeuser Company shapes the Real Estate sector’s trajectory. American Tower operates as a capital-intensive owner and developer of communications sites, while Weyerhaeuser focuses on sustainable timberland management and wood product manufacturing. This analysis pits infrastructure scale against natural resource stewardship to identify which model delivers superior risk-adjusted returns for a diversified portfolio in 2026.
Table of contents
Companies Overview
American Tower Corporation and Weyerhaeuser Company stand as pivotal players in the specialty REIT sector, each commanding unique market positions.
American Tower Corporation: Global Communications REIT Leader
American Tower Corporation dominates as a leading independent owner and operator of multitenant communications real estate. Its core revenue stems from leasing approximately 219,000 communications sites worldwide. In 2026, the company’s strategic focus remains on expanding its global footprint and enhancing site density to capitalize on growing wireless data demand.
Weyerhaeuser Company: Timberland and Wood Products Giant
Weyerhaeuser Company ranks among the largest private owners of timberlands, managing approximately 11M acres sustainably. It generates revenue primarily through timberland operations and wood product manufacturing. In 2026, the company prioritizes sustainable forestry management and optimizing its manufacturing processes to strengthen its competitive edge in North America.
Strategic Collision: Similarities & Divergences
Both companies operate as specialty REITs but diverge sharply in asset types—communications infrastructure versus natural resources. They compete indirectly on capital allocation efficiency and long-term asset management rather than direct market share. American Tower’s growth hinges on technology-driven demand, while Weyerhaeuser’s investment profile relies on commodity cycles and sustainability, creating distinct risk-return dynamics for investors.
Income Statement Comparison
The following data dissects the core profitability and scalability of both corporate engines to reveal who dominates the bottom line:
| Metric | American Tower Corporation (AMT) | Weyerhaeuser Company (WY) |
|---|---|---|
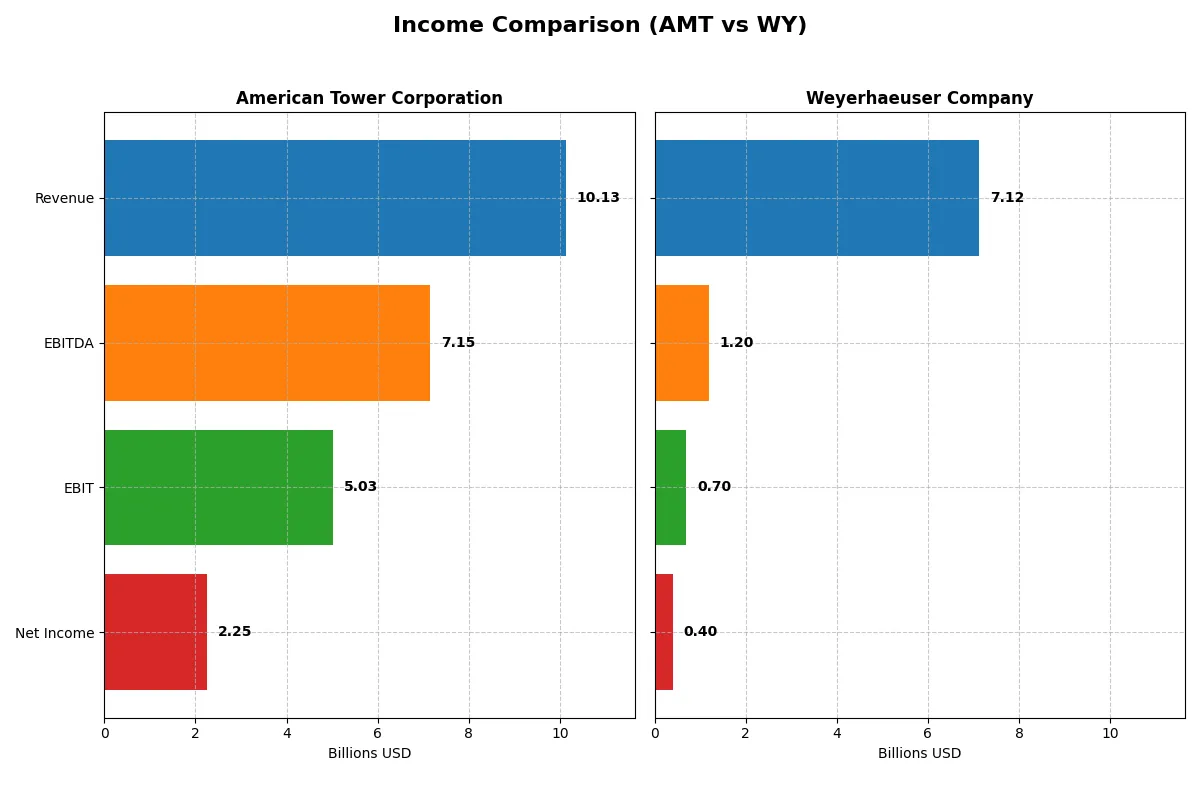
| Revenue | 10.13B | 7.12B |
| Cost of Revenue | 2.57B | 5.81B |
| Operating Expenses | 3.04B | 628M |
| Gross Profit | 7.55B | 1.31B |
| EBITDA | 7.15B | 1.20B |
| EBIT | 5.03B | 696M |
| Interest Expense | 1.40B | 269M |
| Net Income | 2.26B | 396M |
| EPS | 4.83 | 0.54 |
| Fiscal Year | 2024 | 2024 |
Income Statement Analysis: The Bottom-Line Duel
This income statement comparison reveals which company efficiently converts revenue into profit and sustains growth over time.
American Tower Corporation Analysis
American Tower’s revenue climbed steadily to 10.1B in 2024, with net income rising to 2.25B. It maintains robust gross and net margins of 74.6% and 22.3%, respectively. The latest year shows impressive EBIT growth of 72%, signaling strong operational momentum and solid margin expansion despite slightly higher interest expenses.
Weyerhaeuser Company Analysis
Weyerhaeuser’s revenue declined to 7.12B in 2024, with net income dropping sharply to 396M. Margins are modest, with gross at 18.4% and net at 5.6%. The company faces significant margin compression and a 42.8% EBIT decline, reflecting operational challenges and weakening profitability momentum.
Margin Strength vs. Revenue Stability
American Tower clearly outperforms Weyerhaeuser in margin quality and profit growth, with favorable trends in operational efficiency and earnings. Weyerhaeuser struggles with shrinking revenue and deteriorating margins. Investors seeking stable margin power and consistent earnings growth will find American Tower’s profile more compelling.
Financial Ratios Comparison
These vital ratios act as a diagnostic tool to expose the underlying fiscal health, valuation premiums, and capital efficiency of the companies compared below:
| Ratios | American Tower Corporation (AMT) | Weyerhaeuser Company (WY) |
|---|---|---|
| ROE | 66.67% | 4.07% |
| ROIC | 6.97% | 4.02% |
| P/E | 37.98 | 51.78 |
| P/B | 25.33 | 2.11 |
| Current Ratio | 0.45 | 1.79 |
| Quick Ratio | 0.45 | 1.17 |
| D/E (Debt-to-Equity) | 13.00 | 0.53 |
| Debt-to-Assets | 71.96% | 30.87% |
| Interest Coverage | 3.22 | 2.55 |
| Asset Turnover | 0.17 | 0.43 |
| Fixed Asset Turnover | 0.37 | 0.49 |
| Payout ratio | 136% | 173% |
| Dividend yield | 3.59% | 3.34% |
| Fiscal Year | 2024 | 2024 |
Efficiency & Valuation Duel: The Vital Signs
Financial ratios serve as the company’s DNA, unveiling hidden risks and operational strengths that raw data alone cannot expose.
American Tower Corporation
American Tower displays a robust ROE of 66.7%, signaling strong profitability, although its net margin at 22.3% is favorable but not extraordinary. The stock trades at a high P/E of 38, indicating an expensive valuation relative to earnings. Shareholders benefit from a 3.6% dividend yield, reflecting a commitment to returns despite high leverage and liquidity concerns.
Weyerhaeuser Company
Weyerhaeuser posts a modest ROE of 4.1% and a low net margin of 5.6%, suggesting limited profitability. Its P/E ratio is stretched at 51.8, pointing to overvaluation risks. The company maintains a solid current ratio near 1.8, supporting liquidity. It offers a 3.3% dividend yield, balancing shareholder returns with cautious capital management.
Premium Valuation vs. Operational Safety
American Tower commands a premium valuation supported by exceptional profitability but carries liquidity and leverage red flags. Weyerhaeuser shows more balanced liquidity and moderate shareholder yield but weaker profitability and a higher P/E. Risk-tolerant investors may prefer American Tower’s growth profile; risk-averse investors might lean toward Weyerhaeuser’s steadier operational footing.
Which one offers the Superior Shareholder Reward?
I see American Tower (AMT) delivers a 3.59% dividend yield with a payout ratio over 136%, signaling aggressive distribution likely supplemented by buybacks. AMT’s free cash flow covers dividends well at a 70% ratio, and it maintains a strong buyback program, enhancing shareholder returns. Weyerhaeuser (WY) offers a 3.34% yield, with a more conservative 173% payout ratio, but its free cash flow coverage is weaker at 34%, implying less sustainable dividends. WY’s buyback activity is modest compared to AMT’s scale. I conclude AMT’s blend of dividends and buybacks offers a superior total return profile for 2026 investors despite higher leverage risks.
Comparative Score Analysis: The Strategic Profile
The radar chart reveals the fundamental DNA and trade-offs of American Tower Corporation and Weyerhaeuser Company, highlighting their financial strengths and vulnerabilities:
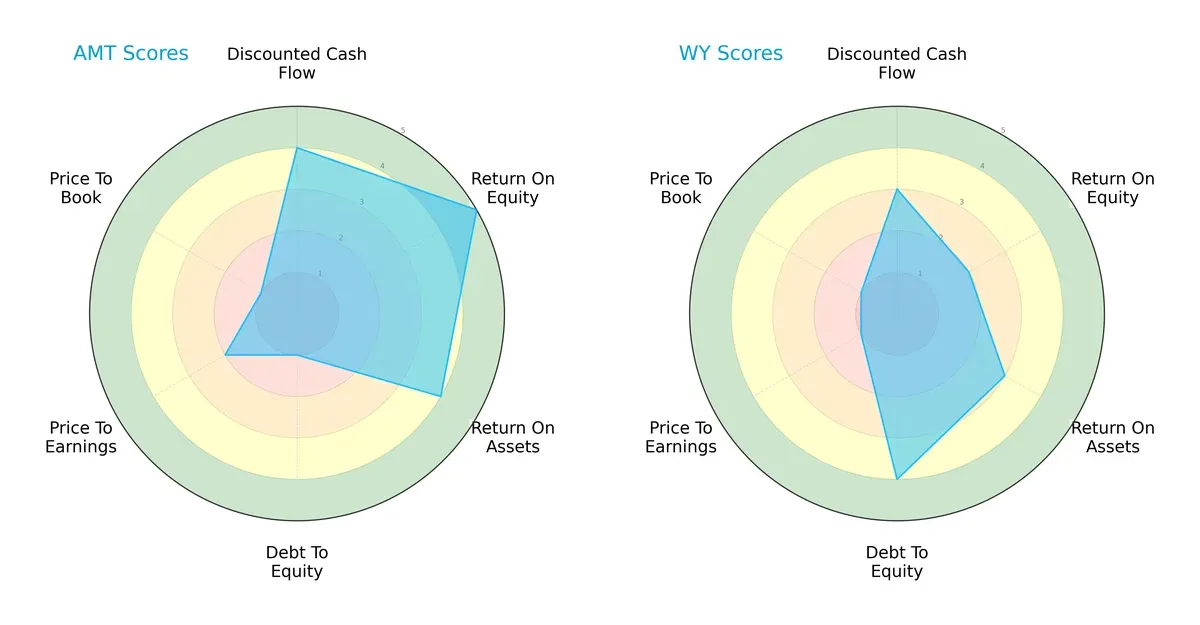
American Tower shows superior returns with a very favorable ROE (5) and ROA (4), and stronger DCF (4) than Weyerhaeuser, which scores moderate on these metrics. However, AMT’s balance sheet is strained, reflected by a very unfavorable debt-to-equity score (1), unlike WY’s favorable (4) leverage position. Valuation scores favor Weyerhaeuser slightly on P/E and are equally weak on P/B, indicating both stocks may be expensive. Overall, AMT relies on operational efficiency while WY benefits from financial stability.
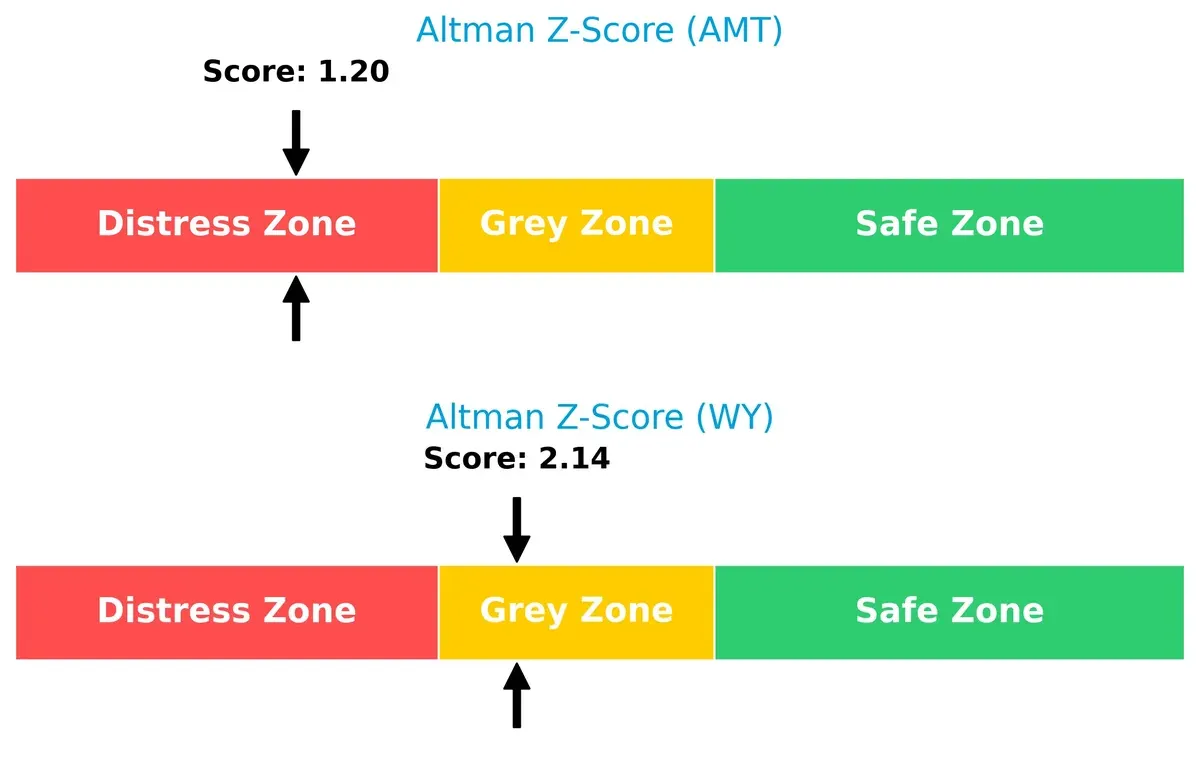
Bankruptcy Risk: Solvency Showdown
American Tower’s Altman Z-Score of 1.2 places it in the distress zone, signaling elevated bankruptcy risk. Weyerhaeuser’s score of 2.1 sits in the grey zone, indicating moderate risk but better solvency prospects in this market cycle:
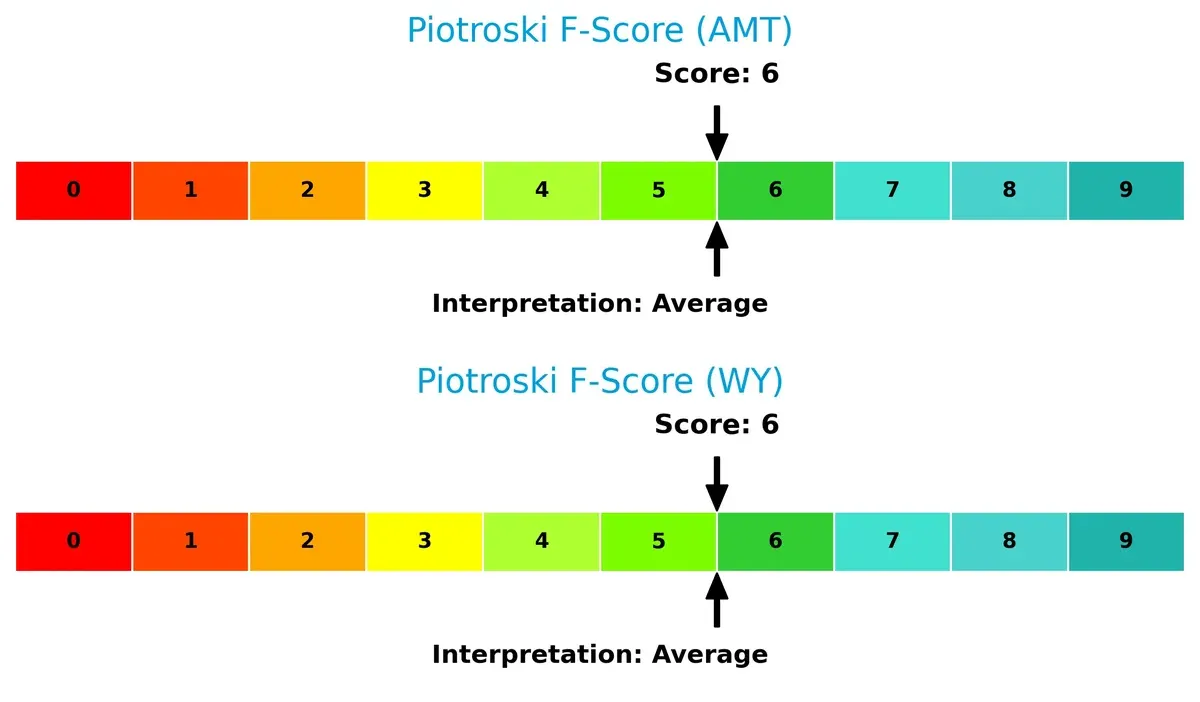
Financial Health: Quality of Operations
Both companies score a 6 on the Piotroski F-Score, indicating average financial health. Neither shows immediate red flags, but neither is in peak condition, suggesting cautious optimism about their operational quality:
How are the two companies positioned?
This section dissects AMT and WY’s operational DNA by comparing revenue distribution and internal dynamics. The goal is to confront their economic moats and identify the most resilient competitive advantage today.
Revenue Segmentation: The Strategic Mix
This visual comparison dissects how American Tower Corporation and Weyerhaeuser Company diversify their income streams and where their primary sector bets lie:
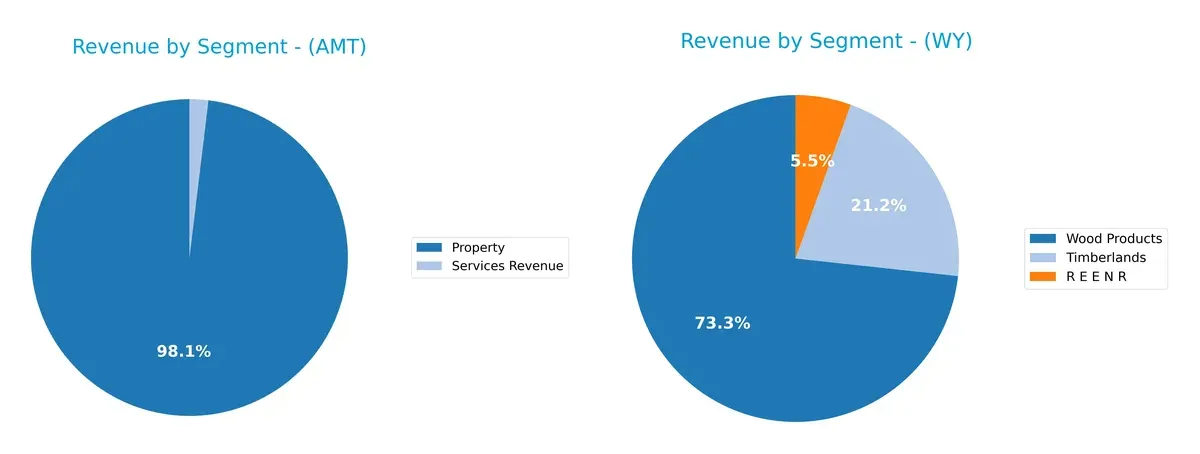
American Tower anchors its revenue heavily in Property, generating $9.9B in 2024, with minimal Services Revenue at $194M. This signals a focused business model centered on infrastructure dominance in wireless real estate. Conversely, Weyerhaeuser displays a more diversified mix: $5.2B from Wood Products, $1.5B Timberlands, and $391M in REENR. Weyerhaeuser’s segmentation reduces concentration risk but faces cyclicality in commodity markets. American Tower’s concentrated Property revenue offers ecosystem lock-in advantages but bears dependency risk.
Strengths and Weaknesses Comparison
This table compares the Strengths and Weaknesses of American Tower Corporation (AMT) and Weyerhaeuser Company (WY):
AMT Strengths
- High net margin at 22.27%
- Strong ROE at 66.67%
- Favorable WACC at 6.48%
- Large U.S. property revenue of 5.44B
- Diverse global property presence across continents
- Consistent dividend yield of 3.59%
WY Strengths
- Favorable current and quick ratios at 1.79 and 1.17
- Moderate debt to equity ratio of 0.53
- Favorable WACC at 7.83%
- Large U.S. revenue of 8.71B in wood products and timberlands
- Geographic diversification in North America and Asia
- Dividend yield near 3.34%
AMT Weaknesses
- High debt to assets at 71.96%
- Low current and quick ratios at 0.45
- Unfavorable PE of 37.98 and PB of 25.33
- Low asset turnover at 0.17
- High debt to equity of 13.0
- Neutral interest coverage at 3.58
WY Weaknesses
- Low ROE at 4.07% and ROIC at 4.02%
- Unfavorable PE ratio of 51.78
- Unfavorable asset turnover at 0.43
- Neutral debt to assets at 30.87%
- Neutral interest coverage at 2.59
- Lower net margin at 5.56%
Both companies show strengths in their dividend yields and geographic diversification, yet face challenges in profitability and asset efficiency. AMT’s high leverage contrasts with WY’s more balanced financial structure, affecting strategic flexibility.
The Moat Duel: Analyzing Competitive Defensibility
A structural moat is the only true shield protecting long-term profits from relentless competition erosion. Let’s dissect how these two REITs defend their turf:
American Tower Corporation: Network Effects Moat
American Tower leverages vast global communications sites, creating high switching costs for tenants. Its robust 50% EBIT margin reflects this intangible asset moat. Expansion in data centers and emerging markets promises to deepen this competitive edge in 2026.
Weyerhaeuser Company: Cost Advantage Moat
Weyerhaeuser depends on scale and sustainable timberland management, but lower margins and shrinking ROIC signal weakening cost advantages. Its exposure to commodity cycles threatens profitability, though innovation in wood products may offer limited upside.
Network Effects vs. Cost Efficiency: Who Holds the Line?
American Tower’s network effects deliver a wider, more durable moat than Weyerhaeuser’s eroding cost advantage. I see AMT better equipped to defend market share amid intensifying competition and macro shifts in 2026.
Which stock offers better returns?
The past year saw both stocks in bearish territory, with American Tower sharply declining and Weyerhaeuser showing increased volatility and recent gains.
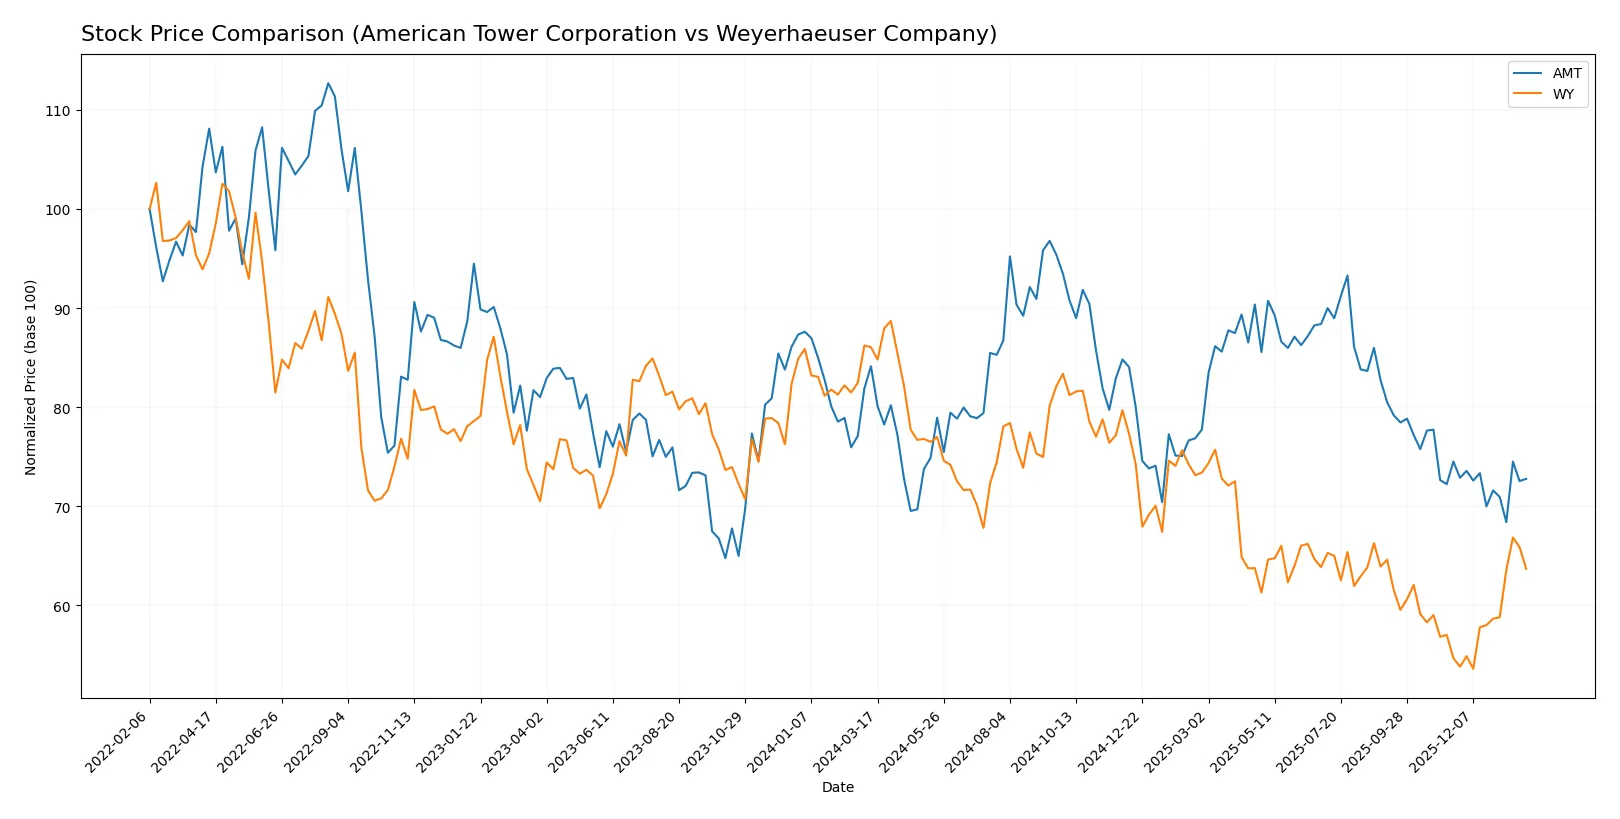
Trend Comparison
American Tower’s stock dropped 13.52% over 12 months, showing a bearish trend with decelerating decline and high volatility, hitting a low of 168.51 and a high of 238.5.
Weyerhaeuser’s stock fell 26.0% over the year, also bearish but with accelerating decline; however, recent months show a 16.49% rebound and lower volatility, reaching a low of 21.69 and high of 35.91.
Weyerhaeuser delivered the highest short-term recovery while American Tower maintained a less steep overall decline, reflecting differing momentum trajectories.
Target Prices
Analysts provide a clear target price consensus for American Tower Corporation and Weyerhaeuser Company.
| Company | Target Low | Target High | Consensus |
|---|---|---|---|
| American Tower Corporation | 185 | 255 | 214.6 |
| Weyerhaeuser Company | 28 | 33 | 30 |
The consensus target for American Tower stands 20% above its current 179.28 price, signaling upside potential. Weyerhaeuser’s 30 consensus exceeds its 25.78 price by about 16%, indicating moderate analyst optimism.

Don’t Let Luck Decide Your Entry Point
Optimize your entry points with our advanced ProRealTime indicators. You’ll get efficient buy signals with precise price targets for maximum performance. Start outperforming now!
How do institutions grade them?
American Tower Corporation Grades
The following table summarizes recent institutional grades for American Tower Corporation:
| Grading Company | Action | New Grade | Date |
|---|---|---|---|
| UBS | Maintain | Buy | 2026-01-20 |
| Scotiabank | Maintain | Sector Outperform | 2026-01-14 |
| Mizuho | Maintain | Neutral | 2026-01-12 |
| JP Morgan | Maintain | Overweight | 2026-01-12 |
| BMO Capital | Downgrade | Market Perform | 2026-01-09 |
| RBC Capital | Maintain | Sector Perform | 2025-12-19 |
| Morgan Stanley | Maintain | Overweight | 2025-12-05 |
| Barclays | Downgrade | Equal Weight | 2025-12-01 |
| Barclays | Maintain | Overweight | 2025-11-17 |
| Raymond James | Maintain | Strong Buy | 2025-10-29 |
Weyerhaeuser Company Grades
The following table summarizes recent institutional grades for Weyerhaeuser Company:
| Grading Company | Action | New Grade | Date |
|---|---|---|---|
| Citigroup | Maintain | Buy | 2026-01-14 |
| Truist Securities | Maintain | Hold | 2026-01-06 |
| CIBC | Maintain | Outperform | 2025-12-12 |
| B of A Securities | Downgrade | Neutral | 2025-11-17 |
| JP Morgan | Maintain | Overweight | 2025-11-14 |
| Citigroup | Maintain | Buy | 2025-11-12 |
| DA Davidson | Maintain | Buy | 2025-11-03 |
| RBC Capital | Maintain | Outperform | 2025-11-03 |
| Citigroup | Maintain | Buy | 2025-10-27 |
| Truist Securities | Maintain | Hold | 2025-10-13 |
Which company has the best grades?
American Tower receives a broader mix, including Strong Buy and multiple Overweight ratings. Weyerhaeuser shows consistent Buy and Outperform grades but fewer top-tier ratings. Investors may perceive American Tower as slightly favored by institutions.
Risks specific to each company
The following categories identify the critical pressure points and systemic threats facing both firms in the 2026 market environment:
1. Market & Competition
American Tower Corporation
- Operates in a highly competitive global REIT sector with technology-driven demand shifts.
Weyerhaeuser Company
- Faces cyclical timber prices and competition from alternative building materials.
2. Capital Structure & Debt
American Tower Corporation
- Heavy leverage with debt-to-assets near 72%, raising financial risk concerns.
Weyerhaeuser Company
- Moderate leverage with debt-to-assets around 31%, showing more conservative balance sheet.
3. Stock Volatility
American Tower Corporation
- Beta of 0.93 indicates slightly less volatility than the market average.
Weyerhaeuser Company
- Beta of 1.05 signals volatility marginally above the market norm.
4. Regulatory & Legal
American Tower Corporation
- Subject to telecommunications infrastructure regulations globally; risks vary by region.
Weyerhaeuser Company
- Exposed to forestry and environmental regulations impacting sustainable timber operations.
5. Supply Chain & Operations
American Tower Corporation
- Dependent on construction materials and site access; operational disruptions can impede growth.
Weyerhaeuser Company
- Relies on timber harvest and logistics; weather and pest risks can disrupt supply chain.
6. ESG & Climate Transition
American Tower Corporation
- Faces pressure to reduce carbon footprint amid global infrastructure expansion.
Weyerhaeuser Company
- Listed on Dow Jones Sustainability Index; must manage climate risks in forestry management.
7. Geopolitical Exposure
American Tower Corporation
- Global footprint exposes it to geopolitical tensions affecting telecom markets.
Weyerhaeuser Company
- Primarily US and Canada operations limit exposure but still vulnerable to trade policy shifts.
Which company shows a better risk-adjusted profile?
American Tower’s biggest risk is its high leverage, placing it in the distress zone with Altman Z-Score of 1.20. Weyerhaeuser’s chief concern lies in weaker profitability and moderate financial metrics, though its lower debt offers stability. Weyerhaeuser shows a more balanced risk-adjusted profile, supported by its safer capital structure and grey zone Altman Z-Score of 2.14. The stark contrast in debt-to-assets—72% versus 31%—justifies caution toward American Tower despite its market leadership.
Final Verdict: Which stock to choose?
American Tower’s superpower lies in its ability to generate robust cash flow and deliver impressive net margins, despite a heavy debt load. Its growing profitability signals operational strength, but the stretched balance sheet is a point of vigilance. This stock suits investors targeting aggressive growth with a tolerance for leverage risk.
Weyerhaeuser’s strategic moat is its solid balance sheet and stable asset base, offering safer financial footing relative to American Tower. Though growth has been disappointing, its recurring cash flow from timberlands provides steady income, fitting well into GARP portfolios seeking moderate growth with enhanced stability.
If you prioritize high growth and cash flow expansion, American Tower outshines due to its profitability and operational momentum despite financial leverage. However, if you seek better stability with lower financial risk, Weyerhaeuser offers a more conservative profile, though with limited growth prospects. Each fits distinct investor appetites within a diversified strategy.
Disclaimer: Investment carries a risk of loss of initial capital. The past performance is not a reliable indicator of future results. Be sure to understand risks before making an investment decision.
Go Further
I encourage you to read the complete analyses of American Tower Corporation and Weyerhaeuser Company to enhance your investment decisions: