American Tower Corporation (AMT) and Iron Mountain Incorporated (IRM) are two prominent players in the specialized REIT sector, each leading in distinct but overlapping markets of communications infrastructure and information management. Both companies exemplify innovation in real estate by adapting to evolving technological demands and digital transformation trends. In this article, I will analyze their strengths and risks to help you decide which company offers the most compelling investment opportunity in 2026.
Table of contents
Companies Overview
I will begin the comparison between American Tower Corporation and Iron Mountain Incorporated by providing an overview of these two companies and their main differences.
American Tower Corporation Overview
American Tower Corporation is a leading independent owner, operator, and developer of multitenant communications real estate. As one of the largest global REITs, it manages a portfolio of approximately 219,000 communications sites. The company focuses on providing infrastructure that supports wireless communication networks, positioning itself prominently within the specialty real estate sector.
Iron Mountain Incorporated Overview
Iron Mountain Incorporated is a global leader in storage and information management services. Founded in 1951, it serves over 225,000 organizations worldwide with a real estate network spanning approximately 90M square feet across 1,450 facilities. Iron Mountain specializes in secure records storage, information management, digital transformation, and data protection services, catering to diverse customer needs in a highly regulated environment.
Key similarities and differences
Both American Tower and Iron Mountain operate as specialty REITs in the real estate sector, emphasizing infrastructure critical to other industries. American Tower focuses on communications real estate, while Iron Mountain centers on storage and information management properties. Their business models differ in asset type and service scope, with American Tower emphasizing wireless infrastructure and Iron Mountain offering comprehensive data and document protection solutions.
Income Statement Comparison
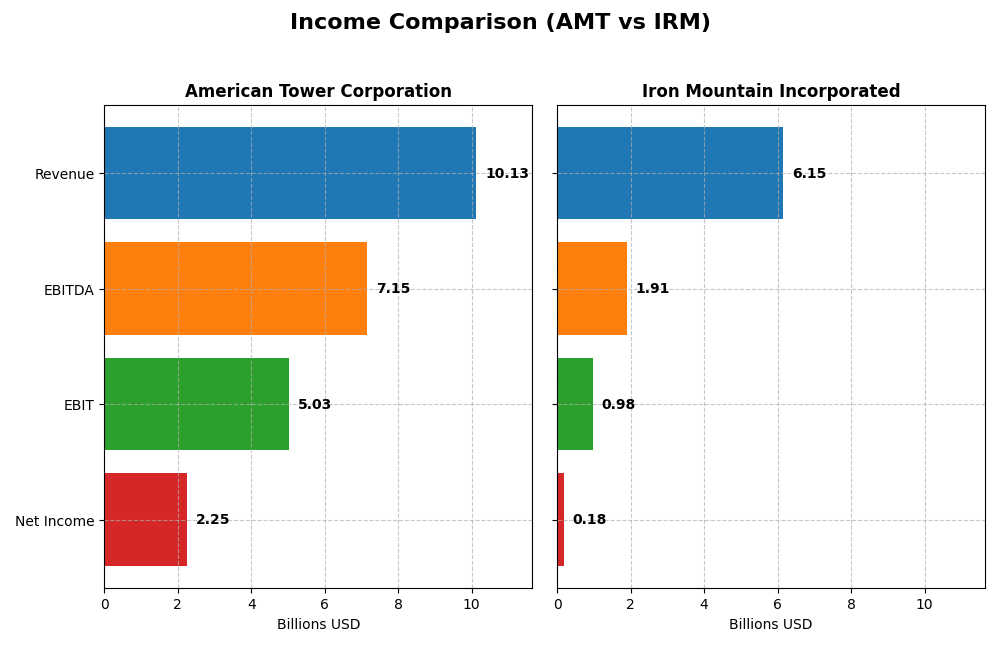
The table below presents a side-by-side comparison of the latest fiscal year income statement metrics for American Tower Corporation and Iron Mountain Incorporated.
| Metric | American Tower Corporation (AMT) | Iron Mountain Incorporated (IRM) |
|---|---|---|
| Market Cap | 79.7B | 25.8B |
| Revenue | 10.13B | 6.15B |
| EBITDA | 7.15B | 1.91B |
| EBIT | 5.03B | 981M |
| Net Income | 2.26B | 180M |
| EPS | 4.83 | 0.61 |
| Fiscal Year | 2024 | 2024 |
Income Statement Interpretations
American Tower Corporation
American Tower’s revenue grew steadily from $8.04B in 2020 to $10.13B in 2024, with net income rising from $1.69B to $2.25B. Gross and EBIT margins remained strong and stable, at about 74.6% and 49.7%, respectively. The 2024 year showed modest revenue growth of 1.15% but substantial EBIT and net margin improvements, highlighting enhanced profitability.
Iron Mountain Incorporated
Iron Mountain’s revenue demonstrated notable growth from $4.15B in 2020 to $6.15B in 2024, but net income declined sharply from $343M to $180M over the same period. Gross and EBIT margins were favorable at 56.2% and 16.0%. However, net margin was low at 2.93%, and 2024 showed a mixed picture with solid revenue and EBIT growth but declining net margin and EPS.
Which one has the stronger fundamentals?
American Tower exhibits stronger fundamentals, with consistent revenue and net income growth, high and improving margins, and favorable profitability metrics. Iron Mountain, despite its revenue expansion, suffers from declining net income and margin deterioration. American Tower’s income statement reflects better overall financial health and operational efficiency compared to Iron Mountain’s more challenged profitability profile.
Financial Ratios Comparison
The table below compares key financial ratios for American Tower Corporation (AMT) and Iron Mountain Incorporated (IRM) for the fiscal year 2024, providing a snapshot of their profitability, liquidity, leverage, and market valuation.
| Ratios | American Tower Corporation (AMT) | Iron Mountain Incorporated (IRM) |
|---|---|---|
| ROE | 66.67% | -35.81% |
| ROIC | 6.97% | 4.55% |
| P/E | 38.0 | 171.2 |
| P/B | 25.33 | -61.29 |
| Current Ratio | 0.45 | 0.55 |
| Quick Ratio | 0.45 | 0.55 |
| D/E (Debt-to-Equity) | 13.00 | -32.54 |
| Debt-to-Assets | 71.96% | 87.46% |
| Interest Coverage | 3.22 | 1.37 |
| Asset Turnover | 0.17 | 0.33 |
| Fixed Asset Turnover | 0.37 | 0.61 |
| Payout Ratio | 136.36% | 438.25% |
| Dividend Yield | 3.59% | 2.56% |
Interpretation of the Ratios
American Tower Corporation
American Tower shows strong profitability with a net margin of 22.27% and an exceptionally high return on equity of 66.67%, though its price-to-earnings (PE) and price-to-book (PB) ratios are elevated, indicating potential overvaluation. The company maintains a favorable dividend yield of 3.59%, supported by consistent payouts, but its low current and quick ratios, alongside high debt levels, raise liquidity concerns.
Iron Mountain Incorporated
Iron Mountain exhibits weak profitability metrics, including a low net margin of 2.93% and negative return on equity at -35.81%, reflecting operational challenges. Its dividend yield stands at 2.56%, but coverage appears pressured due to negative free cash flow metrics and high debt-to-assets ratio of 87.46%. The company’s liquidity ratios are below one, signaling potential short-term financial strain.
Which one has the best ratios?
Both companies face notable ratio weaknesses, particularly in liquidity and leverage. American Tower displays stronger profitability and a more balanced dividend profile despite some high valuation multiples. Iron Mountain’s negative returns and weaker coverage metrics contrast with its lower PB ratio. Overall, neither company presents an entirely favorable ratio set, but American Tower shows comparatively better financial health.
Strategic Positioning
This section compares the strategic positioning of American Tower Corporation and Iron Mountain Incorporated, focusing on market position, key segments, and exposure to technological disruption:
American Tower Corporation
- Leading global REIT owning ~219K communications sites; faces typical REIT competitive pressures.
- Key segments: primarily property rental (~$9.9B in 2024) with minor services revenue; business driven by communications real estate.
- Exposure mainly to communications infrastructure; technology may impact site development and management efficiency.
Iron Mountain Incorporated
- Global leader in storage and information management services with 1,450 facilities worldwide; competitive in specialty REIT sector.
- Key segments: global records and information management (~$5B in 2024) and data centers (~$620M in 2024); driven by secure storage and data services.
- Exposure to digital transformation and cloud services; technology disrupts traditional records storage but offers growth in data centers.
American Tower Corporation vs Iron Mountain Incorporated Positioning
American Tower’s strategy is concentrated on communications real estate, leveraging a large global site portfolio, while Iron Mountain pursues diversification across information management and data centers. American Tower’s focused specialization contrasts with Iron Mountain’s broader service range, balancing growth opportunities against operational complexity.
Which has the best competitive advantage?
American Tower shows a slightly favorable moat with growing profitability, indicating improving competitive strength. Iron Mountain’s very unfavorable moat with declining returns signals value destruction and weaker competitive positioning based on ROIC versus WACC trends.
Stock Comparison
The stock price chart over the past 12 months reveals contrasting movements with American Tower Corporation experiencing a bearish trend marked by deceleration, while Iron Mountain Incorporated shows a bullish trend that also decelerated.

Trend Analysis
American Tower Corporation’s stock declined by 8.98% over the past year, indicating a bearish trend with decelerating downward momentum. The price fluctuated between a high of 238.5 and a low of 170.33, with notable volatility at 17.37 std deviation.
Iron Mountain Incorporated’s stock gained 28.45% in the same period, reflecting a bullish trend but with decelerating growth. The price ranged from 67.98 to 127.7, and volatility measured at 13.66 std deviation.
Comparing both stocks, Iron Mountain delivered the highest market performance over the past year, outperforming American Tower by a wide margin despite recent short-term declines.
Target Prices
The consensus target prices for American Tower Corporation and Iron Mountain Incorporated suggest a positive outlook from analysts.
| Company | Target High | Target Low | Consensus |
|---|---|---|---|
| American Tower Corporation | 260 | 200 | 226 |
| Iron Mountain Incorporated | 120 | 120 | 120 |
Analysts expect American Tower’s stock to rise significantly above its current price of $170.33, while Iron Mountain’s target price of $120 also indicates upside potential from its current $87.32 share price.
Analyst Opinions Comparison
This section compares analysts’ ratings and grades for American Tower Corporation and Iron Mountain Incorporated:
Rating Comparison
AMT Rating
- Rating: B, considered Very Favorable overall by analysts.
- Discounted Cash Flow Score: 4, indicating a Favorable valuation outlook.
- ROE Score: 5, reflecting Very Favorable profitability from equity.
- ROA Score: 4, showing Favorable asset utilization efficiency.
- Debt To Equity Score: 1, indicating Very Unfavorable financial risk position.
- Overall Score: 3, rated as Moderate financial standing.
IRM Rating
- Rating: D+, considered Very Unfavorable overall by analysts.
- Discounted Cash Flow Score: 1, indicating a Very Unfavorable valuation outlook.
- ROE Score: 1, reflecting Very Unfavorable profitability from equity.
- ROA Score: 2, showing Moderate asset utilization efficiency.
- Debt To Equity Score: 1, indicating Very Unfavorable financial risk position.
- Overall Score: 1, rated as Very Unfavorable financial standing.
Which one is the best rated?
Based strictly on the provided data, American Tower Corporation is clearly better rated than Iron Mountain Incorporated across all key financial scores, except both share a very unfavorable debt-to-equity score.
Scores Comparison
Here is a comparison of the Altman Z-Score and Piotroski Score for the two companies:
AMT Scores
- Altman Z-Score: 1.18, indicating financial distress.
- Piotroski Score: 6, reflecting average financial health.
IRM Scores
- Altman Z-Score: 0.92, indicating financial distress.
- Piotroski Score: 5, reflecting average financial health.
Which company has the best scores?
Both AMT and IRM are in the distress zone according to their Altman Z-Scores, with AMT scoring slightly higher. AMT also has a marginally better Piotroski Score, suggesting a somewhat stronger financial health compared to IRM based on the provided data.
Grades Comparison
The following analysis presents the recent grades for American Tower Corporation and Iron Mountain Incorporated:
American Tower Corporation Grades
This table summarizes recent analyst grades from reputable grading companies for American Tower Corporation.
| Grading Company | Action | New Grade | Date |
|---|---|---|---|
| RBC Capital | Maintain | Sector Perform | 2025-12-19 |
| Morgan Stanley | Maintain | Overweight | 2025-12-05 |
| Barclays | Downgrade | Equal Weight | 2025-12-01 |
| Barclays | Maintain | Overweight | 2025-11-17 |
| Raymond James | Maintain | Strong Buy | 2025-10-29 |
| JP Morgan | Maintain | Overweight | 2025-10-29 |
| Wells Fargo | Maintain | Overweight | 2025-10-29 |
| BMO Capital | Maintain | Outperform | 2025-10-29 |
| Wells Fargo | Maintain | Overweight | 2025-10-20 |
| Barclays | Maintain | Overweight | 2025-10-17 |
American Tower Corporation’s grades mainly indicate a positive outlook, with consistent Overweight ratings and occasional Strong Buy and Outperform grades, balanced by a recent downgrade to Equal Weight from Barclays.
Iron Mountain Incorporated Grades
This table shows the recent analyst grades from reputable grading companies for Iron Mountain Incorporated.
| Grading Company | Action | New Grade | Date |
|---|---|---|---|
| Barclays | Maintain | Overweight | 2025-11-12 |
| JP Morgan | Maintain | Overweight | 2025-11-06 |
| Barclays | Maintain | Overweight | 2025-08-20 |
| JP Morgan | Maintain | Overweight | 2025-08-07 |
| Barclays | Maintain | Overweight | 2025-05-27 |
| Barclays | Maintain | Overweight | 2025-03-20 |
| JP Morgan | Maintain | Overweight | 2025-02-18 |
| Wells Fargo | Maintain | Overweight | 2025-02-04 |
| Barclays | Maintain | Overweight | 2025-01-28 |
| RBC Capital | Maintain | Outperform | 2024-11-27 |
Iron Mountain Incorporated consistently holds an Overweight rating across major grading companies, with a single Outperform rating from RBC Capital, indicating stable analyst confidence.
Which company has the best grades?
American Tower Corporation has received a broader range of positive grades, including Strong Buy and Outperform, while Iron Mountain’s grades are mainly Overweight with fewer top-tier ratings. Investors may perceive American Tower as having slightly stronger analyst enthusiasm, which could influence portfolio weighting decisions.
Strengths and Weaknesses
Here is a comparative overview of key strengths and weaknesses for American Tower Corporation (AMT) and Iron Mountain Incorporated (IRM) based on recent data:
| Criterion | American Tower Corporation (AMT) | Iron Mountain Incorporated (IRM) |
|---|---|---|
| Diversification | Strong property rental business with growing services revenue (Property ~$9.9B, Services ~$194M in 2024) | Moderate diversification between data centers and records management, with records management dominating (~$5.0B in 2024) |
| Profitability | Favorable net margin (22.3%), high ROE (66.7%), but neutral ROIC (6.97%) and mixed leverage metrics | Low net margin (2.9%), negative ROE (-35.8%), unfavorable ROIC (4.55%), high debt burden |
| Innovation | Growing ROIC trend indicating improving profitability, slight economic moat | Declining ROIC trend with very unfavorable moat status showing challenges in sustaining competitive advantage |
| Global presence | Large global footprint in wireless infrastructure | Global operations in data centers and information management, but slower growth in data center segment |
| Market Share | Leading position in wireless infrastructure with steady property revenue growth | Dominant in records management, but slower growth and profitability issues affect competitive stance |
Key takeaways: AMT shows improving profitability with a slightly favorable moat and solid market position in wireless infrastructure, though some financial ratios raise caution. IRM struggles with profitability and value creation, facing a very unfavorable moat and high leverage, signaling higher investment risk.
Risk Analysis
Below is a comparison table of key risks for American Tower Corporation (AMT) and Iron Mountain Incorporated (IRM) based on the most recent 2024 data.
| Metric | American Tower Corporation (AMT) | Iron Mountain Incorporated (IRM) |
|---|---|---|
| Market Risk | Moderate (Beta 0.93) | Higher (Beta 1.15) |
| Debt Level | High (Debt/Assets 72%) | Very High (Debt/Assets 87%) |
| Regulatory Risk | Moderate (Telecom regulations) | Moderate (Data privacy & storage) |
| Operational Risk | Moderate (Infrastructure reliant) | High (Data security critical) |
| Environmental Risk | Low (Real estate footprint) | Moderate (Facility energy usage) |
| Geopolitical Risk | Moderate (Global site exposure) | Moderate (Global storage network) |
Both companies show elevated financial leverage, with IRM’s debt level particularly concerning, indicating higher financial risk and vulnerability to interest rate changes. Market risk is greater for IRM, given its higher beta and sensitivity to economic shifts. Operational risks differ: AMT faces infrastructure and technology deployment challenges, while IRM must prioritize data security and regulatory compliance. Environmental and geopolitical risks are moderate for both due to their global footprints.
Overall, the most impactful and likely risks are IRM’s high debt burden and operational challenges in data management, and AMT’s financial leverage combined with market sensitivity. Caution is advised when considering these stocks, emphasizing risk management especially regarding debt and operational resilience.
Which Stock to Choose?
American Tower Corporation (AMT) shows a generally favorable income evolution with strong net margin growth and profitability, despite some unfavorable financial ratios like high debt and low liquidity. Its rating is very favorable, reflecting solid return on equity and asset utilization.
Iron Mountain Incorporated (IRM) has mixed income results with favorable revenue growth but declining net income and margins. Financial ratios are mostly unfavorable, including a negative return on equity and high debt levels, yet its rating remains very favorable, albeit with more financial risk than AMT.
Investors prioritizing growth and profitability might find AMT’s improving income and strong rating more appealing, while those who tolerate higher risk and seek value in a turnaround scenario could consider IRM, given its contrasting financial profile and income trends.
Disclaimer: Investment carries a risk of loss of initial capital. The past performance is not a reliable indicator of future results. Be sure to understand risks before making an investment decision.
Go Further
I encourage you to read the complete analyses of American Tower Corporation and Iron Mountain Incorporated to enhance your investment decisions: