Investors looking to capitalize on the booming digital infrastructure sector will find American Tower Corporation (AMT) and Equinix, Inc. (EQIX) compelling contenders. Both operate as specialty real estate investment trusts (REITs) with extensive portfolios of communications and data center properties, respectively. Their overlapping markets and innovation-driven growth highlight key opportunities and risks. In this article, I will help you determine which company better aligns with your investment goals.
Table of contents
Companies Overview
I will begin the comparison between American Tower Corporation and Equinix by providing an overview of these two companies and their main differences.
American Tower Corporation Overview
American Tower Corporation is a leading global REIT specializing in multitenant communications real estate. With a portfolio of approximately 219,000 communications sites, it focuses on owning, operating, and developing infrastructure that supports wireless communications. The company operates within the real estate sector, employing around 4,691 people and is headquartered in Boston, MA.
Equinix Overview
Equinix, Inc. is a global digital infrastructure REIT that enables businesses to interconnect and access digital services through a trusted platform. The company supports digital leaders by providing access to essential partners and infrastructure to accelerate growth and improve digital experiences. Headquartered in Redwood City, CA, Equinix employs about 13,606 people and operates in the real estate sector.
Key similarities and differences
Both American Tower and Equinix operate as specialty REITs within the real estate sector, focusing on infrastructure that supports digital and communications services. While American Tower concentrates on physical communications sites, Equinix emphasizes digital infrastructure and interconnection services. They differ in scale of workforce and market approach, with Equinix having a larger employee base and a broader platform for digital connectivity.
Income Statement Comparison
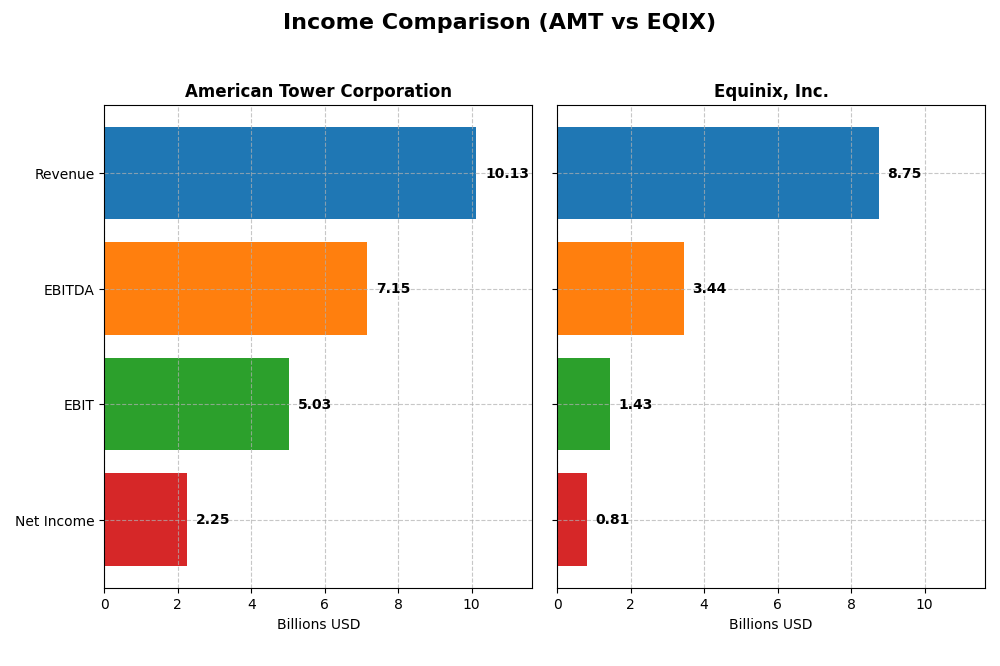
The table below compares the key income statement metrics for American Tower Corporation and Equinix, Inc. for the fiscal year 2024.
| Metric | American Tower Corporation | Equinix, Inc. |
|---|---|---|
| Market Cap | 79.7B | 76.3B |
| Revenue | 10.13B | 8.75B |
| EBITDA | 7.15B | 3.44B |
| EBIT | 5.03B | 1.43B |
| Net Income | 2.26B | 815M |
| EPS | 4.83 | 8.54 |
| Fiscal Year | 2024 | 2024 |
Income Statement Interpretations
American Tower Corporation
American Tower’s revenue grew steadily from 8.04B in 2020 to 10.13B in 2024, with net income rising from 1.69B to 2.25B over the same period. Margins remained robust, with a gross margin near 75% and a net margin above 22%. In 2024, growth slowed slightly but was offset by a 72% surge in EBIT and a 50% rise in net margin, showing enhanced profitability.
Equinix, Inc.
Equinix’s revenue increased from 6.00B in 2020 to 8.75B in 2024, with net income growing substantially from 370M to 815M. Gross margin stayed around 49%, while net margin was lower at 9.3%. However, in 2024 EBIT and net margin declined by over 6% and 21% respectively, indicating some operational challenges despite overall revenue growth during the period.
Which one has the stronger fundamentals?
American Tower demonstrates stronger fundamentals with consistently higher margins, a favorable EBIT margin near 50%, and recent improvements in profitability metrics. Although Equinix exhibits substantial overall net income growth, its recent margin compression and EBIT decline are less favorable. Both show favorable income evaluations, but American Tower’s steadier margin performance stands out.
Financial Ratios Comparison
The table below presents a side-by-side comparison of key financial ratios for American Tower Corporation (AMT) and Equinix, Inc. (EQIX) for the fiscal year 2024, providing insights into their profitability, liquidity, leverage, efficiency, and dividend metrics.
| Ratios | American Tower Corporation (AMT) | Equinix, Inc. (EQIX) |
|---|---|---|
| ROE | 66.67% | 6.02% |
| ROIC | 6.97% | 3.33% |
| P/E | 37.98 | 110.44 |
| P/B | 25.33 | 6.65 |
| Current Ratio | 0.45 | 1.63 |
| Quick Ratio | 0.45 | 1.63 |
| D/E (Debt-to-Equity) | 13.00 | 1.40 |
| Debt-to-Assets | 71.96% | 54.04% |
| Interest Coverage | 3.22 | 2.91 |
| Asset Turnover | 0.17 | 0.25 |
| Fixed Asset Turnover | 0.37 | 0.42 |
| Payout Ratio | 136.36% | 201.60% |
| Dividend Yield | 3.59% | 1.83% |
Interpretation of the Ratios
American Tower Corporation
American Tower shows strong profitability with a favorable net margin of 22.27% and an excellent return on equity at 66.67%, though its valuation multiples like P/E (37.98) and P/B (25.33) seem elevated. Liquidity ratios are weak, with a current ratio of 0.45 and high debt levels (D/E of 13.0). The company pays dividends, yielding 3.59%, supported by free cash flow, but leverage and coverage ratios warrant caution.
Equinix, Inc.
Equinix presents mixed results with a modest net margin of 9.32% and low returns on equity (6.02%) and invested capital (3.33%), reflecting weaker profitability. Liquidity appears solid with current and quick ratios around 1.63. Dividend yield is moderate at 1.83%. Despite less favorable leverage ratios and high valuation multiples (P/E 110.44), the company maintains a stable dividend backed by cash flow, though coverage metrics are neutral.
Which one has the best ratios?
Both companies face challenges with high valuation multiples and significant debt ratios. American Tower excels in profitability and dividend yield but suffers from liquidity and leverage concerns. Equinix has better liquidity but weaker profitability and return metrics. Overall, neither company achieves a fully favorable ratio profile, with both showing an unfavorable global evaluation.
Strategic Positioning
This section compares the strategic positioning of American Tower Corporation and Equinix, Inc., including market position, key segments, and exposure to technological disruption:
American Tower Corporation
- Leading global REIT with 219K communication sites; stable market position amid specialty REIT competition.
- Primary business in property rental with minor services revenue; driven by communications real estate assets.
- Operates in communications real estate with moderate disruption risk from evolving telecom technologies.
Equinix, Inc.
- Global digital infrastructure leader focusing on data centers; faces competitive pressure in digital services.
- Revenue driven by colocation, interconnection, and managed infrastructure services supporting digital businesses.
- Positioned in digital infrastructure; exposed to rapid technological changes demanding continuous innovation.
American Tower Corporation vs Equinix, Inc. Positioning
American Tower focuses on a diversified portfolio of communications real estate, while Equinix concentrates on digital infrastructure services. AMT benefits from physical asset scale; EQIX from digital connectivity, each with distinct sector-specific advantages and risks.
Which has the best competitive advantage?
Both companies are currently shedding value, but AMT’s slightly favorable moat with growing ROIC indicates a modest competitive advantage, whereas EQIX’s slightly unfavorable moat suggests more challenges sustaining profitability.
Stock Comparison
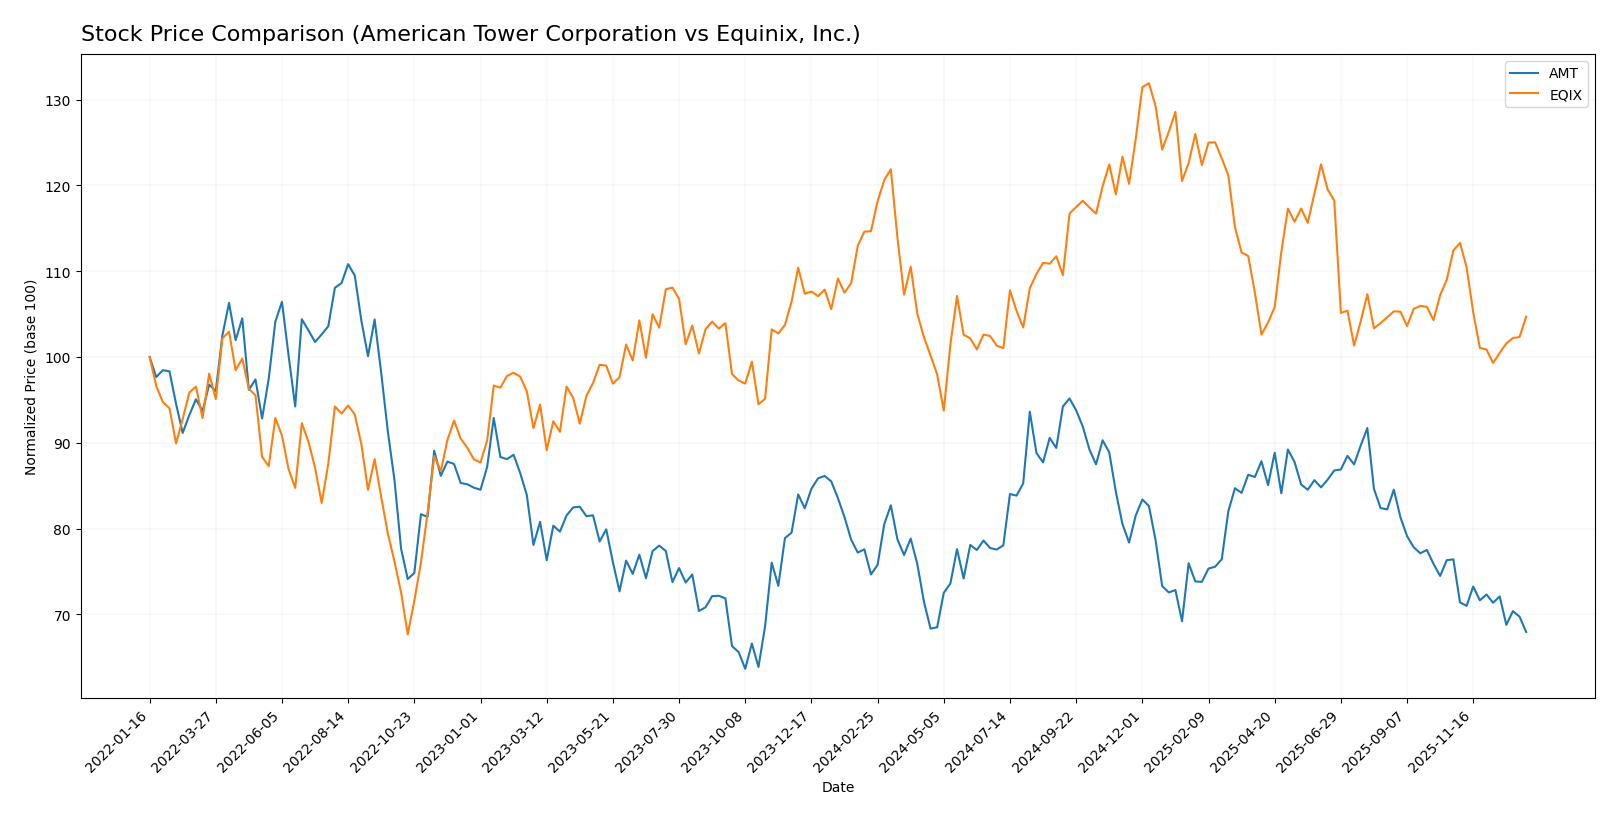
The past year shows a clear bearish trend for both American Tower Corporation (AMT) and Equinix, Inc. (EQIX), with declining stock prices and decelerating momentum in trading dynamics.
Trend Analysis
American Tower Corporation’s stock fell by 8.98% over the past 12 months, indicating a bearish trend with decelerating decline. The price ranged between $170.33 and $238.5, showing moderate volatility (std deviation 17.37).
Equinix, Inc. experienced a 8.68% price drop over the same period, also a bearish trend with deceleration. Its stock showed higher volatility (std deviation 66.16), fluctuating between $700.18 and $985.0.
Comparing both, AMT and EQIX delivered similar bearish performances, with AMT slightly underperforming. EQIX’s stock showed greater volatility but marginally less price decline.
Target Prices
Analysts present a clear target price consensus for American Tower Corporation and Equinix, Inc.
| Company | Target High | Target Low | Consensus |
|---|---|---|---|
| American Tower Corporation | 260 | 200 | 226 |
| Equinix, Inc. | 973 | 795 | 900 |
The consensus targets for both REITs exceed current stock prices—American Tower at $170.33 vs. $226 consensus, Equinix at $781.88 vs. $900 consensus—indicating potential upside based on analyst expectations.
Analyst Opinions Comparison
This section compares analysts’ ratings and grades for American Tower Corporation and Equinix, Inc.:
Rating Comparison
AMT Rating
- Rating: B, evaluated as Very Favorable overall.
- Discounted Cash Flow Score: 4, Favorable indication of valuation.
- ROE Score: 5, Very Favorable for efficient profit generation from equity.
- ROA Score: 4, Favorable use of assets to generate earnings.
- Debt To Equity Score: 1, Very Unfavorable, indicating high financial risk.
- Overall Score: 3, Moderate overall financial standing.
EQIX Rating
- Rating: C, also marked Very Favorable overall.
- Discounted Cash Flow Score: 1, Very Unfavorable indication of valuation.
- ROE Score: 4, Favorable but lower than AMT’s.
- ROA Score: 3, Moderate effectiveness in asset utilization.
- Debt To Equity Score: 1, Very Unfavorable, similar financial risk level.
- Overall Score: 2, Moderate but lower than AMT.
Which one is the best rated?
Based strictly on the provided data, American Tower Corporation is better rated overall with a higher rating (B vs. C) and superior scores in discounted cash flow, ROE, ROA, and overall score, despite both having very unfavorable debt-to-equity scores.
Scores Comparison
The scores comparison between American Tower Corporation (AMT) and Equinix, Inc. (EQIX) is as follows:
AMT Scores
- Altman Z-Score of 1.18 places AMT in the distress zone, indicating higher bankruptcy risk.
- Piotroski Score of 6 classifies AMT’s financial strength as average.
EQIX Scores
- Altman Z-Score of 2.12 places EQIX in the grey zone, indicating moderate bankruptcy risk.
- Piotroski Score of 6 classifies EQIX’s financial strength as average.
Which company has the best scores?
Based on the provided data, EQIX has a better Altman Z-Score indicating lower bankruptcy risk compared to AMT. Both companies have the same Piotroski Score of 6, reflecting average financial strength.
Grades Comparison
Here is a comparison of the recent grades and ratings for American Tower Corporation and Equinix, Inc.:
American Tower Corporation Grades
This table summarizes the latest grades assigned by reputable grading companies for American Tower Corporation.
| Grading Company | Action | New Grade | Date |
|---|---|---|---|
| RBC Capital | Maintain | Sector Perform | 2025-12-19 |
| Morgan Stanley | Maintain | Overweight | 2025-12-05 |
| Barclays | Downgrade | Equal Weight | 2025-12-01 |
| Barclays | Maintain | Overweight | 2025-11-17 |
| Raymond James | Maintain | Strong Buy | 2025-10-29 |
| JP Morgan | Maintain | Overweight | 2025-10-29 |
| Wells Fargo | Maintain | Overweight | 2025-10-29 |
| BMO Capital | Maintain | Outperform | 2025-10-29 |
| Wells Fargo | Maintain | Overweight | 2025-10-20 |
| Barclays | Maintain | Overweight | 2025-10-17 |
American Tower Corporation’s grades show a general trend of stable positive ratings, mainly maintaining Overweight and Outperform positions, with one recent downgrade to Equal Weight.
Equinix, Inc. Grades
This table presents the recent grades from established grading firms for Equinix, Inc.
| Grading Company | Action | New Grade | Date |
|---|---|---|---|
| BMO Capital | Upgrade | Outperform | 2025-12-03 |
| Truist Securities | Maintain | Buy | 2025-11-18 |
| JP Morgan | Maintain | Overweight | 2025-10-30 |
| TD Cowen | Maintain | Buy | 2025-10-30 |
| Barclays | Maintain | Equal Weight | 2025-08-20 |
| Truist Securities | Maintain | Buy | 2025-08-07 |
| JP Morgan | Maintain | Overweight | 2025-07-31 |
| JMP Securities | Maintain | Market Outperform | 2025-07-22 |
| Barclays | Maintain | Equal Weight | 2025-07-11 |
| UBS | Maintain | Buy | 2025-07-11 |
Equinix, Inc. consistently receives positive ratings, primarily Buy and Outperform, with a recent upgrade by BMO Capital enhancing its outlook.
Which company has the best grades?
Both companies hold a consensus “Buy” rating, but Equinix, Inc. has slightly more upgrades and consistent Buy to Outperform grades, while American Tower Corporation shows a mix of Overweight and Outperform ratings with a recent downgrade. This pattern may influence investor perception of relative momentum and risk.
Strengths and Weaknesses
Below is a comparative table highlighting key strengths and weaknesses of American Tower Corporation (AMT) and Equinix, Inc. (EQIX) based on their latest financial and operational data.
| Criterion | American Tower Corporation (AMT) | Equinix, Inc. (EQIX) |
|---|---|---|
| Diversification | Moderate; primarily focused on property rental (9.93B USD in 2024) with small services revenue (194M USD) | Moderate; significant recurring revenues (8.18B USD) with multiple segments like Co-Location and Interconnection |
| Profitability | Strong net margin (22.27%) and high ROE (66.67%); ROIC growing but close to WACC (6.97% vs 6.37%) | Lower net margin (9.32%) and ROE (6.02%); ROIC below WACC (3.33% vs 7.5%) but improving |
| Innovation | Limited innovation indicators; stable but slow growth in services | More diversified revenue streams suggest some innovation in managed infrastructure and interconnection services |
| Global presence | Extensive global footprint in wireless infrastructure | Strong global data center presence with expanding interconnection services |
| Market Share | Large market share in wireless tower rental sector | Leading position in data center colocation and interconnection markets |
Key takeaways: AMT shows strong profitability and a growing return on capital but faces challenges in diversification and financial leverage. EQIX is innovating through diversified services but currently struggles with profitability metrics and value creation. Both companies exhibit growing ROIC trends, a positive sign for future prospects.
Risk Analysis
Below is a comparative overview of key risks for American Tower Corporation (AMT) and Equinix, Inc. (EQIX) based on the most recent 2024 data:
| Metric | American Tower Corporation (AMT) | Equinix, Inc. (EQIX) |
|---|---|---|
| Market Risk | Beta 0.93 (moderate volatility) | Beta 1.04 (higher volatility) |
| Debt Level | High leverage: Debt/Assets 72% | Moderate leverage: Debt/Assets 54% |
| Regulatory Risk | Moderate (global telecom regulations) | Moderate (data privacy and infrastructure regulations) |
| Operational Risk | Medium (site management complexity) | Medium-High (data center operations and cybersecurity) |
| Environmental Risk | Moderate (site environmental impact) | Moderate (energy consumption, carbon footprint) |
| Geopolitical Risk | Elevated (global footprint, emerging markets exposure) | Elevated (global operations, geopolitical tensions) |
Synthesis: Both AMT and EQIX face significant leverage risk, with AMT’s debt-to-assets ratio at 72%, indicating higher financial risk compared to EQIX’s 54%. Market volatility is slightly higher for EQIX. Geopolitical risks remain impactful due to their global operations. Operational and regulatory risks are moderate but require close monitoring, especially cybersecurity for EQIX. Investors should weigh leverage and geopolitical exposure carefully when considering these stocks.
Which Stock to Choose?
American Tower Corporation (AMT) shows a generally favorable income statement with strong profitability and improving margins over 2020-2024, though revenue growth slowed recently. Its financial ratios reveal high return on equity (67%) but unfavorable liquidity and leverage metrics, with a high debt burden and moderate interest coverage. The company holds a very favorable “B” rating overall, despite some valuation and balance sheet concerns. The Altman Z-Score signals financial distress risk, while the Piotroski score is average.
Equinix, Inc. (EQIX) presents a favorable income evolution with solid long-term net income and margin growth, though recent profitability declined. Its financial ratios reflect neutral to unfavorable profitability and efficiency, with lower returns on equity (6%) and invested capital, but better liquidity ratios and moderate debt levels than AMT. EQIX’s overall rating is very favorable “C,” but discounted cash flow and valuation scores are weak. The Altman Z-Score places it in a moderate risk zone, with an average Piotroski score.
Considering ratings and the comprehensive evaluation of income and financial ratios, AMT may appear more favorable for investors prioritizing strong profitability and earnings growth despite higher leverage risks. Conversely, EQIX might be seen as more suitable for those valuing better liquidity and somewhat lower financial risk, though with modest returns. The choice could depend significantly on the investor’s risk tolerance and preference for growth versus stability.
Disclaimer: Investment carries a risk of loss of initial capital. The past performance is not a reliable indicator of future results. Be sure to understand risks before making an investment decision.
Go Further
I encourage you to read the complete analyses of American Tower Corporation and Equinix, Inc. to enhance your investment decisions: